. 2016 Jul;95(1):15.
doi: 10.1095/biolreprod.116.138388. Epub 2016 Jun 8.

Initial Segment Differentiation Begins During a Critical Window and Is Dependent upon Lumicrine Factors and SRC Proto-Oncogene (SRC) in the Mouse

Affiliations

Initial Segment Differentiation Begins During a Critical Window and Is Dependent upon Lumicrine Factors and SRC Proto-Oncogene (SRC) in the Mouse

Bingfang Xu et al. Biol Reprod. 2016 Jul.

Abstract

Without a fully developed and functioning initial segment, the most proximal region of the epididymis, male infertility results. Therefore, it is important to understand the development of the initial segment. During postnatal development of the epididymis, many cellular processes of the initial segment are regulated by lumicrine factors, which are produced by the testis and enter the epididymis with testicular luminal fluid. In this report, we showed that prior to Postnatal Day 15 (P15), the initial segment was lumicrine factor independent in the mouse. However, from P19 onward, lumicrine factors were essential for the proliferation and survival of initial segment epithelial cells. Therefore, P15 to P19 was a critical window that established the dependency of lumicrine factors in the initial segment epithelium. The initial segment-specific kinase activity profile, a marker of initial segment differentiation, was also established during this window. The SFK (SRC proto-oncogene family kinases), ERK pathway (known as the RAF/MEK/ERK pathway) components, and AMPK (AMP-activated protein kinases) pathway components had increased activities from P15 to P19, suggesting that lumicrine factors regulated SFK/ERK/AMPK signaling to initiate differentiation of the initial segment from P15 to P19. Compared with litter mate controls, juvenile Src null mice displayed lower levels of MAPK3/1 (mitogen-activated protein kinase 3/1) activity and a reduced level of differentiation in the initial segment epithelium, a similar phenotype resulting from inhibition of SRC activity within the window of P15 to P19. Therefore, lumicrine factor-dependent SRC activity signaling through MAPK3/1 is important for the initiation of initial segment differentiation during a critical window of development.

Keywords: ERK pathway; SRC; differentiation; epididymis; lumicrine regulation.


Figures

FIG. 1
FIG. 1
Lumicrine factor dependency of the initial segment epithelium. A) Measurement of cell proliferation in the initial segment after 24 h of EDL, which was performed from the ages of 2 wk to adult. B) Measurement of cell proliferation at the age of 3 wk after 1 wk or 24 h of EDL, which was performed at the ages of either 2 wk or 3 wk, respectively. C) Measurement of cell proliferation after 24 h of EDL, which was performed at P15 and P19, respectively. D) Measurement of apoptosis in the initial segment after 24 h of EDL, which was performed from the ages of 2 wk to adult. E) Measurement of apoptosis after 24 h of EDL, which was performed at P15 and P19, respectively. F) A diagram shows that P15 to P19 is a critical window for the initial segment epithelium to establish lumicrine factor dependence during postnatal development. Cell proliferation was measured by counting p-Histone H3-positive cells per epithelial area. Apoptosis was measured by counting cleaved-Caspase3-positive cells per epididymal area. Data shown are mean ± SEM, n ≥ 3. **P < 0.01 versus sham; *P < 0.05 versus sham.
FIG. 2
FIG. 2
Activation of SFK from P15 to P19 in the initial segment. AC) A representative panel of images showing the levels of SFK phosphorylated at Y416, an activation site, from P15 to P19 in regions I and III. A dotted line shows the border between regions I and III. An arrow and an arrowhead show labeling of phospho-SFK at Y416 at the basolateral membrane of epithelial cells at P19 in regions I and III, respectively. A line across basolateral membranes at the midway point from apical to basal ends of epithelial cells represents the lines used to quantify labeling intensity. DF) A representative panel of images showing the levels of SFK phosphorylated at Y527, an inhibitory site, in region I from P15 to P19. GI) A representative panel of images showing total SFK protein levels in region I from P15 to P19. J) Quantification of labeling intensity of phospho-SRC Y416, phospho-SRC Y527, and total SRC at the basolateral membrane from P15 to P19. Each panel of images was taken from the same slide, which contained tissue sections from P15 to P19. Labeling intensity along the lines across the basolateral membrane of epithelial cells was measured using ImageJ Plot Profile and was shown in arbitrary units.
FIG. 3
FIG. 3
Phosphorylation or protein levels of RAF1, RPS6, CCND1, and AR from P15 to P19 in the initial segment. AC) A representative panel of images showing the levels of RAF1 phosphorylated at S259 in region I from P15 to P19. A line across basolateral membranes at the midway point from the apical to the basal ends of epithelial cells represents the lines used to quantify labeling intensity. DF) A representative panel of images showing the levels of RPS6 phosphorylated at S235/236 in regions I, II, and III from P15 to P19. ED: efferent ducts. A square at region II represents the squares used to quantify labeling intensity. GI) A representative panel of images showing the protein levels of CCND1 in region I from P15 to P19. JL) A representative panel of images showing the protein levels of AR in region I from P15 to P19. A line across multiple nuclei represents the lines used to quantify labeling intensity. M) Quantification of labeling intensity of phospho-RAF1 at the basolateral membrane, phospho-RPS6 in region II, CCND1, and AR in the nuclei from P15 to P19. Each panel of images was taken from the same slide, which contained tissue sections from P15 to P19. Labeling intensity along the lines or within the squares was measured using ImageJ Plot Profile or ImageJ Histogram function, respectively, and it was shown in arbitrary units.
FIG. 4
FIG. 4
Activation of the AMPK pathway components from P15 to P19 in the initial segment. AC) A representative panel of images showing the levels of AMPKβ1/2 phosphorylated at S108 in regions I and III from P15 to P19. An arrow and an arrowhead show phospho-AMPKβ1/2 labeling at the basolateral membrane of epithelial cells at P19 in regions I and III, respectively. A line across basolateral membranes at the midway point from the apical to the basal ends of epithelial cells represents the lines used to quantify labeling intensity. DF) A representative panel of images showing the protein levels of AMPKβ1/2 in region I and III from P15 to P19. A square in the cytoplasmic area represents the squares used to quantify labeling intensity. GI) A representative panel of images showing the levels of ACC phosphorylated at S79 in regions I and III from P15 to P19. JL) A representative panel of images showing the protein levels of ACC from P15 to P19 in regions I and III. M) Quantification of labeling intensity of phospho-AMPKβ1/2 at the basolateral membrane, AMPKβ1/2, phospho-ACC, and ACC in the cytoplasm from P15 to P19. The dotted lines show the border between regions I and III. Each panel of images was taken from the same slide, which contained tissue sections from P15 to P19. Labeling intensity along the lines or within the squares was measured using ImageJ Plot Profile or ImageJ Histogram function, respectively, and it was shown in arbitrary units.
FIG. 5
FIG. 5
Phosphorylation or protein levels of EGFR, MET, and PTEN from P15 to P28 in the initial segment. AD) A representative panel of images showing the levels of EGFR phosphorylated at Y1045 in region I from P15 to P28. A line along the apical membrane represents the lines used to quantify labeling intensity. An arrow shows the labeling of phospho-EGFR at/near the apical membrane at P28. EH) A representative panel of images showing the levels of MET phosphorylated at T1234/1235 in region I from P15 to P28. An arrow shows the labeling of phospho-MET at/near the apical membrane at P28. IL) A representative panel of images showing the protein levels of PTEN in regions I and III from P15 to P28. An arrow and an arrowhead show the PTEN labeling at/near the apical membrane at P28 in regions I and III, respectively. M) Quantification of labeling intensity of phospho-EGFR, phospho-MET, and PTEN at the apical membrane from P15 to P28. The dotted line shows the border between regions I and III. Each panel of images was taken from the same slide, which contained tissue sections from P15 to P28. Labeling intensity along the lines was measured using ImageJ Plot Profile and was shown in arbitrary units.
FIG. 6
FIG. 6
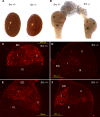
A reduced initial segment size and reduced levels of phospho-MAPK3/1 following loss of Src. A) Testes from Src+/− and Src−/−. The testis size is comparable between controls and knockouts. B) Proximal epididymal regions (I, II, and III) from Src+/− and Src−/−. Epididymal regions I, II, and III of Src−/− were smaller and underdeveloped compared with controls. CF) Representative images of phospho-MAPK3/1 labeling in epididymal regions I, II, and III in Src+/− (C and E) and Src−/− (D and F) at P17. ED: efferent ducts.
FIG. 7
FIG. 7
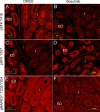
A reduced level of SRC and MAPK3/1 activities following SRC inhibition. A and B) Comparison of phospho-SFK levels at Y416 in region I between control and treatment groups. C and D) Comparison of phospho-SFK levels at Y527 in region I between control and treatment groups. E and F) Comparison of MAPK3/1 activities in region I between control and treatment groups. ED: efferent ducts. The dotted lines show the border between region I and ED.

References

    1. Hinton BT, Galdamez MM, Sutherland A, Bomgardner D, Xu B, Abdel-Fattah R, Yang L. How do you get six meters of epididymis inside a human scrotum? J Androl. 2011;32:558–564. - PubMed
    1. Robaire B, Hinton BT. The epididymis. In: Plant T, Zeleznik AJ, editors. Knobil and Neill's Physiology of Reproduction, 4th ed. New York: Elsevier; 2014. pp. 691–772. In. (eds.)
    1. Jelinsky SA, Turner TT, Bang HJ, Finger JN, Solarz MK, Wilson E, Brown EL, Kopf GS, Johnston DS. The rat epididymal transcriptome: comparison of segmental gene expression in the rat and mouse epididymides. Biol Reprod. 2007;76:561–570. - PubMed
    1. Johnston DS, Turner TT, Finger JN, Owtscharuk TL, Kopf GS, Jelinsky SA. Identification of epididymis-specific transcripts in the mouse and rat by transcriptional profiling. Asian J Androl. 2007;9:522–527. - PubMed
    1. Sonnenberg-Riethmacher E, Walter B, Riethmacher D, Godecke S, Birchmeier C. The c-ros tyrosine kinase receptor controls regionalization and differentiation of epithelial cells in the epididymis. Genes Dev. 1996;10:1184–1193. - PubMed

Publication types

Substances