

Automated detection and analysis of depolarization events in human cardiomyocytes using MaDEC
- PMID: 27281718
- PMCID: PMC4938768
- DOI: 10.1016/j.compbiomed.2016.05.011
Automated detection and analysis of depolarization events in human cardiomyocytes using MaDEC
Abstract
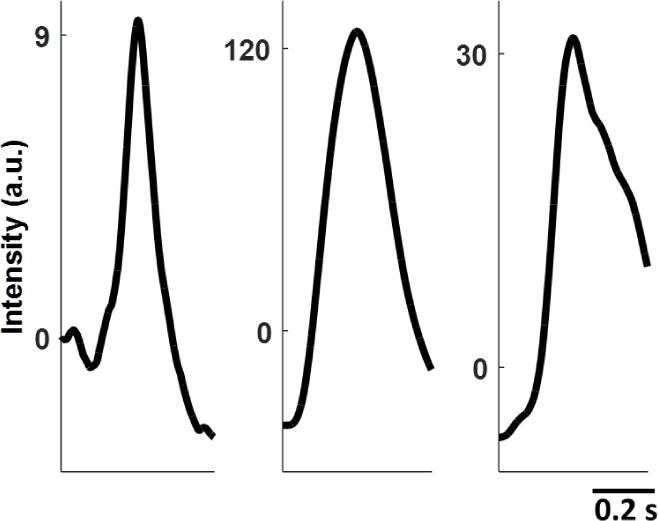
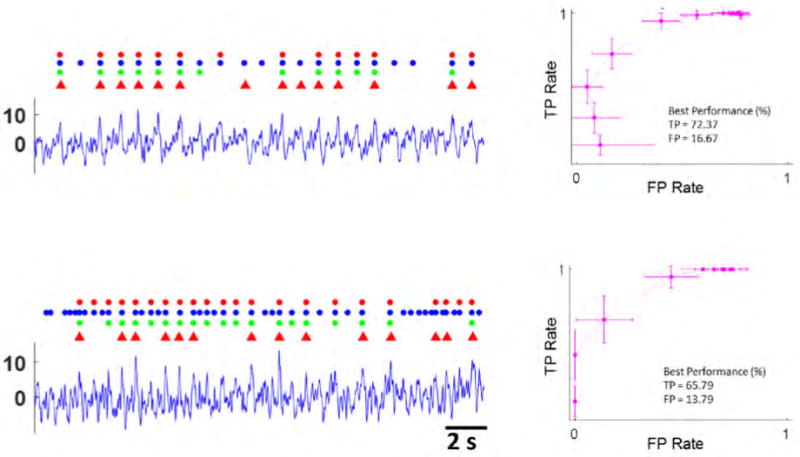
Optical imaging-based methods for assessing the membrane electrophysiology of in vitro human cardiac cells allow for non-invasive temporal assessment of the effect of drugs and other stimuli. Automated methods for detecting and analyzing the depolarization events (DEs) in image-based data allow quantitative assessment of these different treatments. In this study, we use 2-photon microscopy of fluorescent voltage-sensitive dyes (VSDs) to capture the membrane voltage of actively beating human induced pluripotent stem cell-derived cardiomyocytes (hiPS-CMs). We built a custom and freely available Matlab software, called MaDEC, to detect, quantify, and compare DEs of hiPS-CMs treated with the β-adrenergic drugs, propranolol and isoproterenol. The efficacy of our software is quantified by comparing detection results against manual DE detection by expert analysts, and comparing DE analysis results to known drug-induced electrophysiological effects. The software accurately detected DEs with true positive rates of 98-100% and false positive rates of 1-2%, at signal-to-noise ratios (SNRs) of 5 and above. The MaDEC software was also able to distinguish control DEs from drug-treated DEs both immediately as well as 10min after drug administration.
Keywords: Classification; Matched filter; Signal detection; Voltage-sensitive dye imaging; hiPS derived cardiomyocytes.
Copyright © 2016 Elsevier Ltd. All rights reserved.
Figures


Similar articles
-
Supervised Machine Learning for Classification of the Electrophysiological Effects of Chronotropic Drugs on Human Induced Pluripotent Stem Cell-Derived Cardiomyocytes.PLoS One. 2015 Dec 22;10(12):e0144572. doi: 10.1371/journal.pone.0144572. eCollection 2015. PLoS One. 2015. PMID: 26695765 Free PMC article.
-
Image-based evaluation of contraction-relaxation kinetics of human-induced pluripotent stem cell-derived cardiomyocytes: Correlation and complementarity with extracellular electrophysiology.J Mol Cell Cardiol. 2014 Dec;77:178-91. doi: 10.1016/j.yjmcc.2014.09.010. Epub 2014 Sep 23. J Mol Cell Cardiol. 2014. PMID: 25257913
-
High-throughput cardiac safety evaluation and multi-parameter arrhythmia profiling of cardiomyocytes using microelectrode arrays.Toxicol Appl Pharmacol. 2015 Oct 15;288(2):249-57. doi: 10.1016/j.taap.2015.07.024. Epub 2015 Jul 29. Toxicol Appl Pharmacol. 2015. PMID: 26232523
-
Signal analysis and classification methods for the calcium transient data of stem cell-derived cardiomyocytes.Comput Biol Med. 2015 Jun;61:1-7. doi: 10.1016/j.compbiomed.2015.03.016. Epub 2015 Mar 24. Comput Biol Med. 2015. PMID: 25841082
-
Cardiac safety pharmacology: from human ether-a-gogo related gene channel block towards induced pluripotent stem cell based disease models.Expert Opin Drug Saf. 2012 Mar;11(2):285-98. doi: 10.1517/14740338.2012.639358. Epub 2011 Nov 22. Expert Opin Drug Saf. 2012. PMID: 22103746 Review.
References
-
- Bébarová M. Advances in patch clamp technique: towards higher quality and quantity. General Physiology and Biophysics, pages. 2012:131–140. - PubMed
-
- Devalla HD, Schwach V, Ford JW, Milnes JT, El-haou S, Jackson C, Gkatzis K, Elliott DA, Chuva SM, Lopes DS, Mummery CL, Verkerk AO, Passier R. Atrial-like cardiomyocytes from human pluripotent stem cells are a robust preclinical model for assessing atrial-selective pharmacology. EMBO Molecular Medicine. 2015;7(4):394–410. - PMC - PubMed
MeSH terms
Substances
Grants and funding
LinkOut - more resources
Full Text Sources
Other Literature Sources
