. 2016 Aug 1;116(2):844-58.
doi: 10.1152/jn.00048.2016. Epub 2016 Jun 8.

A physiological and behavioral system for hearing restoration with cochlear implants

Affiliations

A physiological and behavioral system for hearing restoration with cochlear implants

Julia King et al. J Neurophysiol. .

Abstract

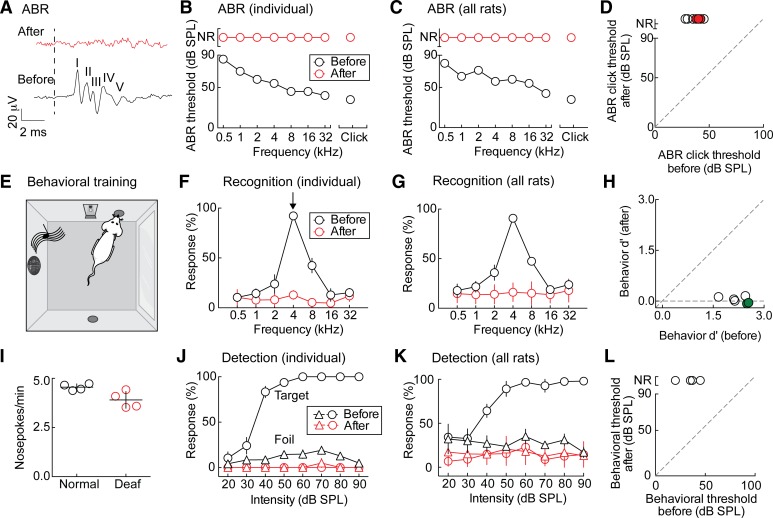
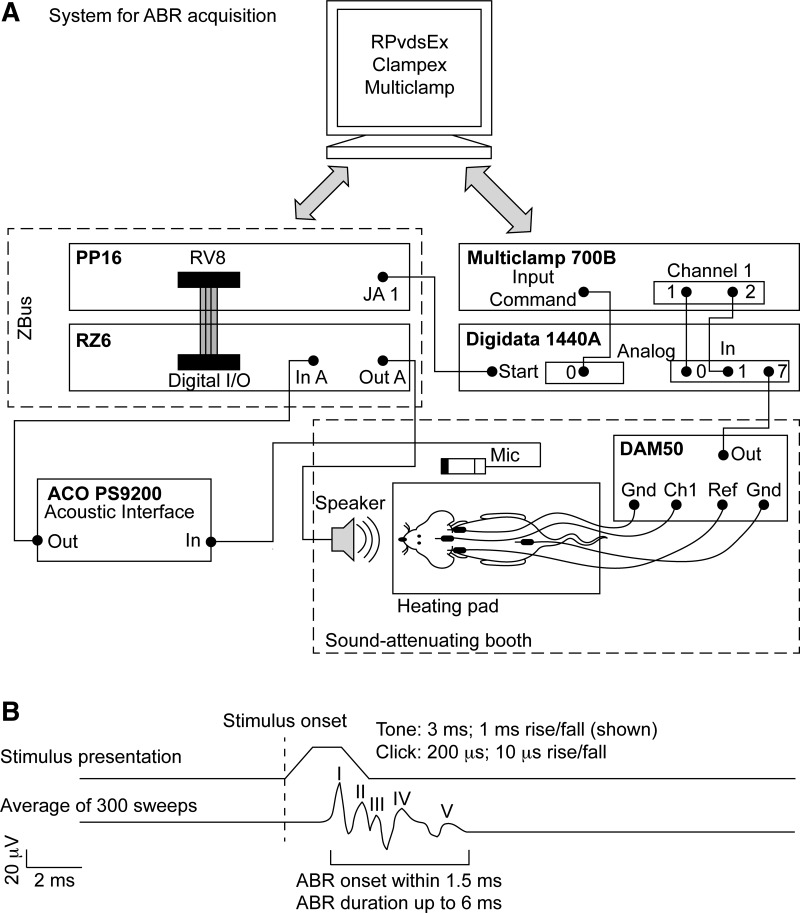
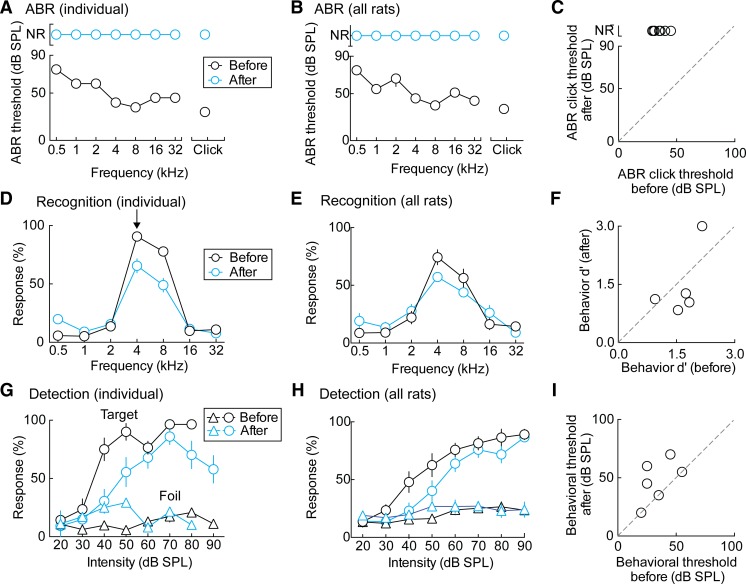
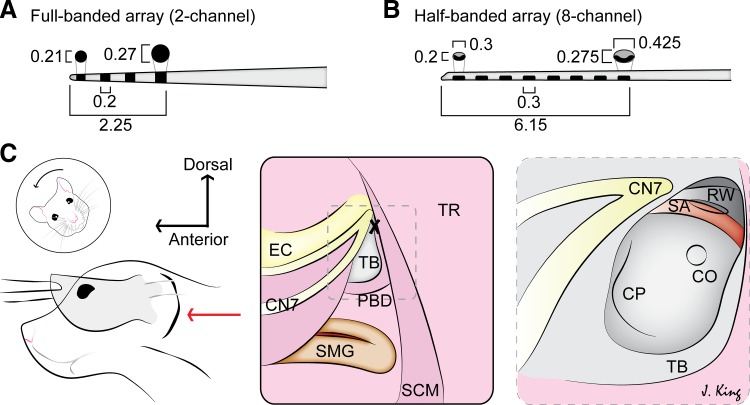
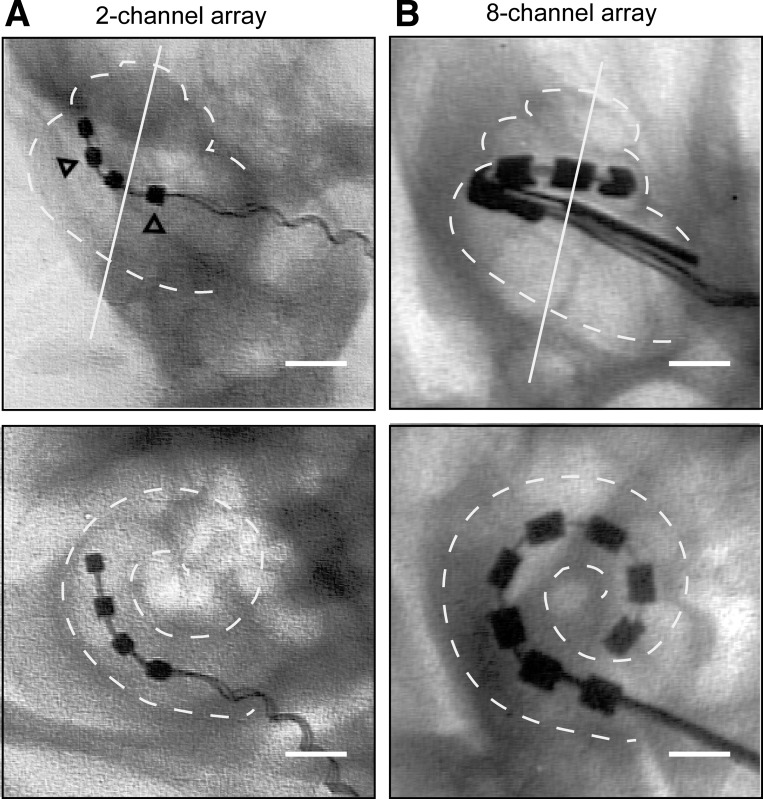
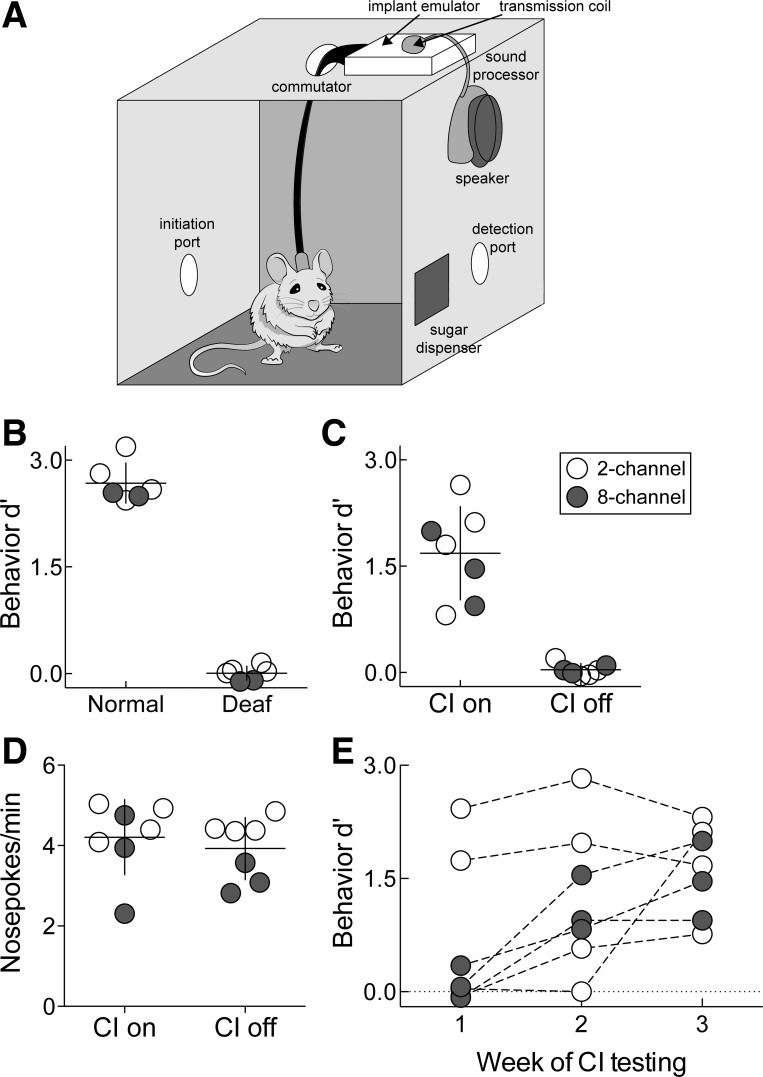
Cochlear implants are neuroprosthetic devices that provide hearing to deaf patients, although outcomes are highly variable even with prolonged training and use. The central auditory system must process cochlear implant signals, but it is unclear how neural circuits adapt-or fail to adapt-to such inputs. The knowledge of these mechanisms is required for development of next-generation neuroprosthetics that interface with existing neural circuits and enable synaptic plasticity to improve perceptual outcomes. Here, we describe a new system for cochlear implant insertion, stimulation, and behavioral training in rats. Animals were first ensured to have significant hearing loss via physiological and behavioral criteria. We developed a surgical approach for multichannel (2- or 8-channel) array insertion, comparable with implantation procedures and depth in humans. Peripheral and cortical responses to stimulation were used to program the implant objectively. Animals fitted with implants learned to use them for an auditory-dependent task that assesses frequency detection and recognition in a background of environmentally and self-generated noise and ceased responding appropriately to sounds when the implant was temporarily inactivated. This physiologically calibrated and behaviorally validated system provides a powerful opportunity to study the neural basis of neuroprosthetic device use and plasticity.

Keywords: auditory cortex; behavior; cochlear implants; deafness; rats.


Figures

Fig. 1.
Fig. 1.
Sensorineural hearing loss in rats. A: typical ABR waveforms for an 80-dB SPL click stimulus in the normal hearing condition (black); stimulus onset marked with dotted line. The discernable peaks are labeled I–V. ABR waveform for 80 dB SPL click stimulus in the bilaterally deafened condition is shown in red. B: ABR threshold comparison in an example animal. The black line represents the thresholds for each stimulus frequency in the normal hearing animal; the red line is for the same animal after deafening. C: ABR threshold comparison for all animals, shown as mean threshold in the normal hearing (black) and deafened (red) conditions. D: summary of ABR click thresholds before and after deafening. Open circles denote animals tested up to 90 dB SPL (n = 4); filled, red circles denote animals tested up to 110 dB SPL (n = 3). ABR click threshold before deafening: 37 ± 2 dB SPL; ABR click threshold after deafening: nonresponsive (NR). E: parametric, self-initiated, acoustic go/no-go task. F: behavioral target recognition comparison in an example animal. Black is normal hearing baseline; red is the same animal after deafening. G: behavioral target recognition across all animals, shown as means ± SE. H: summary of behavioral d′ before and after deafening (d′ before deafening: 2.23 ± 0.14; d′ after deafening: 0.02 ± 0.04, P < 0.0001, Student's paired two-tailed t-test). Open circles indicate animals trained on the 4-kHz target-tone task (n = 4); filled, green circles indicate animals trained on the 22.6-kHz target-tone task (n = 2). I: self-initiation rate in the normal hearing (black) and deafened (red) conditions (self-initiation rate before deafening: 4.6 ± 0.1 pokes/min; self-initiation rate after deafening: 3.9 ± 0.2 pokes/min, P > 0.05, Student's paired two-tailed t-test). J: behavioral target detection comparison in an example animal. Black is normal hearing; red is after deafening. K: behavioral target detection across all animals, shown as means ± SE. L: summary of behavioral hearing threshold before and after deafening (threshold before deafening: 34 ± 5 dB SPL; threshold after deafening: nonresponsive).
Fig. 2.
Fig. 2.
Schematic of the ABR setup. A: wiring diagram. Rats were positioned in a sound-attenuating booth on a direct current temperature-controlling heating pad with 20 cm between the leading edge of the speaker and the rat's interaural axis. During calibration, the microphone is positioned at the same height and at the putative interaural axis. Subdermal needle electrodes (Rhythmlink International, Columbia, SC) are placed at the vertex [recording/channel 1 (Ch1)], left mastoid [reference (Ref)], right mastoid [ground (Gnd)], and lower back (Gnd). Electrode signals are amplified (DAM50; World Precision Instruments), digitized (Digidata 1440A; Molecular Devices), and then recorded in Clampex 10.3 (Molecular Devices). Stimuli are presented through an MF1 free-field speaker, triggered by an RZ6 with a 40-dB gain, and controlled via RPvdsEx software (Tucker-Davis Technologies). Stimulus presentation and sweep recording are coordinated through the Digidata 1440A starter input. B: setup of stimulus presentation and corresponding putative ABR waveform.
Fig. 3.
Fig. 3.
Conductive hearing loss. A: ABR threshold comparison in an example animal. The black line represents the thresholds for each stimulus frequency in the normal hearing animal; the blue line is for the same animal after malleus removal. B: ABR threshold comparison across all animals, shown as means ± SE. C: summary of ABR click thresholds before and after malleus removal [ABR click threshold before: 35 ± 2 dB SPL; ABR click threshold after: nonresponsive (NR)]. D: behavioral target recognition comparison in an example animal. Black is normal hearing baseline; blue is the same animal after malleus removal. E: behavioral target recognition across all animals, shown as means ± SE. F: summary of behavioral d′ before and after malleus removal (d′ before: 1.6 ± 0.2; d′ after: 1.5 ± 0.4, P = 0.60, Student's paired two-tailed t-test). G: behavioral target detection comparison in an example animal. Black is normal hearing; blue is after malleus removal. H: behavioral target detection across all animals, shown as means ± SE. I: summary of behavioral hearing threshold before and after malleus removal (behavioral hearing threshold before: 33 ± 5 dB SPL; behavioral hearing threshold after: 47 ± 6 dB SPL, P < 0.05, Student's paired two-tailed t-test).
Fig. 4.
Fig. 4.
Cochlear implant procedure in rats. A: array dimensions for the 2- or 4-channel, full-banded array. In the 2-channel setup, the most apical and the second electrodes are active, and there are 2 structural electrodes present: the third and the most basal electrode; all 4 electrodes are evenly spaced within a tapered tip, 2.0 mm in length. The center-to-center spacing is 1.2 mm for the 2-channel arrays and 0.77 mm for the 8-channel arrays (close to the 0.75-mm spacing in human electrodes). Array dimensions are listed in millimeters. B: array dimensions for the 8-channel, half-banded array. C: dorsal approach to cochleostomy (CO). Left: head of the animal is tilted away and the ear pulled forward to identify the external ear canal over which the postauricular incision is made (red arrow). Middle: subsequent to fascia and soft-tissue dissection, the following landmarks are identified: ear canal (EC), facial nerve (CN7), submandibular gland (SMG), tympanic bulla (TB), posterior belly of the digastric muscle (PBD), trapezius (TR), and sternocleidomastoid muscle (SCM). The drill site (X) is identified at the root of the facial nerve in the TB. Right: the view through the opened TB reveals the stapedial artery (SA) overlying the round window (RW), the usual site of array insertion. The CO site is identified below the SA within the basal turn of the cochlea, the cochlear promontory (CP).
Fig. 5.
Fig. 5.
Anatomical verification of implantation procedure. A: ventral view (top) and orthogonal view (bottom) of the 2-channel array. Open arrowheads indicate structural rings. B: ventral view (top) and orthogonal view (bottom) of the 8-channel array. Original scale bars, 1 mm.
Fig. 6.
Fig. 6.
Cochlear histology. A–D: views (4× and 10×) of hematoxylin and eosin-stained cochleae of animals with normal hearing (A), conductive hearing loss (B), sensorineural hearing loss without cochlear implant stimulation (C), and sensorineural hearing loss with unilateral cochlear implant (CI) stimulation (D). Asterisk (*) in C, SA. All original scale bars, 100 μm. E: quantification of spiral ganglion neuron (SGN) cell density in all 4 conditions. *P < 0.05; **P < 0.01.
Fig. 7.
Fig. 7.
Physiological calibration of cochlear implant stimulation. A: evoked compound action potentials (ECAPs) with increasing stimulation current. Asterisk (*) indicates threshold. Characteristic first negative (N1) and positive (P1) peaks are labeled. B: evoked auditory brain stem responses (EABRs) with increasing stimulation current in the same animal with the same electrode. Asterisk (*) indicates threshold. Third (III) and fourth (IV) peaks are labeled; stimulation artifact obscures the first 2. C: plot of N1–P1 amplitude as a function of stimulation intensity for the example shown in A. D: plot of wave III amplitude as a function of stimulation intensity for the example shown in B. E: correlation of ECAP and EABR thresholds across animals (n = 6) and across both electrodes (all with 2-channel arrays). The example in A and B is labeled with the filled black circle. F: change (Δ) in ECAP threshold over time. Left: ECAP threshold for the target electrode in separate animals; right: ECAP threshold for the single foil electrode (for the 2-channel arrays, n = 4; open circles) and for an average of the foil electrodes (for the 8-channel arrays, n = 3; solid circles). The Xs mark the last implanted day for each animal, although no ECAP measurement was acquired. Dotted lines from last circle to X only indicate animal identity.
Fig. 8.
Fig. 8.
Cochlear implant stimulation evokes cortical responses. A: evoked multiunit responses as a function of stimulation current through a single electrode at 2 separate cortical locations in 1 animal. ECAP threshold and cortical threshold are indicated with dotted lines. Example-evoked multiunit response is shown in the inset; asterisk (*), stimulus artifact. Original scale bar, 0.5 mV (x-axis); 20 ms (y-axis). B: summary of cortical thresholds for each animal (n = 4). The normalized cortical threshold is taken as the difference (in microamperes) between the absolute cortical and ECAP thresholds, divided by the ECAP threshold.
Fig. 9.
Fig. 9.
Behavioral validation of cochlear implant use after training. A: automated stimulation setup for behavioral training. B: target recognition is abolished after deafening (hearing d′: 2.68 ± 0.12; deaf d′: 0.01 ± 0.04, P < 0.001, Student's paired two-tailed t-test). Open circles, animals trained on 4 kHz target tone; solid circles, animals trained on 22.6 kHz target tone. C: target recognition is restored when the cochlear implant (CI) is on (CI on d′: 1.70 ± 0.25; CI off d′: 0.04 ± 0.03, P < 0.001, Student's paired two-tailed t-test). D: trial self-initiation rates are similar between sessions when the CI is on or off (CI on: 4.21 ± 0.35; CI off: 3.93 ± 0.29, P = 0.47, Student's paired two-tailed t-test). E: improvement in d′ as a function of experience in weeks after nosepoke training is complete. Solid circles, animals (n = 3) with the 8-channel arrays; open circles (n = 4) had 2-channel arrays.

References

    1. NIDCD Fact Sheet, Cochlear Implants. NIH Publication No. 11-4798 U.S. Department of Health and Human Services, National Institutes of Health, National Institute on Deafness and Other Communication Disorders, NIDCD Information Clearinghouse, Bethesda, MD, 2011.
    1. Agterberg MJ, Versnel H. Behavioral responses of deafened guinea pigs to intracochlear electrical stimulation: a new rapid psychophysical procedure. Hear Res 313: 67–74, 2014. - PubMed
    1. Agterberg MJ, Versnel H, de Groot JC, van den Broek M, Klis SF. Chronic electrical stimulation does not prevent spiral ganglion cell degeneration in deafened guinea pigs. Hear Res 269: 169–179, 2010. - PubMed
    1. Azadpour M, McKay CM. A psychophysical method for measuring spatial resolution in cochlear implants. J Assoc Res Otolaryngol 13: 145–157, 2012. - PMC - PubMed
    1. Beitel RE, Vollmer M, Snyder RL, Schreiner CE, Leake PA. Behavioral and neurophysiological thresholds for electrical cochlear stimulation in the deaf cat. Audiol Neurootol 5: 31–38, 2000. - PubMed

Publication types

LinkOut - more resources