Comparative Study
. 2016 Jun 10:6:27755.
doi: 10.1038/srep27755.

Comparison of deep neural networks to spatio-temporal cortical dynamics of human visual object recognition reveals hierarchical correspondence

Affiliations
Comparative Study

Comparison of deep neural networks to spatio-temporal cortical dynamics of human visual object recognition reveals hierarchical correspondence

Radoslaw Martin Cichy et al. Sci Rep. .

Abstract

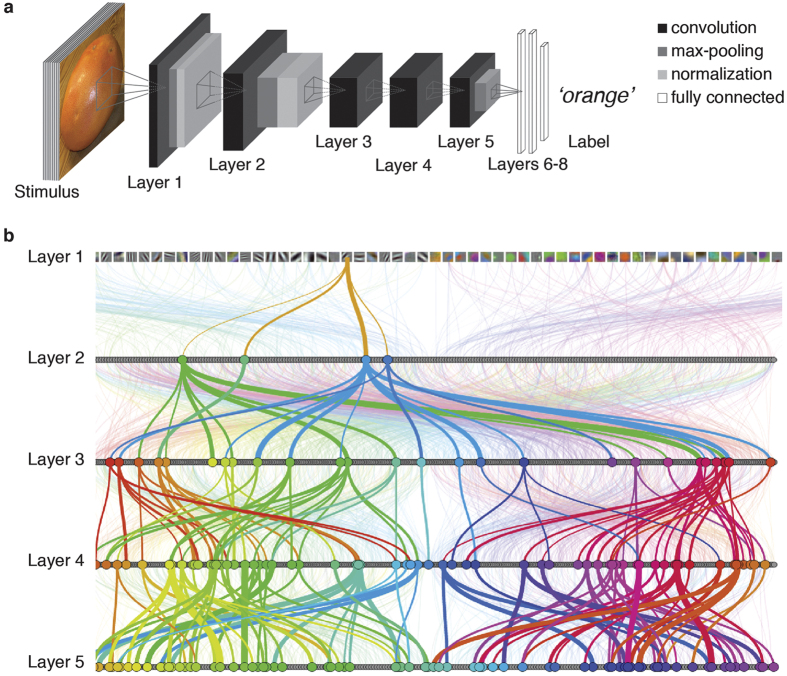
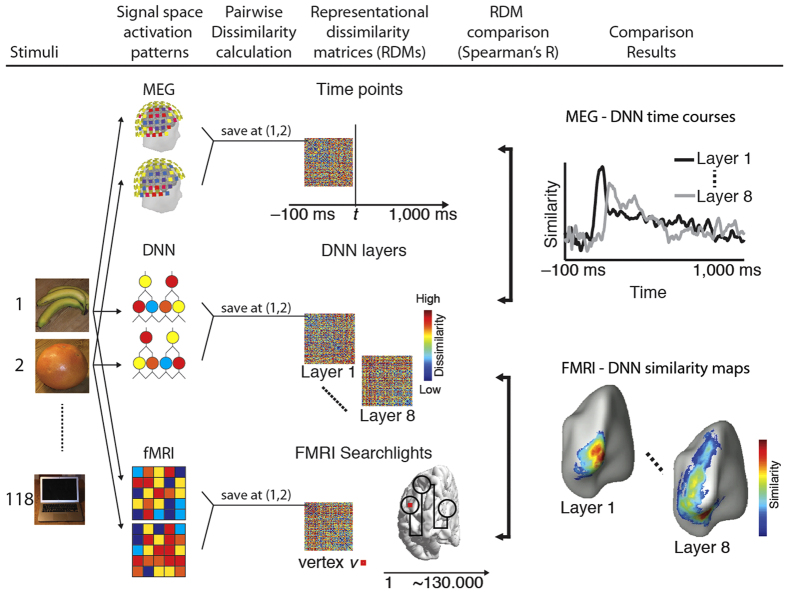
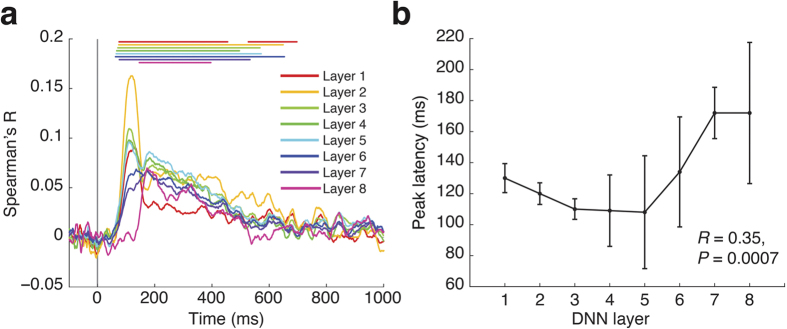
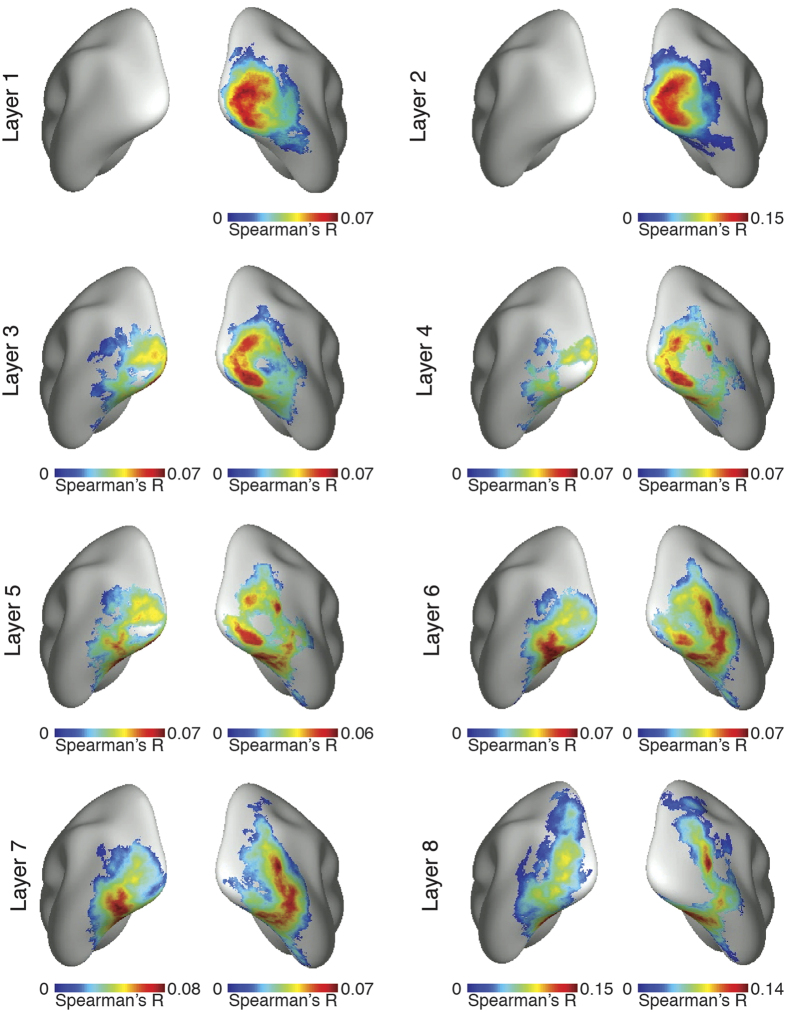
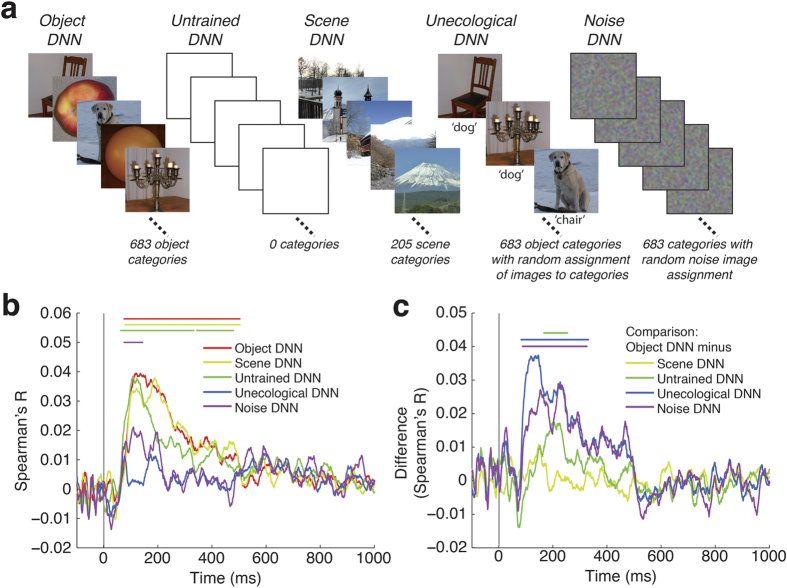
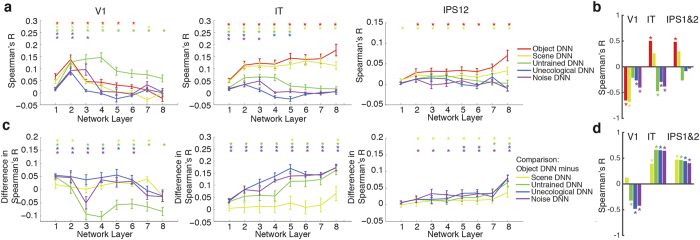
The complex multi-stage architecture of cortical visual pathways provides the neural basis for efficient visual object recognition in humans. However, the stage-wise computations therein remain poorly understood. Here, we compared temporal (magnetoencephalography) and spatial (functional MRI) visual brain representations with representations in an artificial deep neural network (DNN) tuned to the statistics of real-world visual recognition. We showed that the DNN captured the stages of human visual processing in both time and space from early visual areas towards the dorsal and ventral streams. Further investigation of crucial DNN parameters revealed that while model architecture was important, training on real-world categorization was necessary to enforce spatio-temporal hierarchical relationships with the brain. Together our results provide an algorithmically informed view on the spatio-temporal dynamics of visual object recognition in the human visual brain.


Figures

Figure 1
Figure 1. Deep neural network architecture and properties.
(a) The DNN architecture comprised 8 layers. Each of layers 1–5 contained a combination of convolution, max-pooling and normalization stages, whereas the last three layers were fully connected. The DNN takes pixel values as inputs and propagates information feed-forward through the layers, activating model neurons with particular activation values successively at each layer. (b) Visualization of example DNN connections. The thickness of highlighted lines (colored to ease visualization) indicates the weight of the strongest connections going in and out of neurons, starting from a sample neuron in layer 1. Neurons in layer 1 are represented by their filters, and in layers 2–5 by gray dots. For combined visualization of connections between neurons and neuron RF selectivity please visit http://brainmodels.csail.mit.edu/dnn/drawCNN/.
Figure 2
Figure 2. Comparison of MEG, fMRI and DNN representations by representational similarity.
In each signal space (fMRI, MEG, DNN) we summarized representational structure by calculating the dissimilarity between activation patterns of different pairs of conditions (here exemplified for two objects: bus and orange). This yielded representational dissimilarity matrices (RDMs) indexed in rows and columns by the compared conditions. We calculated millisecond resolved MEG RDMs from −100 ms to +1,000 ms with respect to image onset, layer-specific DNN RDMs (layers 1 through 8) and voxel-specific fMRI RDMs in a spatially unbiased cortical surface-based searchlight procedure. RDMs were directly comparable (Spearman’s R), facilitating integration across signal spaces. Comparison of DNN with MEG RDMs yielded time courses of similarity between emerging visual representations in the brain and DNN. Comparison of the DNN with fMRI RDMs yielded spatial maps of visual representations common to the human brain and the DNN. Object images shown as exemplars are not examples of the original stimulus set due to copyright; the complete stimulus set is visualized at http://brainmodels.csail.mit.edu/images/stimulus_set.png.
Figure 3
Figure 3. Representations in the object DNN correlated with emerging visual representations in the human brain in an ordered fashion.
(a) Time courses with which representational similarity in the brain and layers of the deep object network emerged. Color-coded lines above data curves indicate significant time points (n = 15, cluster definition threshold P = 0.05, cluster threshold P = 0.05 Bonferroni-corrected for 8 layers; for onset and peak latencies see Suppl. Table 2). Gray vertical line indicates image onset. (b) Overall peak latency of time courses increased with layer number (n = 15, R = 0.35, P = 0.0007, sign permutation test). Error bars indicate standard error of the mean determined by 10,000 bootstrap samples of the participant pool.
Figure 4
Figure 4
Spatial maps of visual representations common to brain and object DNN. There was a correspondence between object DNN hierarchy and the hierarchical topography of visual representations in the human brain. Low layers had significant representational similarities confined to the occipital lobe of the brain, i.e. low- and mid-level visual regions. Higher layers had significant representational similarities with more anterior regions in the temporal and parietal lobe, with layers 7 and 8 reaching far into the inferior temporal cortex and inferior parietal cortex (n = 15, cluster definition threshold P < 0.05, cluster-threshold P < 0.05 Bonferroni-corrected for multiple comparisons by 16 (8 DNN layers * 2 hemispheres).
Figure 5
Figure 5. Architecture, task, and training procedure influence the correlation between representations in DNNs and temporally emerging brain representations.
(a) We created 5 different models: 1) a model trained on object categorization (object DNN; Fig. 1); 2) an untrained model initialized with random weights (untrained DNN) to determine the effect of architecture alone; 3) a model trained on a different real-world task, scene categorization (scene DNN) to investigate the effect of task; and 4,5) a model trained on object categorization with random assignment of image labels (unecological DNN), or spatially smoothed noisy images with random assignment of image labels (noise DNN), to determine the effect of the training operation independent of task constraints. (b) All DNNs had significant representational similarities to human brains (layer-specific analysis in Suppl. Fig. 4). (c) We contrasted the object DNN against all other models (subtraction of corresponding time series shown in (b). Representations in the object DNN were more similar to brain representations than any other model except the scene DNN. Lines above data curves significant time points (n = 15, cluster definition threshold P = 0.05, cluster threshold P = 0.05 Bonferroni corrected by 5 (number of models) in (b), and 4 (number of comparisons in (c)); for onset and peak latencies see Suppl. Table 3a,b). Gray vertical lines indicates image onset.
Figure 6
Figure 6. Architecture, task constraints, and training procedure influence the topographically ordered correlation in representations between DNNs and human brain.
(a) Comparison of fMRI representations in V1, IT and IPS1&2 with the layer-specific DNN representations of each model. Error bars indicate standard error of the mean as determined by bootstrapping (n = 15). (b) Correlations between layer number and brain-DNN representational similarities for the different models shown in (a). Non-zero correlations indicate hierarchical relationships; positive correlations indicate an increase in brain-DNN similarities towards higher layers, and vice versa for negative correlations. Bars color-coded as DNNs, stars above bars indicate significance (sign-permutation tests, P < 0.05, FDR-corrected, for details see Suppl. Table 4a). (c) Comparison of object DNN against all other models (subtraction of corresponding points shown in a). (d) Same as (b), but for the curves shown in (c) (for details see Suppl. Table 4b).

References

    1. Ungerleider L. G. & Mishkin M. In Analysis of Visual Behavior 549–586 (MIT Press, 1982).
    1. Felleman D. J. & Van Essen D. C. Distributed Hierarchical Processing in the Primate Cerebral Cortex. Cereb. Cortex 1, 1–47 (1991). - PubMed
    1. Bullier J. Integrated model of visual processing. Brain Res. Rev. 36, 96–107 (2001). - PubMed
    1. Milner A. D. & Goodale M. A. The visual brain in action. (Oxford University Press, 2006).
    1. Kourtzi Z. & Connor C. E. Neural Representations for Object Perception: Structure, Category, and Adaptive Coding. Annu. Rev. Neurosci 34, 45–67 (2011). - PubMed

Publication types