Editorial
. 2016 Jun 9;5(1):61.
doi: 10.1186/s40249-016-0151-8.

Malaria: Global progress 2000 - 2015 and future challenges

Affiliations
Editorial

Malaria: Global progress 2000 - 2015 and future challenges

Richard E Cibulskis et al. Infect Dis Poverty. .

Abstract

Background: 2015 was the target year for malaria goals set by the World Health Assembly and other international institutions to reduce malaria incidence and mortality. A review of progress indicates that malaria programme financing and coverage have been transformed since the beginning of the millennium, and have contributed to substantial reductions in the burden of disease.

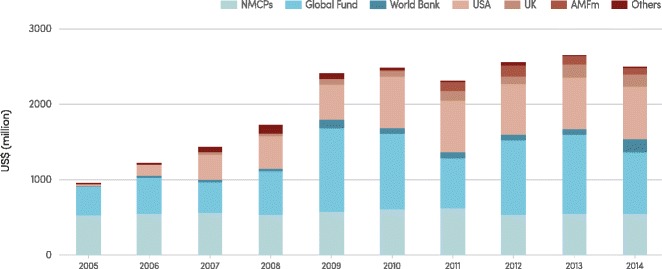
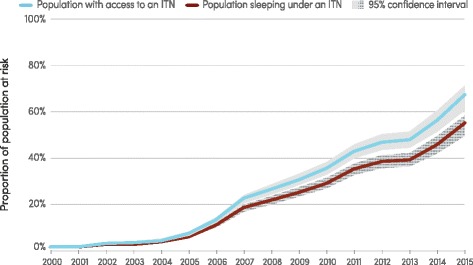
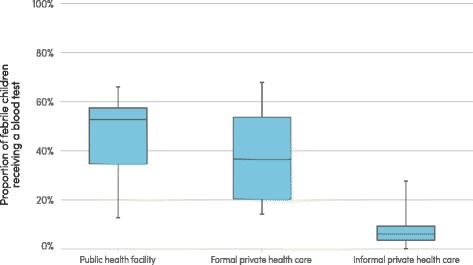
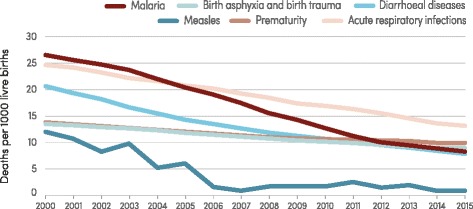
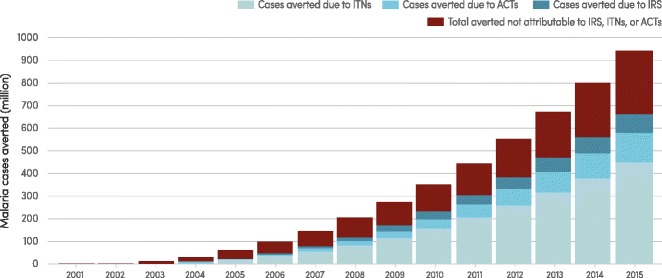
Findings: Investments in malaria programmes increased by more than 2.5 times between 2005 and 2014 from US$ 960 million to US$ 2.5 billion, allowing an expansion in malaria prevention, diagnostic testing and treatment programmes. In 2015 more than half of the population of sub-Saharan Africa slept under insecticide-treated mosquito nets, compared to just 2 % in 2000. Increased availability of rapid diagnostic tests and antimalarial medicines has allowed many more people to access timely and appropriate treatment. Malaria incidence rates have decreased by 37 % globally and mortality rates by 60 % since 2000. It is estimated that 70 % of the reductions in numbers of cases in sub-Saharan Africa can be attributed to malaria interventions.

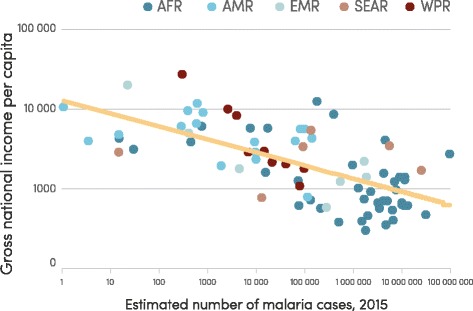
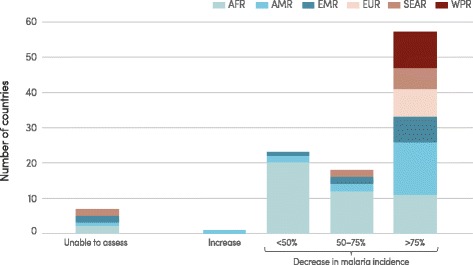
Conclusions: Reductions in malaria incidence and mortality rates have been made in every WHO region and almost every country. However, decreases in malaria case incidence and mortality rates were slowest in countries that had the largest numbers of malaria cases and deaths in 2000; reductions in incidence need to be greatly accelerated in these countries to achieve future malaria targets. Progress is made challenging because malaria is concentrated in countries and areas with the least resourced health systems and the least ability to pay for system improvements. Malaria interventions are nevertheless highly cost-effective and have not only led to significant reductions in the incidence of the disease but are estimated to have saved about US$ 900 million in malaria case management costs to public providers in sub-Saharan Africa between 2000 and 2014. Investments in malaria programmes can not only reduce malaria morbidity and mortality, thereby contributing to the health targets of the Sustainable Development Goals, but they can also transform the well-being and livelihood of some of the poorest communities across the globe.

Keywords: Burden of disease; Elimination; MDG; Malaria; Monitoring and evaluation; Poverty; SDG; Surveillance; Universal health coverage.


Figures

Fig. 1
Fig. 1
Gross national income per capita versus estimated number of malaria cases, by WHO region, 2015. AFR, African Region; AMR, Region of the Americas; EMR, Eastern Mediterranean Region; SEAR, South-East Asia Region; WPR, Western Pacific Region. Source: WHO estimates and the World Bank Data Bank
Fig. 2
Fig. 2
Investments in malaria control activities by funding source, 2005–2014. AMFm, Affordable Medicine Facility-malaria; Global Fund, Global Fund to Fight AIDS, Tuberculosis and Malaria; NMCP, national malaria control programme; UK, United Kingdom; USA, United States of America Annual values have been converted to constant 2014 US$ using the gross domestic product (GDP) implicit price deflator from the USA in order to measure funding trends in real terms. Source: ForeignAssistance.gov, Global Fund, NMCPs, Organisation for Economic Co-operation and Development (OECD) creditor reporting system (CRS), the World Bank Data Bank
Fig. 3
Fig. 3
Proportion of population at risk with access to an ITN and proportion sleeping under an ITN, sub-Saharan Africa, 2000–2015. ITN, insecticide-treated mosquito net. Source: Insecticide-treated mosquito net coverage model from Malaria Atlas Project (3), with further analysis by WHO
Fig. 4
Fig. 4
Proportion of febrile children receiving a blood test, by health sector, sub-Saharan Africa, 2013–2015. Source: Nationally-representative household survey data from demographic and health surveys and malaria indicator surveys
Fig. 5
Fig. 5
Proportion of febrile children receiving antimalarial treatments, by type, sub-Saharan Africa, 2013–2015. ACT, artemisinin-based combination therapy; AQ, amodiaquine; CQ, chloroquine; Mono, monotherapy; SP, sulfadoxine-pyrimethamine; QN, quinine. Only shows results for a subset of countries which have had household surveys in the stated years Source: Nationally-representative household survey data from demographic and health surveys and malaria indicator surveys
Fig. 6
Fig. 6
Estimated change in malaria case incidence 2000–2015, by WHO region. AFR, African Region; AMR, Region of the Americas; EMR, Eastern Mediterranean Region; EUR, European Region; SEAR, South-East Asia Region; WPR, Western Pacific Region. Source: WHO estimates
Fig. 7
Fig. 7
Leading causes of death among children aged under 5 years in sub-Saharan Africa, 2000–2015. Conditions that are responsible for more than 10 deaths per 1000 live births during any time between 2000 and 2015 are shown. Source: WHO estimates
Fig. 8
Fig. 8
Predicted cumulative number of malaria cases averted by interventions, sub-Saharan Africa, 2000–2015. ACT, artemisinin-based combination therapy; IRS, indoor residual spraying; ITN, insecticide-treated mosquito net. Source: Malaria Atlas Project [3] estimates of cases averted attributable to ITNs, ACTs, and IRS and WHO estimates of total cases averted
Fig. 9
Fig. 9
Number of countries with fewer than 1000, 100 and 10 cases, 2000–2015. Source: WHO estimates

References

    1. World Health Organization. World malaria report 2015. Geneva: World Health Organization; 2015.
    1. World Health Organization. Global technical strategy for malaria 2016–2030. Geneva: World Health Organization; 2015.
    1. Bhatt S, et al. The effect of malaria control on Plasmodium falciparum in Africa between 2000 and 2015. Nature. 2015;526(7572):207-11. - PMC - PubMed

Publication types

MeSH terms