

Effects of signaled and unsignaled alternative reinforcement on persistence and relapse in children and pigeons
- PMID: 27282331
- PMCID: PMC4958596
- DOI: 10.1002/jeab.213
Effects of signaled and unsignaled alternative reinforcement on persistence and relapse in children and pigeons
Abstract
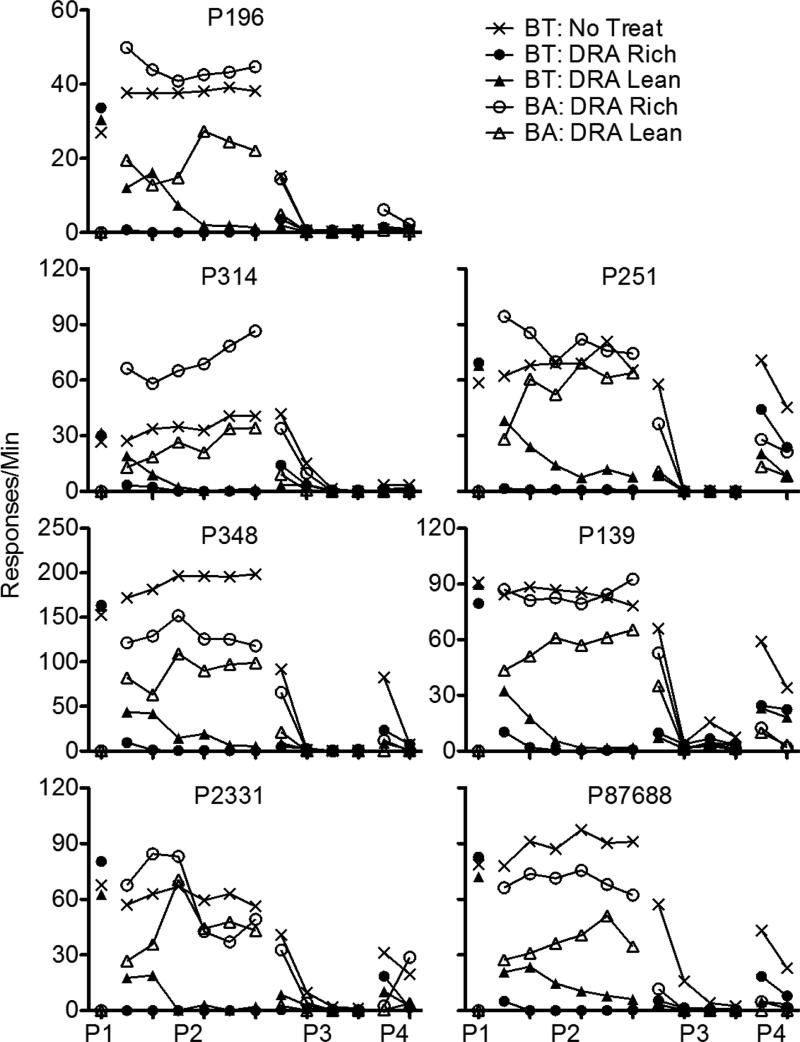
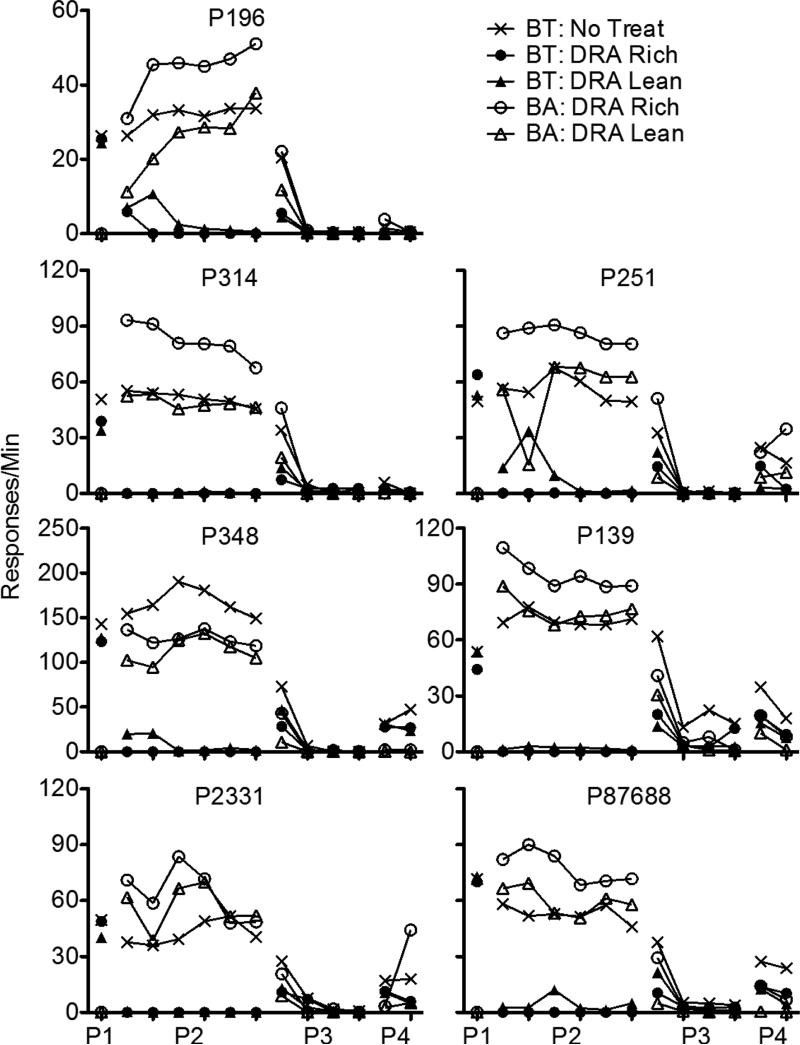
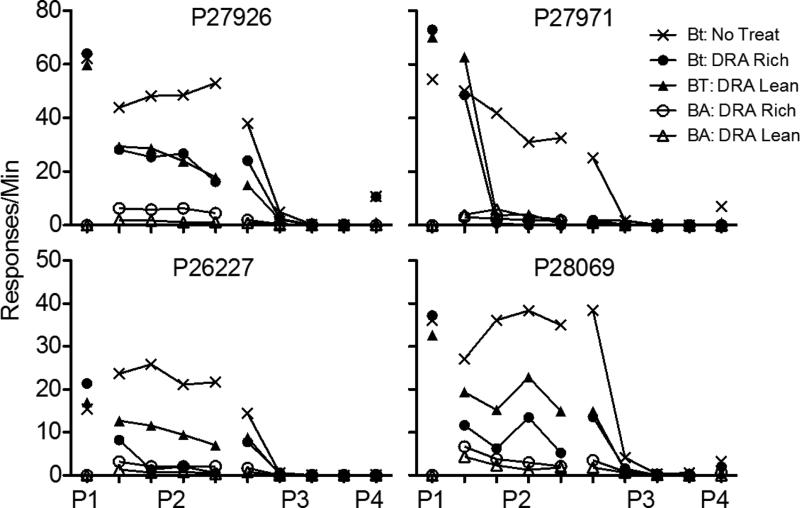
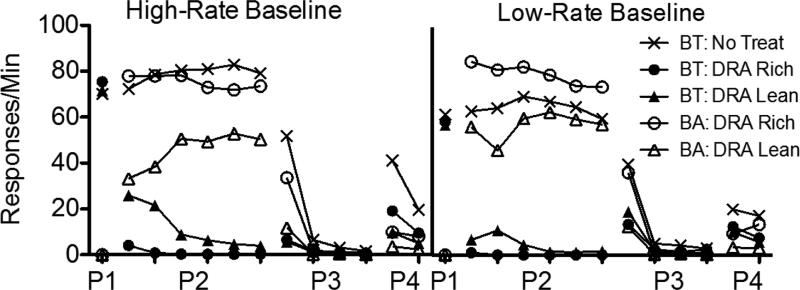
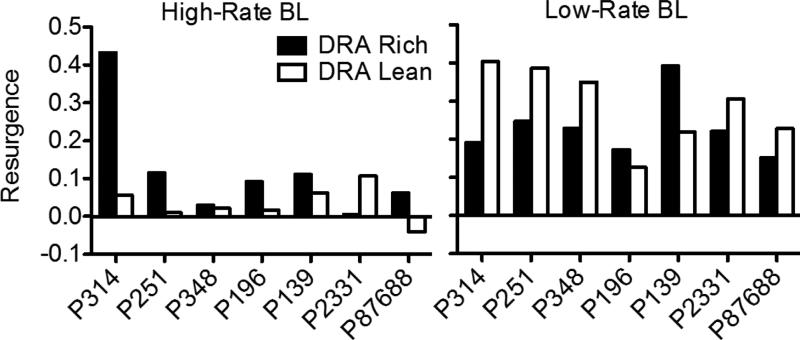
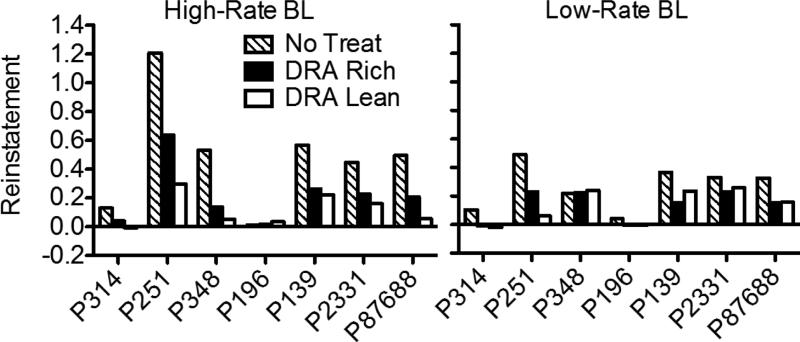
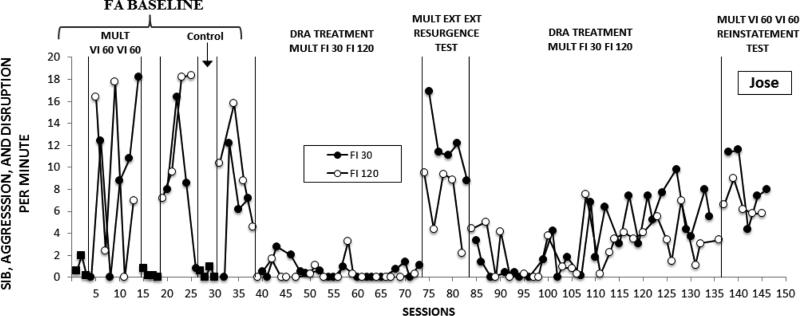
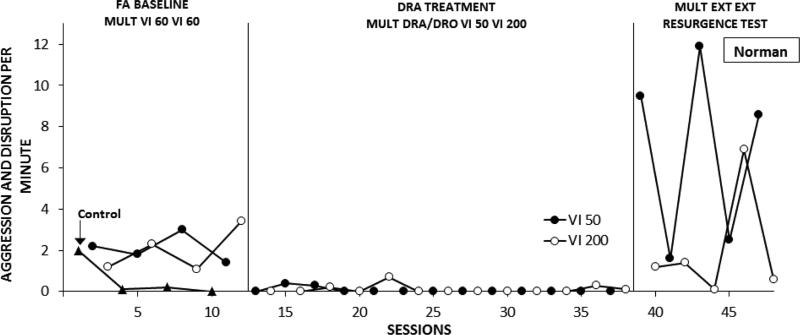
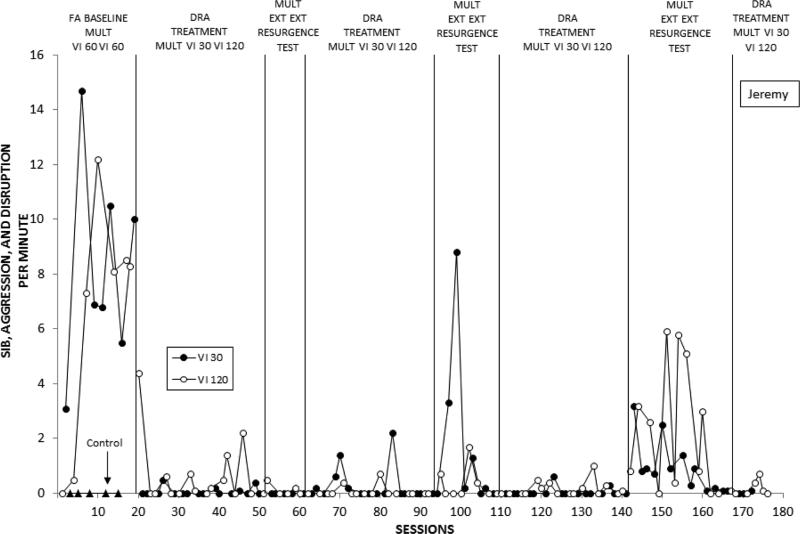
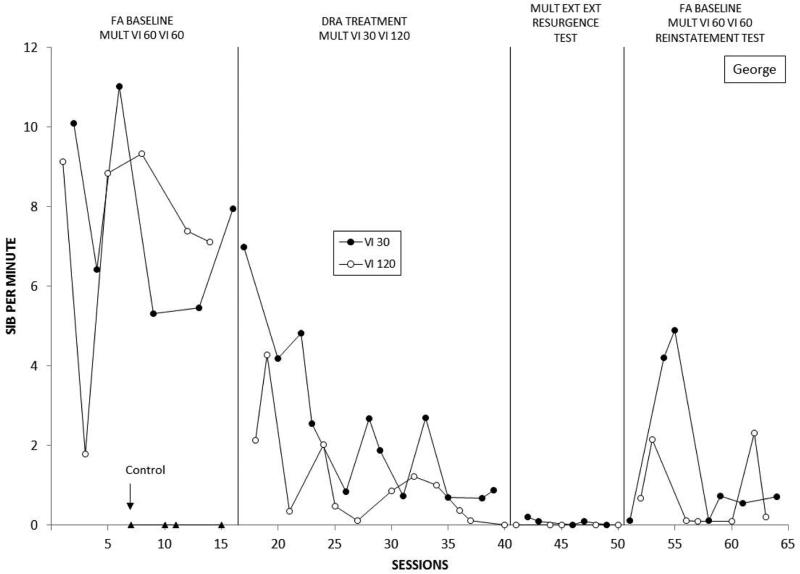
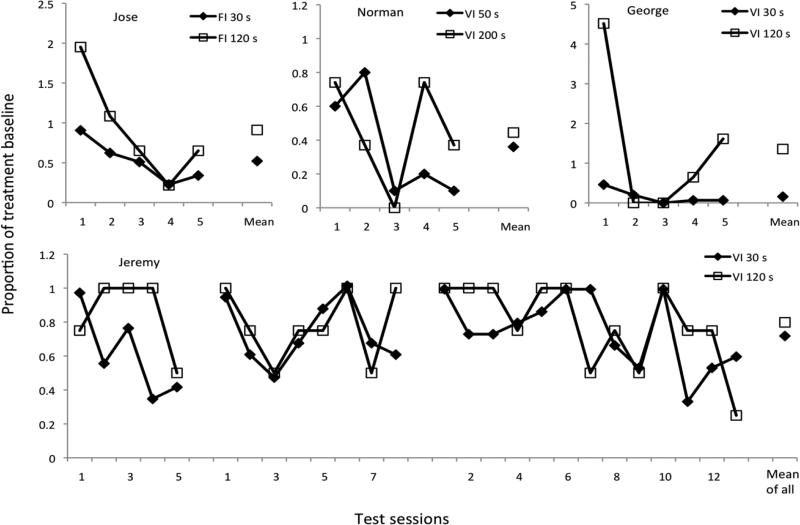
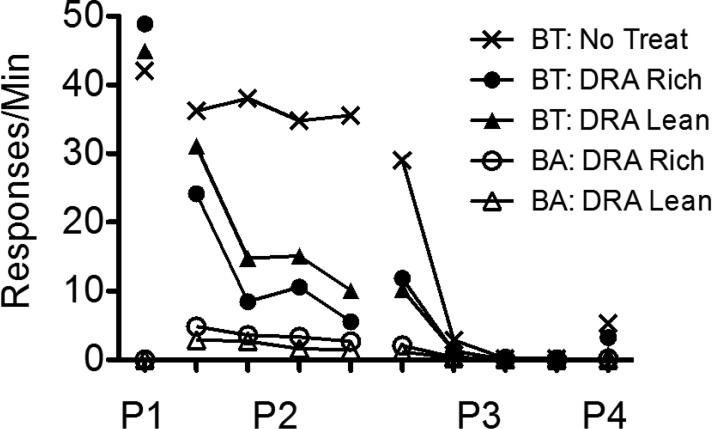
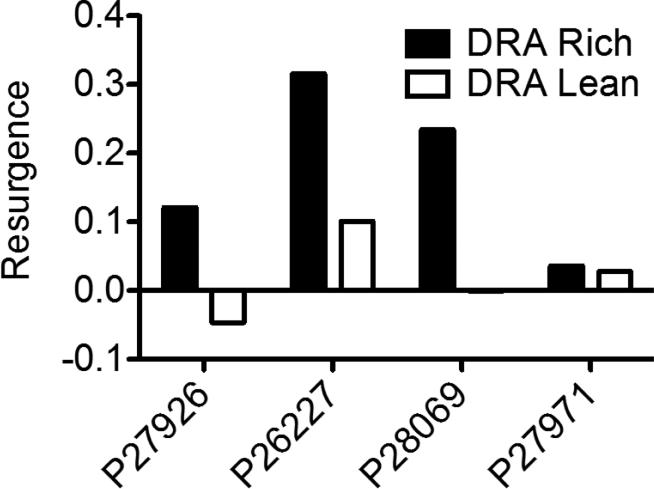
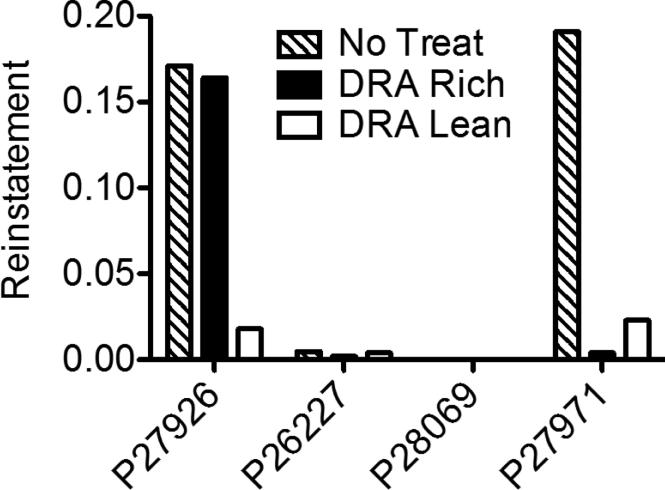
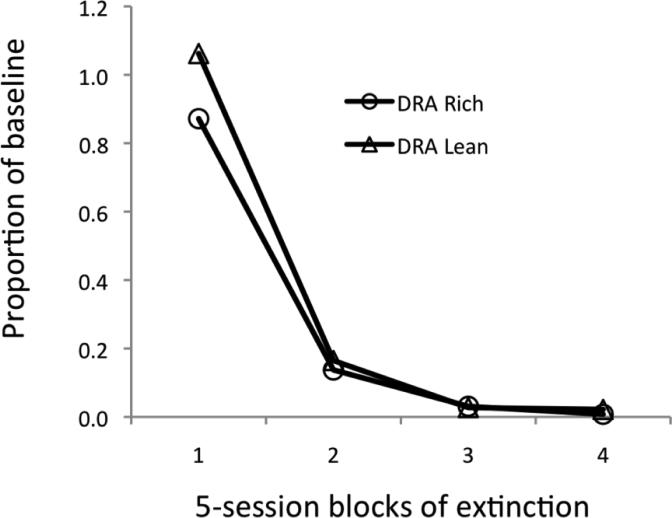
Three experiments explored the impact of different reinforcer rates for alternative behavior (DRA) on the suppression and post-DRA relapse of target behavior, and the persistence of alternative behavior. All experiments arranged baseline, intervention with extinction of target behavior concurrently with DRA, and post-treatment tests of resurgence or reinstatement, in two- or three-component multiple schedules. Experiment 1, with pigeons, arranged high or low baseline reinforcer rates; both rich and lean DRA schedules reduced target behavior to low levels. When DRA was discontinued, the magnitude of relapse depended on both baseline reinforcer rate and the rate of DRA. Experiment 2, with children exhibiting problem behaviors, arranged an intermediate baseline reinforcer rate and rich or lean signaled DRA. During treatment, both rich and lean DRA rapidly reduced problem behavior to low levels, but post-treatment relapse was generally greater in the DRA-rich than the DRA-lean component. Experiment 3, with pigeons, repeated the low-baseline condition of Experiment 1 with signaled DRA as in Experiment 2. Target behavior decreased to intermediate levels in both DRA-rich and DRA-lean components. Relapse, when it occurred, was directly related to DRA reinforcer rate as in Experiment 2. The post-treatment persistence of alternative behavior was greater in the DRA-rich component in Experiment 1, whereas it was the same or greater in the signaled-DRA-lean component in Experiments 2 and 3. Thus, infrequent signaled DRA may be optimal for effective clinical treatment.
Keywords: alternative reinforcement; children; persistence; pigeons; relapse; signaled DRA.
© 2016 Society for the Experimental Analysis of Behavior.
Figures
Similar articles
-
Signaled alternative reinforcement and the persistence of operant behavior.J Exp Anal Behav. 2016 Jul;106(1):22-33. doi: 10.1002/jeab.212. Epub 2016 Jun 10. J Exp Anal Behav. 2016. PMID: 27282131
-
Delivering alternative reinforcement in a distinct context reduces its counter-therapeutic effects on relapse.J Exp Anal Behav. 2018 May;109(3):492-505. doi: 10.1002/jeab.431. Epub 2018 Apr 23. J Exp Anal Behav. 2018. PMID: 29683191
-
Stimulus-reinforcer relations established during training determine resistance to extinction and relapse via reinstatement.J Exp Anal Behav. 2016 Nov;106(3):225-241. doi: 10.1002/jeab.227. J Exp Anal Behav. 2016. PMID: 27870107
-
Preventing relapse after incentivized choice treatment: A laboratory model.Behav Processes. 2017 Aug;141(Pt 1):11-18. doi: 10.1016/j.beproc.2017.02.005. Epub 2017 Feb 7. Behav Processes. 2017. PMID: 28188809 Free PMC article. Review.
-
Quantitative models of persistence and relapse from the perspective of behavioral momentum theory: Fits and misfits.Behav Processes. 2017 Aug;141(Pt 1):92-99. doi: 10.1016/j.beproc.2017.04.016. Epub 2017 Apr 29. Behav Processes. 2017. PMID: 28465027 Free PMC article. Review.
Cited by
-
Resurgence of a target behavior suppressed by a combination of punishment and alternative reinforcement.Behav Processes. 2019 May;162:177-183. doi: 10.1016/j.beproc.2019.03.004. Epub 2019 Mar 9. Behav Processes. 2019. PMID: 30862521 Free PMC article.
-
Resurgence as Choice: Implications for promoting durable behavior change.J Appl Behav Anal. 2019 Jul;52(3):816-846. doi: 10.1002/jaba.573. Epub 2019 May 3. J Appl Behav Anal. 2019. PMID: 31049954 Free PMC article. Review.
-
Basing assessment and treatment of problem behavior on behavioral momentum theory: Analyses of behavioral persistence.Behav Processes. 2017 Aug;141(Pt 1):75-84. doi: 10.1016/j.beproc.2017.02.013. Epub 2017 Feb 17. Behav Processes. 2017. PMID: 28219729 Free PMC article. Review.
-
Resurgence Following Higher or Lower Quality Alternative Reinforcement.J Exp Anal Behav. 2024 Mar;121(2):246-258. doi: 10.1002/jeab.904. Epub 2024 Feb 8. J Exp Anal Behav. 2024. PMID: 38329150 Free PMC article.
-
Baseline reinforcement rate and resurgence of destructive behavior.J Exp Anal Behav. 2019 Jan;111(1):75-93. doi: 10.1002/jeab.488. Epub 2018 Nov 29. J Exp Anal Behav. 2019. PMID: 30499107 Free PMC article.
References
-
- Betz AM, Fisher WW, Roane HS, Mintz JC, Owen TM. A component analysis of schedule thinning during functional communication training. Journal of Applied Behavior Analysis. 2013;46:219–241. doi:10.1002/jaba.23. - PubMed
-
- Bouton ME, Winterbauer NE, Todd TP. Relapse processes after the extinction of instrumental learning: Renewal, resurgence, and reacquisition. Behavioural Processes. 2012;90(1):130–141. http://doi.org/10.1016/j.beproc.2012.03.004. - DOI - PMC - PubMed
-
- Derby KM, Wacker DP, Sasso G, Steege M, Northup J, Cigrand K, Asmus J. Brief functional assessment techniques to evaluate aberrant behavior in an outpatient setting: A summary of 79 cases. Journal of Applied Behavior Analysis. 1992;25(3):713–721. http://doi.org/10.1901/jaba.1992.25-713. - DOI - PMC - PubMed
-
- Gibbon J, Balsam P. Spreading association in time. In: Locurto CM, Terrace HS, Gibbon J, editors. Autoshaping and conditioning theory. Academic Press; New York: 1981. pp. 219–253.
MeSH terms
Grants and funding
LinkOut - more resources
Full Text Sources
Other Literature Sources
