. 2016 Jun 10:5:e14981.
doi: 10.7554/eLife.14981.

Architecture and RNA binding of the human negative elongation factor

Affiliations

Architecture and RNA binding of the human negative elongation factor

Seychelle M Vos et al. Elife. .

Abstract

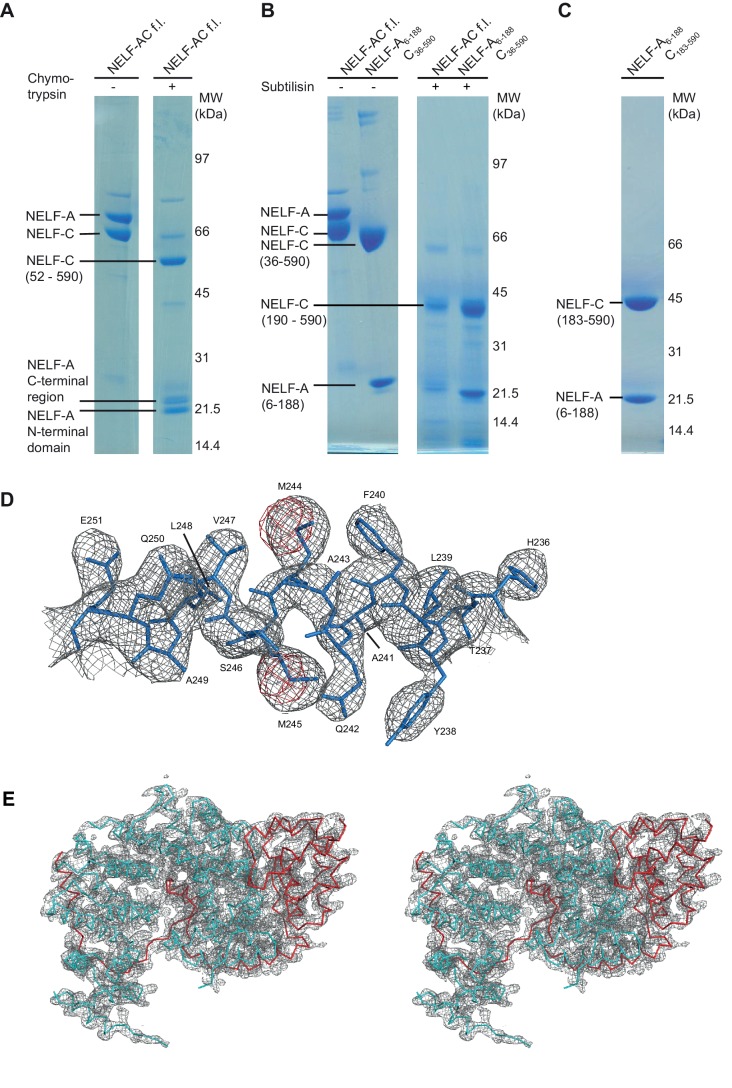
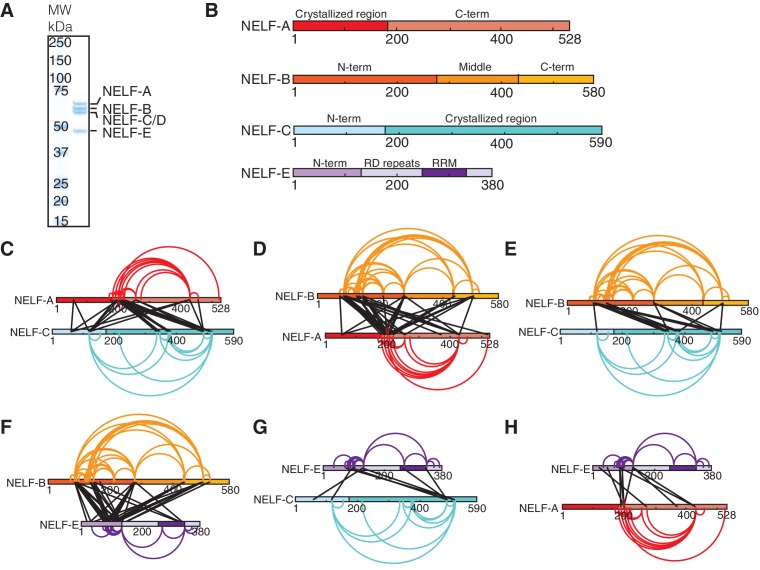
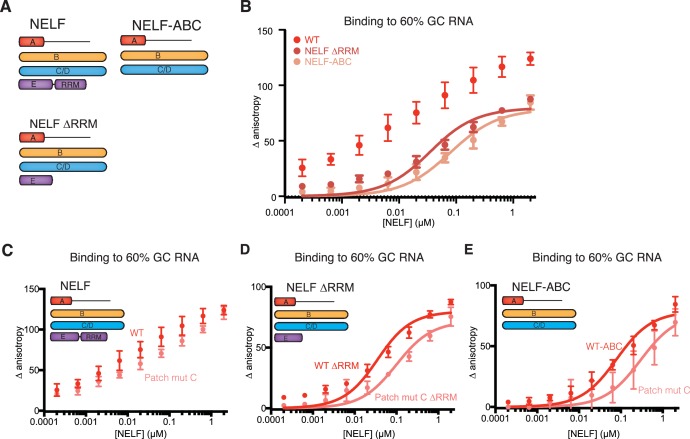
Transcription regulation in metazoans often involves promoter-proximal pausing of RNA polymerase (Pol) II, which requires the 4-subunit negative elongation factor (NELF). Here we discern the functional architecture of human NELF through X-ray crystallography, protein crosslinking, biochemical assays, and RNA crosslinking in cells. We identify a NELF core subcomplex formed by conserved regions in subunits NELF-A and NELF-C, and resolve its crystal structure. The NELF-AC subcomplex binds single-stranded nucleic acids in vitro, and NELF-C associates with RNA in vivo. A positively charged face of NELF-AC is involved in RNA binding, whereas the opposite face of the NELF-AC subcomplex binds NELF-B. NELF-B is predicted to form a HEAT repeat fold, also binds RNA in vivo, and anchors the subunit NELF-E, which is confirmed to bind RNA in vivo. These results reveal the three-dimensional architecture and three RNA-binding faces of NELF.

Keywords: RNA polymerase II; biochemistry; biophysics; gene regulation; gene transcription; human; promoter-proximal pausing; structural biology.


Conflict of interest statement

The authors declare that no competing interests exist.

Figures

Figure 1.
Figure 1.. Primary structure and conservation of human NELF-A and NELF-C.
(A) Crystallized variant and previously identified functional regions in human NELF-A and NELF-C. Cleavage sites of chymotrypsin and subtilisin are indicated by black and green scissors, respectively. ‘NELF-C’ delineates the previously identified NELF-C-binding region in NELF-A (Narita et al., 2003), whereas ‘Pol II’ marks the region in NELF-A that associates with Pol II (Narita et al., 2003). Boxed regions indicate crystallization constructs. (B) Alignment of NELF-A and NELF-C regions present in the structure from Homo sapiens (H.s.), Drosophila melanogaster (D.m.) and Dictyostelium discoideum (D.d.). Invariant and conserved residues are highlighted in green and yellow, respectively. Lighter shades of green or yellow indicate conservation between only two of the represented organisms. Barrels above the alignment represent α-helices, arrows β-sheets. HEAT-repeats H1-H3 are marked with black lines above the alignment. Residues in the heterodimeric interface and hydrophobic core are marked by black and red squares, respectively. Red triangles label residues potentially involved in nucleic acid interaction as identified here. The 'N-terminal domain' and 'extended region' of NELF-A are indicated. Sequence alignments were carried out with ClustalW2 (Larkin et al., 2007) followed by manual editing and rendered with JALVIEW (Waterhouse et al., 2009). DOI: http://dx.doi.org/10.7554/eLife.14981.002
Figure 1—figure supplement 1.
Figure 1—figure supplement 1.. Iterative truncation of full-length NELF-AC yields a variant amenable to crystallization and region of the electron density map.
(A) Partial digestion of pure full-length NELF-AC with chymotrypsin yields three stable degradation products that were identified as NELF-A N-terminal domain (residues 6–188), NELF-A C-terminal region (residues 248-485) and NELF-C (residues 52–590). The resulting truncated construct NELF-A6-188 C36-590 did not yield diffracting crystals. Shown are SDS-PAGE analyses stained with Coomassie blue. (B) Partial digestion of pure full-length NELF-AC and truncated NELF-A6-188 C36-590 with subtilisin yields the same stable degradation products for NELF-A (residues 6–188) and NELF-C (residues 190–590). (C) The resulting truncated variant NELF-A6-188 C183-590 (‘NELF-AC‘) was successfully used for crystallization. (D) The final 2Fo−Fc electron density map was contoured at 1.5 σ (grey) and the anomalous difference Fourier electron density for the selenomethionine-labeled crystal was contoured at 4.0 σ. The final model for NELF-C helix α4’ is superimposed in stick representation, showing the position of selenium atoms in selenomethionine residues (red) used for phasing. (E) Stereo image of electron density for the crystallized NELF-AC complex. The final 2Fo−Fc electron density map was contoured at 1.5 σ (grey) and the backbone of the complex is shown (cyan NELF-C, red NELF-A). DOI: http://dx.doi.org/10.7554/eLife.14981.003
Figure 1—figure supplement 2.
Figure 1—figure supplement 2.. Multiple sequence alignment of full-length NELF-A demonstrating the comparatively high conservation of the crystallized region.
The alignment compares full-length NELF-A from Homo sapiens, Mus musculus, Danio rerio, Drosophila melanogaster, Dictyostelium discoideum, Loa loa, Lottia gigantea, and Chlorella variabilis. Residues are colored according to percent conservation with darker blue representing higher conservation. The dark boxes indicate species-specific sequences that were removed due to repetitiveness and lack of sequence conservation. Barrels above the alignment represent α-helices, and are colored according to Figure 1B. N- and C-terminal borders of solved crystal structure are indicated. Sequence alignment was done with Mafft (Katoh and Standley, 2013) followed by manual editing and rendered with JALVIEW (Waterhouse et al., 2009). DOI: http://dx.doi.org/10.7554/eLife.14981.004
Figure 1—figure supplement 3.
Figure 1—figure supplement 3.. Multiple sequence alignment of the N-terminal region of NELF-C.
The alignment compares full-length NELF-C from Homo sapiens, Mus musculus, Danio rerio, Drosophila melanogaster, Dictyostelium discoideum, Loa loa, Lottia gigantea, and Chlorella variabilis. Residues are colored according to percent conservation with darker shades of blue representing higher conservation. Barrels above the alignment represent α-helices, arrows β-sheets and are colored according to Figure 1B. N- and C-terminal borders of solved crystal structure are indicated. Sequence alignment was done with Mafft (Katoh and Standley, 2013) followed by manual editing and rendered with JALVIEW (Waterhouse et al., 2009). Surprisingly, a part of the NELF-AC complex also exists in the single cell slime mold Dictyostelium discoideum and the green algae Chlorella variabilis. The hypothetical Dictyostelium proteins DDB_G0286295 and DDB_G0268678 share sequence similarity with the crystallized N-terminus of NELF-A (28% identity, 50% similarity) and C-terminal region of NELF-C (33% identity, 53% similarity) (Figure 1B). Similarly, the hypothetical C. variabilis proteins E1ZMT9 and E1Z2I7 also share sequence similarity with the crystallized N-terminus of NELF-A (25% identity, 44% similarity) and C-terminal region of NELF-C (23% identity, 39% similarity). The conservation of many residues in the hydrophobic core and heterodimer interface indicates that the NELF-AC subcomplex exists in this single cell organism. A putative Dictyostelium homolog is also found for a region of human NELF-B comprising residues 1–410 (DDB_G0284195) (Chang et al., 2012). NELF is likely present in both single and multicellular organisms. Plants may also lack NELF, indicating that they may be devoid of promoter proximal pausing or use other mechanisms to regulate gene expression at the level of elongation. Future work would benefit from understanding how NELF evolved and why some organisms either lost or lack the complex. DOI: http://dx.doi.org/10.7554/eLife.14981.005
Figure 2.
Figure 2.. Crystal structure of human NELF-AC complex.
(A) Ribbon model of NELF-AC with NELF-A in red and NELF-C in cyan. N- and C-termini, mobile regions, and truncated regions are indicated by dashed lines. The two views are related by a 180° rotation around the vertical axis. Curved lines marked 'H1–H3' demarcate alpha helices involved in heat repeats 1–3 (1: 14’, 15’; 2: 16’, 17’; 3: 18’, 19’). Alpha helices are named as in Figure 1B. All crystallography figures were rendered with Pymol (PyMOL, 2002). (B) NELF-A N-terminal domain enlarged and rotated 60° around the horizontal axis relative to 'bottom view' (Figure 2A). (C) Detailed view of invariant NELF-A residues W24 and W89 and surrounding residues (stick model) interacting with the NELF-C surface. NELF-C surface conservation colored according to Figure 1B. The view is rotated by 90° around the vertical axis relative to 'bottom view' (Figure 2A). (D) Detailed view of NELF-A helices α7 and α8 (stick model, residues 138–154) surrounded by NELF-C. NELF-C surface conservation is colored according to Figure 1B. The view is rotated 60° around the horizontal axis relative to 'bottom view' (Figure 2A). DOI: http://dx.doi.org/10.7554/eLife.14981.008
Figure 3.
Figure 3.. Architecture of human NELF complex as detected by crosslinking MS.
(A) The four-subunit human NELF complex was recombinantly expressed in insect cells and purified to homogeneity. The purified complex (0.9 µg) was run on a 4–12% gradient sodium dodecyl sulfate polyacrylamide gel electrophoresis (SDS-PAGE) and stained with Coomassie blue. A molecular weight marker (MW) in kilodaltons (kDa) is provided on the left side of the gel. (B) Cartoon depiction of individual NELF proteins. Different shades designate unique regions or domains of each protein (NELF-A red, NELF-B orange, NELF-C cyan, NELF-E purple). N- and C-term refers to the N- or C-terminus of a protein, respectively. RD repeats refer to a flexible region of NELF-E that is primarily composed of Arg and Asp residues. (CH) Crosslinks detected within the NELF tetramer displayed as binary interactions. Intraprotein crosslinks are shown as curves and colored as in (B). Interprotein crosslinks are shown as black lines. The endpoint of each line specifies a specific residue in the corresponding protein. Crosslinking data is filtered to display crosslinks with an ID-score greater than 30. A full map of all interprotein crosslinks is provided in Figure 3—figure supplement 1A. All crosslinks can be found in Figure 3—source data 1. Crosslinking data modeled with xiNET (Combe et al., 2015). (C) NELF-A, NELF-C (D) NELF-B, NELF-A (E) NELF-B, NELF-C (F) NELF-B, NELF-E (G) NELF-E, NELF-C (H) NELF-E, NELF-A. DOI: http://dx.doi.org/10.7554/eLife.14981.009
Figure 3—figure supplement 1.
Figure 3—figure supplement 1.. Additional information supporting NELF architecture as determined by crosslinking MS.
(A) Map of all crosslinks detected between NELF subunits. Crosslinks emanating from NELF-A are red, NELF-C are cyan, and NELF-E are purple. (B) Representative spectra of NELF inter and intraprotein crosslinks as determined by mass spectrometry. Sequences for crosslinked peptides are shown above the spectra. (C) Distances between inter- and intraprotein crosslinks within the NELF-AC crystal structure. Distances were measured in PyMol (PyMOL, 2002). Crosslinks greater than 30Å can be attributed to a conformation not present in the crystal structure between NELF-C helices 12’ and 13’ α helices 18’ and 19’. (D) Model of NELF-B as generated by I-TASSER. The model suggests NELF-B is highly alpha helical in nature and composed of heat repeats. NELF-B lysines that form inter- and intrasubunit crosslinks are indicated on the model. (E) Intrasubunit crosslinks between lysines 260 and 332 of the NELF-E RRM are marked on the NMR structure indicating the RRM fold is maintained in context of the NELF tetramer (PDB ID: 2JX2) (Rao et al., 2006). DOI: http://dx.doi.org/10.7554/eLife.14981.011
Figure 4.
Figure 4.. Surface properties of NELF-AC.
Two views of the solvent-accessible surface related by 180° rotations around a vertical axis are shown. (A) Surface representation of NELF-AC with shaded ellipses representing regions where NELF-B (orange) or NELF-E (purple) crosslinks with NELF-AC were detected. Lysines are shown in stick representation and numbered. NELF-B and NELF-E primarily crosslink to one face of the NELF-AC dimer. Four empty ellipses represent patches of positively charged residues. (B) Surface conservation. Residues that are invariant from human to Drosophila are in green, conserved residues in yellow (Figure 1B). Surface areas involved in nucleic acid binding (patches 1–4) (Results) are highlighted. Colors of labels according to color code of protein features belong to (Figure 2). (C) Electrostatic surface potential generated with ABPS (Baker et al., 2001). Blue, red, and white areas indicate positive, negative and neutral charge, respectively. Surface areas involved in nucleic acid binding (patches 1–4). Colors of labels according to color code of protein features belong to (Figure 2). DOI: http://dx.doi.org/10.7554/eLife.14981.012
Figure 4—figure supplement 1.
Figure 4—figure supplement 1.. Conserved surface patch 5.
A conserved polar surface area (patch 5) is formed by the C-terminal region of NELF-A and NELF-C helices α18’ and α20’. The view is rotated by 90º relative to Figure 3, bottom view. Residues forming the conserved surface are labeled. DOI: http://dx.doi.org/10.7554/eLife.14981.013
Figure 5.
Figure 5.. NELF-AC binds single-stranded nucleic acids.
(A) Binding of wild type (WT) NELF-AC to 10 nM fluorescently labeled ssRNA or ssDNA with 60% GC content as monitored by the change in relative fluorescence anisotropy. Error bars reflect the standard deviation from three experimental replicates. (B) Binding of wild type (WT) NELF-AC to 10 nM fluorescently labeled ssRNA with 44% GC content. The 60% RNA binding data shown in (A) is shown as a reference. Error bars reflect the standard deviation from three experimental replicates. (C, D) Binding of WT NELF-AC and variants containing mutations in surface patches (Figure 3) to the same ssRNA (B) or ssDNA (C) used in panel A. Numbers indicate mutated patches present in NELF-AC variants. Patch 1: NELF-A R65Q, R66Q, NELF-C R291Q, K315M Patch 2: NELF-C K371M, K372M, K374M Patch 3: NELF-C K384M, K388M Patch 4: NELF-A K146M, K161M, K168M, R175Q NELF-C R419Q, R506Q. DOI: http://dx.doi.org/10.7554/eLife.14981.014
Figure 5—figure supplement 1.
Figure 5—figure supplement 1.. Fluorescence anisotropy controls.
NELF-AC DNA (A) and RNA (B) binding detected by fluorescence anisotropy in the presence or absence of tRNA. Baker’s yeast tRNA was added to a final concentration of 5 µg/mL (approx. 200 nM, 100x greater concentration than substrate RNA) to determine whether NELF-AC nucleic acid binding activity is specific. The DNA and RNA substrates are the same used in Figure 4A,B. Error bars are representative of three experimental replicates. (C) Binding of WT NELF-AC to 10 nM of fluorescently labeled ssRNA and ssDNA derived from natural sequences of promoter-proximal regions of paused genes junB and c-fos (Materials and methods) as monitored by the change in relative fluorescence anisotropy. Inset: Schematic of the presence of single-stranded nucleic acids (ssRNA, ssDNA) in the promoter-proximally paused Pol II elongation complex. Error bars are representative of three experimental replicates. DOI: http://dx.doi.org/10.7554/eLife.14981.015
Figure 6.
Figure 6.. NELF-AC associates with RNA in context of the NELF tetramer.
(A) NELF constructs expressed and purified from insect cells represented as cartoons. NELF was produced as a FL construct, a construct lacking the NELF-E RRM (NELF ∆RRM), or without NELF-E (NELF-ABC). (B) Binding of the WT NELF tetramer, NELF ∆RRM, or NELF-ABC to 10 nM of the 60% GC content RNA as determined by relative change in fluorescence anisotropy. Data was fit with a single site binding equation when possible. Apparent Kd values are found in Table 3. Error bars reflect the standard deviation from three experimental replicates. (C–E) Binding of the WT or patch mutated NELF-C variants to 10 nM of the 60% GC content RNA as determined by fluorescence anisotropy. The following residues were mutated in the NELF-C patch mutant: R291Q, K315M, K371M, K372M, K374M, K384M, K388M, R419Q, R506Q. Darker shades of red indicate the WT protein constructs whereas lighter shades of red indicate the NELF-C patch mutated variant. Error bars reflect the standard deviation from three experimental replicates. When possible, curves were fit with a single site binding model and apparent Kd values are found in Table 3. (C) NELF tetramer (D) NELF ∆RRM (E) NELF-ABC. DOI: http://dx.doi.org/10.7554/eLife.14981.017
Figure 6—figure supplement 1.
Figure 6—figure supplement 1.. Purity of NELF truncation constructs and DNA binding.
(A) SDS-PAGE of purified NELF truncations, NELF-B, and NELF-BE (1–138). Protein (0.9 µg) was run on a 4–12% gel and stained with Coomassie blue. Molecular weight in kDa is indicated on the left side of the gel. (B) Binding of the WT NELF tetramer, NELF ∆RRM, or NELF-ABC to the 60% GC content ssDNA as determined by fluorescence anisotropy. Error bars reflect the standard deviation from three experimental replicates. (C) SDS-PAGE of purified NELF constructs containing patch mutated NELF-C. Protein (0.9 µg) was run on a gradient 4–12% SDS-PAGE and stained with Coomassie blue. Molecular weight is indicated on the left side of the gel. (D–F) Binding of the WT NELF tetramer and a NELF tetramer with patch mutated NELF-C to the 60% GC content ssDNA as determined by fluorescence anisotropy. Error bars reflect the standard deviation from three experimental replicates. Darker shades of blue indicate the WT protein constructs whereas lighter shades of blue indicate the NELF-C patch mutated variant. Error bars reflect the standard deviation from three experimental replicates. (D) NELF tetramer (E) NELF ∆RRM (F) NELF-ABC. DOI: http://dx.doi.org/10.7554/eLife.14981.018
Figure 7.
Figure 7.. NELF-B association with ssRNA, ssDNA and TAR RNA stem loop.
(A) Binding of NELF-B (light red) or NELF-BE (1–138) (red) to the 60% GC RNA as determined by fluorescence anisotropy. NELF-AC (dark red) (Figure 5A) binding to the same RNA is shown as a reference. Error bars reflect the standard deviation from three experimental replicates. Data were fit with a single site binding model. Apparent Kd values are reported in Table 3. (B) Binding of NELF-B (cyan) or NELF-BE (1–138) (sky blue) to the 60% GC DNA as determined by fluorescence anisotropy. NELF-AC (dark blue) (Figure 5A) binding is shown as a reference. Error bars reflect the standard deviation from three experimental replicates. Data were fit with a single site binding model. Apparent Kd values are reported in Table 3. (C) 2D structure of TAR RNA stem loop region used for fluorescence anisotropy experiments presented in (D). Dots indicate hydrogen bonds between bases. Lines represent the phosphate backbone. RNA was labeled with a 5’ FAM label. (D) Binding of the NELF tetramer (dark purple), NELF ∆RRM (orchid), NELF-ABC (thistle), NELF-BE (1–138) (medium purple), and NELF-AC (light purple) to the TAR RNA stem loop. Data were fit with a single site binding model. Apparent Kd values are reported in Table 3. DOI: http://dx.doi.org/10.7554/eLife.14981.019
Figure 8.
Figure 8.. NELF association with RNA in cells.
(A) Immunoprecipitation of the entire NELF complex by a NELF-E specific antibody from Jurkat cells treated with 4-thiouridine (4sU) for 16 hr and UV-crosslinked as detected by Western blot anaylsis with subunit specific antibodies. Cells treated with 4sU, but not UV-crosslinked are shown as a control. Star indicates NELF-C detected on the same blot. Western blot detected with HRP-conjugated secondary antibodies. (B) Phosphorimage of SDS-PAGE used to resolve RNAs crosslinked to NELF subunits from Panel A. Protein crosslinked to RNA was treated with PNK in the presence of ATP [γ-32P]. The resulting protein was run on a 4–12% gradient SDS-PAGE. The gel was incubated with a phosphorimage screen and imaged with a Typhoon imager. In crosslinked cells, a band is seen for the NELF-E and NELF-B/C subunits. Cells treated with 4sU, but not UV-crosslinked are shown as a control. A Coomassie stained gel with purified NELF is shown as size reference. (C) Phosphorimage of SDS-PAGE used to resolve 5’ P-32 labeled RNAs crosslinked to overexpressed -C (left), or -B (right) 293FT cells. Overexpressed NELF-C/-B were immunoprecipitated by N-terminal 3X FLAG tags. Coomassie stained gels of overexpressed NELF-C and -B are shown as a size reference. See Figure 8—figure supplement 3 for further controls. DOI: http://dx.doi.org/10.7554/eLife.14981.020
Figure 8—figure supplement 1.
Figure 8—figure supplement 1.. Additional controls for NELF-B, NELF-C and -E association with RNA in cells.
(A) Expression of NELF subunits in Jurkat and 293FT cells as determined by Western blot analysis. GAPDH was used as loading control. (B) The entire NELF complex is immunoprecipitated from 293FT cells by a NELF-E specific antibody. Cells were treated for 16 hr with 4sU prior to UV crosslinking and immunoprecipitaiton. Western blot analysis was performed with samples taken before and after NELF-E immunoprecipitation. Star indicates the NELF-C antibody. The same membrane was reblotted and not stripped between antibody applications. (C) Phosphorimage of SDS-PAGE used to resolve 5’ P-32 labeled RNAs crosslinked to NELF subunits from Panel B. Immunoprecipitated samples from cells treated with 4sU but not UV-crosslinked are shown as a control. Purified NELF subjected to SDS-PAGE and Coomassie staining is shown as a size reference. (D) Immunoprecipitation of NELF from Jurkat cells by a NELF-A specific antibody. Cells were treated for 16 hr with 4sU prior to UV crosslinking and immunoprecipitaiton. Western blot analysis was performed with samples taken before and after NELF-A immunoprecipitation. (E) Phosphorimage of SDS-PAGE used to resolve 5’ P-32 labeled RNAs crosslinked to NELF subunits derived from panel D. Immunoprecipitated samples from cells treated with 4sU but not UV crosslinked are shown as a control. Purified NELF subjected to SDS-PAGE and Coomassie staining is shown as a size reference. DOI: http://dx.doi.org/10.7554/eLife.14981.021
Figure 8—figure supplement 2.
Figure 8—figure supplement 2.. NELF complex peptides detected by mass spectrometry analysis after NELF-E IP.
After immunoprecipitation of NELF from Jurkat cells with a NELF-E antibody, protein was run on a gradient 4–12% SDS-PAGE. Bands corresponding to the molecular weight of NELF subunits were subjected to mass spectrometry to determine the protein identity. Peptides detected are marked on the protein sequence for each NELF subunit in green. Peptide counts and coverage are similar for each subunit, indicating the entire NELF complex is pulled down by the NELF-E antibody. DOI: http://dx.doi.org/10.7554/eLife.14981.022
Figure 8—figure supplement 3.
Figure 8—figure supplement 3.. Overexpression of NELF-A, NELF-B, and NELF-C in 293FT and RNA association.
(A) Western blot analysis of NELF expression in 293FT cells in the presence or absence of plasmids overexpressing 3X MYC-NELF-A, 3X FLAG-NELF-C, or 3X FLAG-NELF-B. Cells were treated with 4sU for 16 hr. GAPDH was used as loading control. (B) Immunoprecipitation of 3X MYC-NELF-A, 3X FLAG-NELF-C, or 3X FLAG-NELF-B from 293FT cells by MYC or FLAG specific antibodies, respectively. Lane 1 contains non-transfected cells (NELF-A and -C) or empty vector (NELF-B). Lane 2 contains cells carrying the overexpression plasmid for 3X MYC-NELF-A (upper blot), 3X FLAG-NELF-C (middle blot), or 3X FLAG NELF-B (lower blot). Cells were treated for 16 hr with 4sU prior to UV crosslinking and immunoprecipitation. Western blot analysis was carried out with either MYC or FLAG antibodies. (C) Phosphorimage of SDS PAGE used to resolve 5’ P-32 labeled RNAs crosslinked to overexpressed NELF-A. in 293FT cells. Overexpressed NELF-A was immunoprecipitated by N-terminal 3X MYC tag, (see panel G). Coomassie stained gels of overexpressed NELF-C and -B are shown as a size reference. DOI: http://dx.doi.org/10.7554/eLife.14981.023
Figure 9.
Figure 9.. Model of NELF architecture and RNA binding regions.
The NELF-AC crystal structure, crosslinking data, and in vivo experiments reveal the overall architecture of NELF. NELF-AC (NELF-A red, NELF-C cyan) forms a stable complex that interacts with the N-terminus of NELF-B (orange). NELF-B N- and C- termini sandwich the NELF-E N-terminus. The NELF-E RRM is loosely connected to the entire complex. RNA binds to NELF-E, NELF-B, and NELF-C. The two faces of NELF-AC determined by crystallography and crosslinking are shown below the complex in cartoon format. Three RNA binding faces on the surface of NELF-C are marked with numbers (1, 2, 4). The region of NELF-A that is predicted to bind Pol II, which is absent in our crystal structure is boxed. N- and C- termini for each protein are marked. DOI: http://dx.doi.org/10.7554/eLife.14981.024

Similar articles

Cited by

References

    1. Adams PD, Afonine PV, Bunkóczi G, Chen VB, Davis IW, Echols N, Headd JJ, Hung LW, Kapral GJ, Grosse-Kunstleve RW, McCoy AJ, Moriarty NW, Oeffner R, Read RJ, Richardson DC, Richardson JS, Terwilliger TC, Zwart PH. PHENIX: a comprehensive Python-based system for macromolecular structure solution. Acta Crystallographica. Section D, Biological Crystallography. 2010;66:213–221. doi: 10.1107/S0907444909052925. - DOI - PMC - PubMed
    1. Aida M, Chen Y, Nakajima K, Yamaguchi Y, Wada T, Handa H. Transcriptional pausing caused by NELF plays a dual role in regulating immediate-early expression of the junB gene. Molecular and Cellular Biology. 2006;26:6094–6104. doi: 10.1128/MCB.02366-05. - DOI - PMC - PubMed
    1. Aiyar SE, Sun JL, Blair AL, Moskaluk CA, Lu YZ, Ye QN, Yamaguchi Y, Mukherjee A, Ren DM, Handa H, Li R, Handa H, Li H. Attenuation of estrogen receptor alpha-mediated transcription through estrogen-stimulated recruitment of a negative elongation factor. Genes & Development. 2004;18:2134–2146. doi: 10.1101/gad.1214104. - DOI - PMC - PubMed
    1. Baker NA, Sept D, Joseph S, Holst MJ, McCammon JA. Electrostatics of nanosystems: application to microtubules and the ribosome. Proceedings of the National Academy of Sciences of the United States of America. 2001;98:10037–10041. doi: 10.1073/pnas.181342398. - DOI - PMC - PubMed
    1. Baumli S, Hole AJ, Wang LZ, Noble ME, Endicott JA. The CDK9 tail determines the reaction pathway of positive transcription elongation factor b. Structure. 2012;20:1788–1795. doi: 10.1016/j.str.2012.08.011. - DOI - PMC - PubMed