. 2016 Aug;26(8):3637-3654.
doi: 10.1093/cercor/bhw172. Epub 2016 Jun 9.

Presynaptic Spike Timing-Dependent Long-Term Depression in the Mouse Hippocampus

Affiliations

Presynaptic Spike Timing-Dependent Long-Term Depression in the Mouse Hippocampus

Yuniesky Andrade-Talavera et al. Cereb Cortex. 2016 Aug.

Abstract

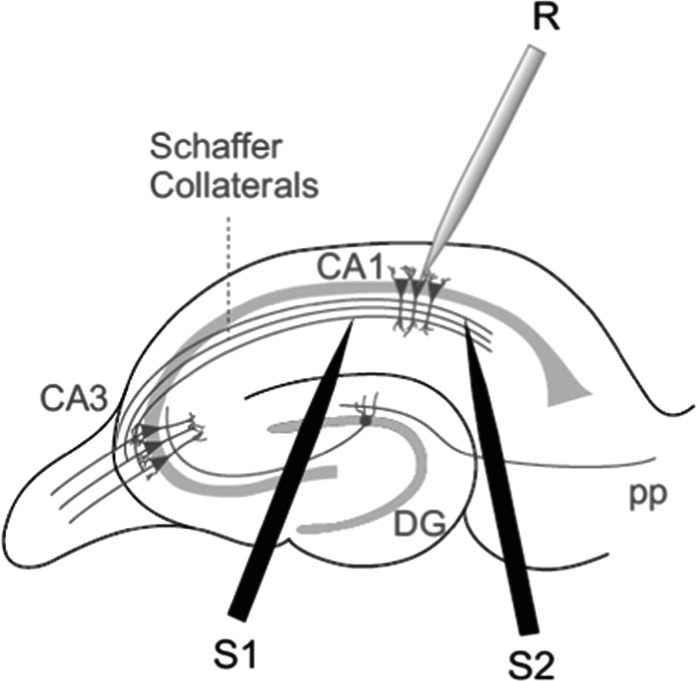
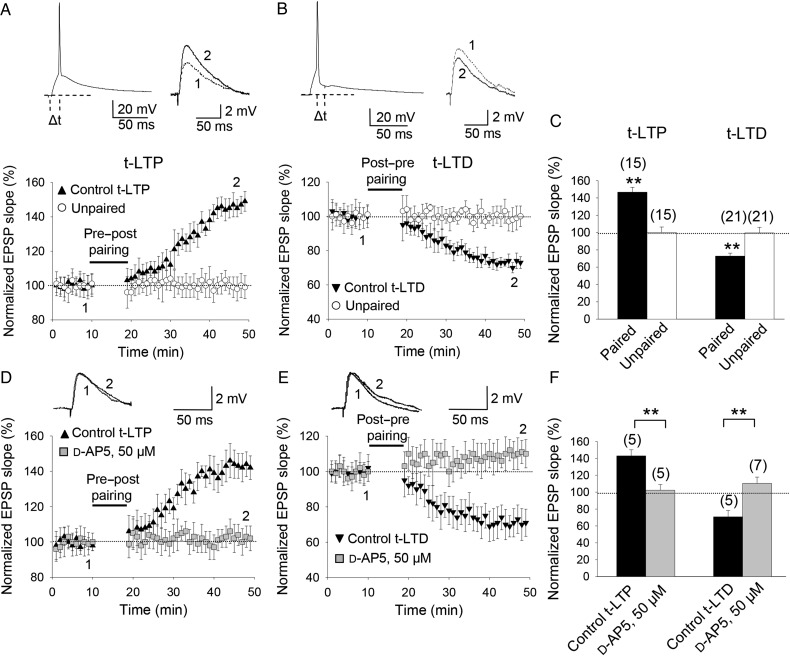
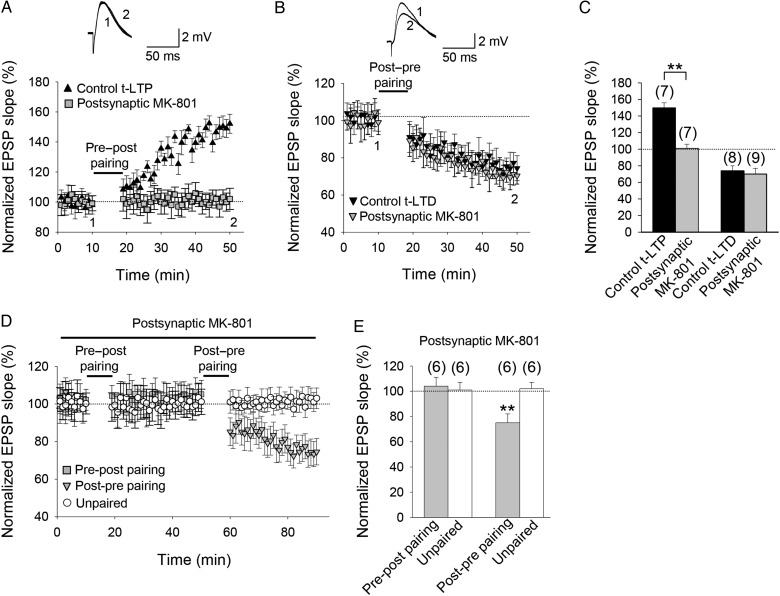
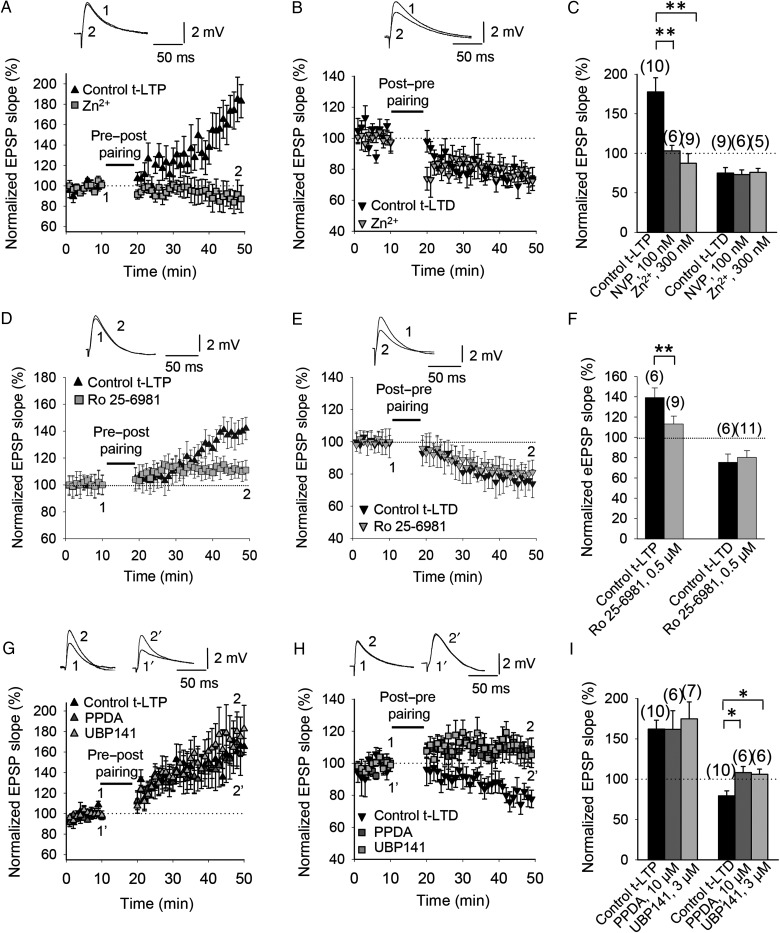
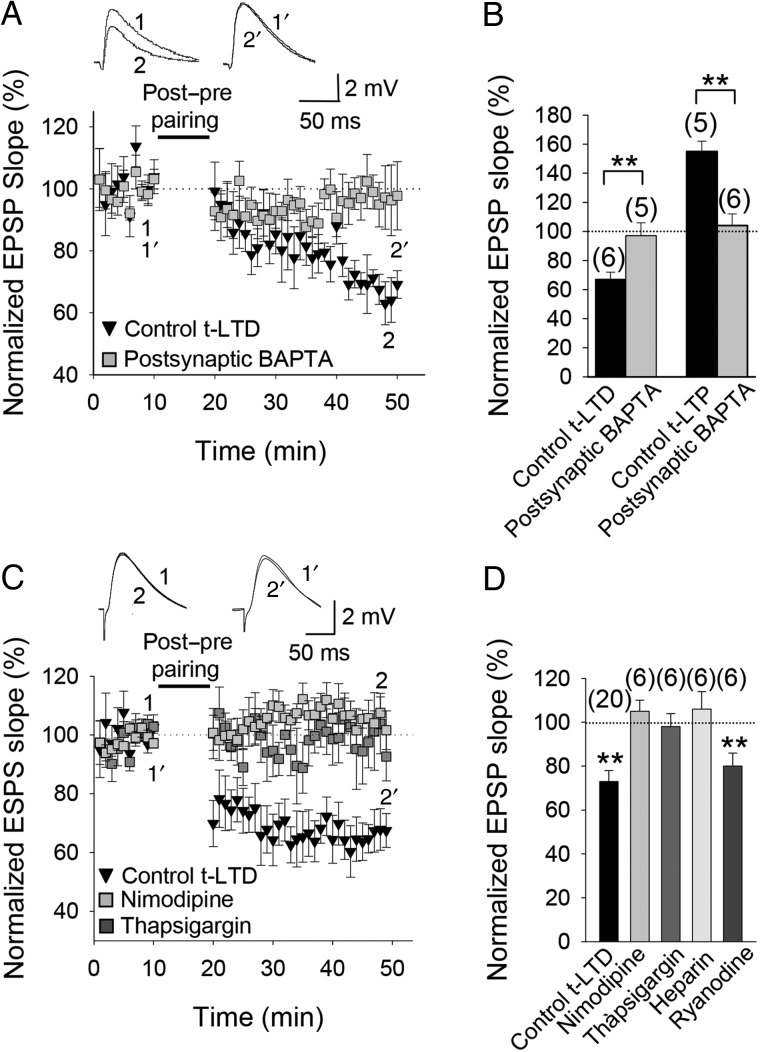
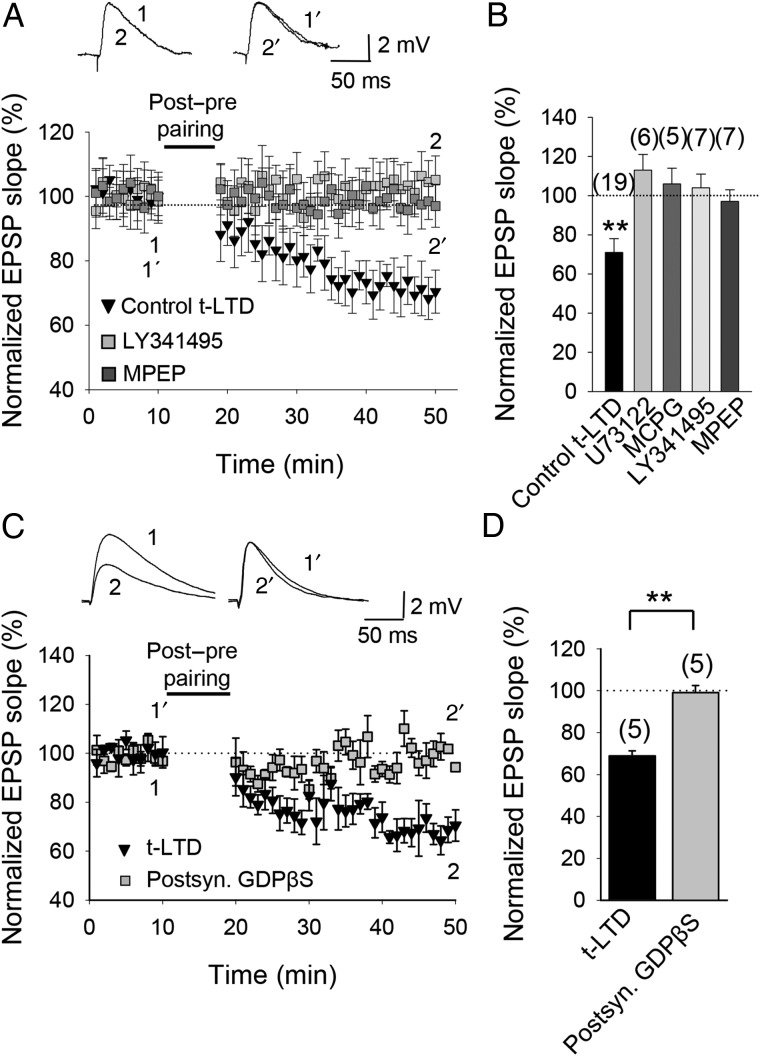
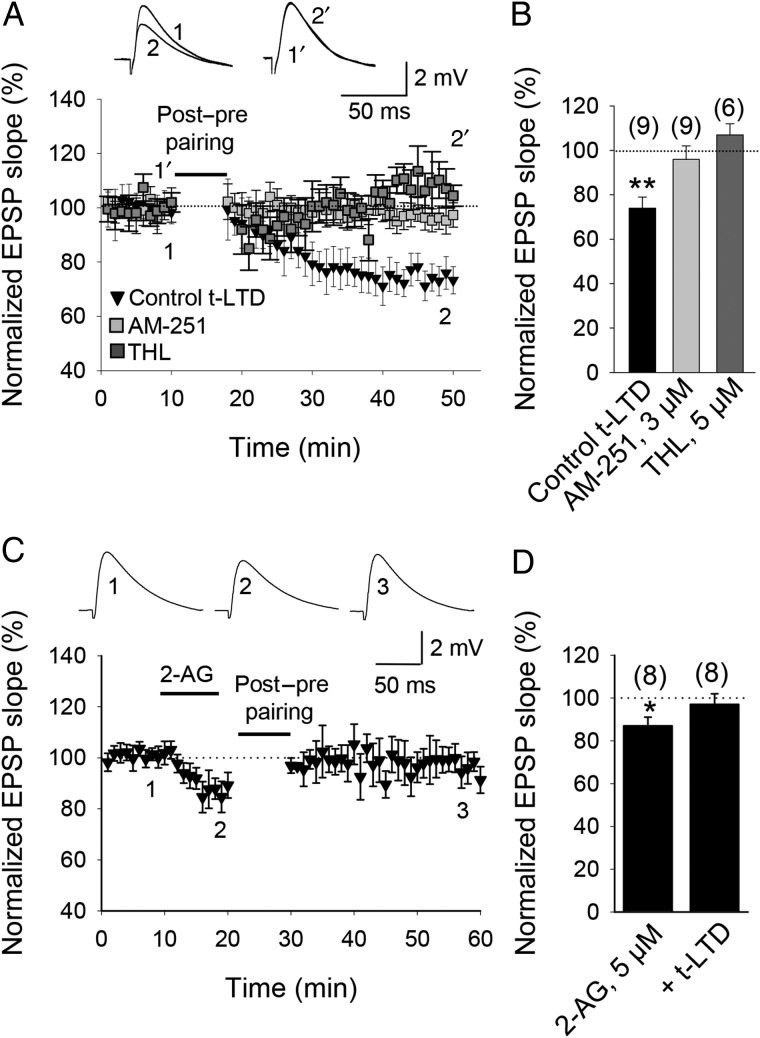
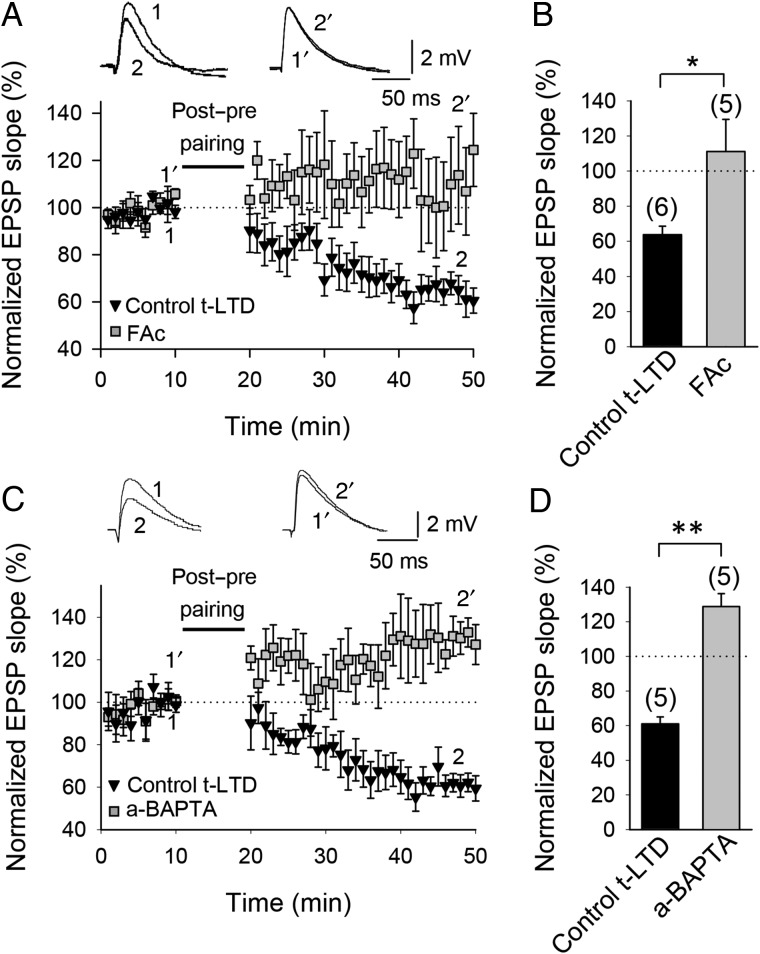
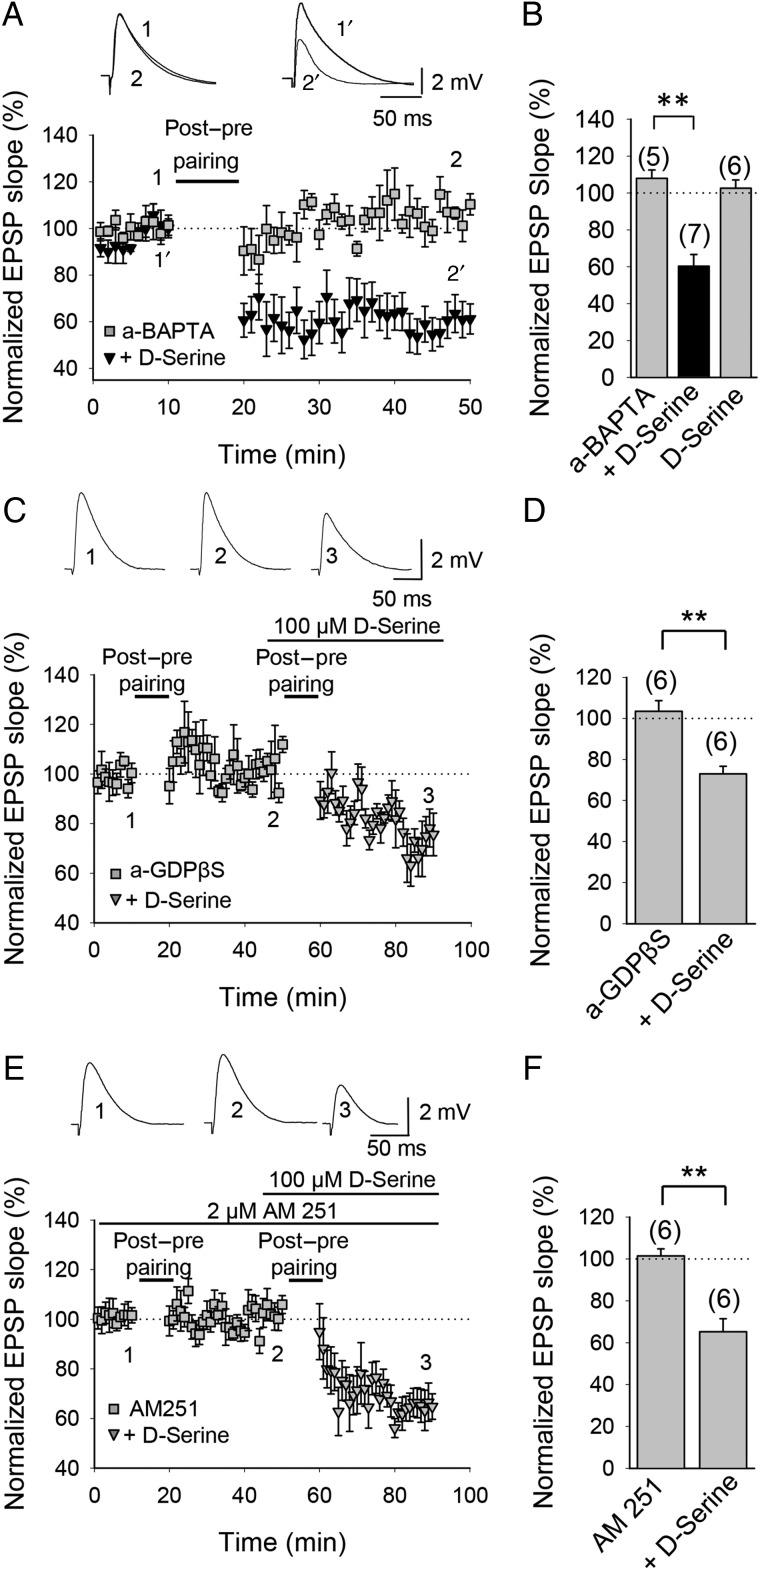
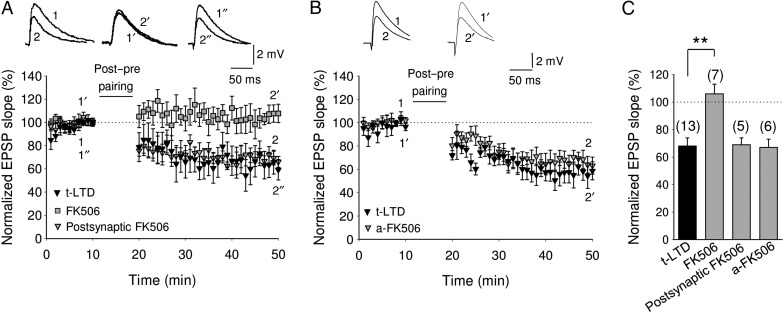
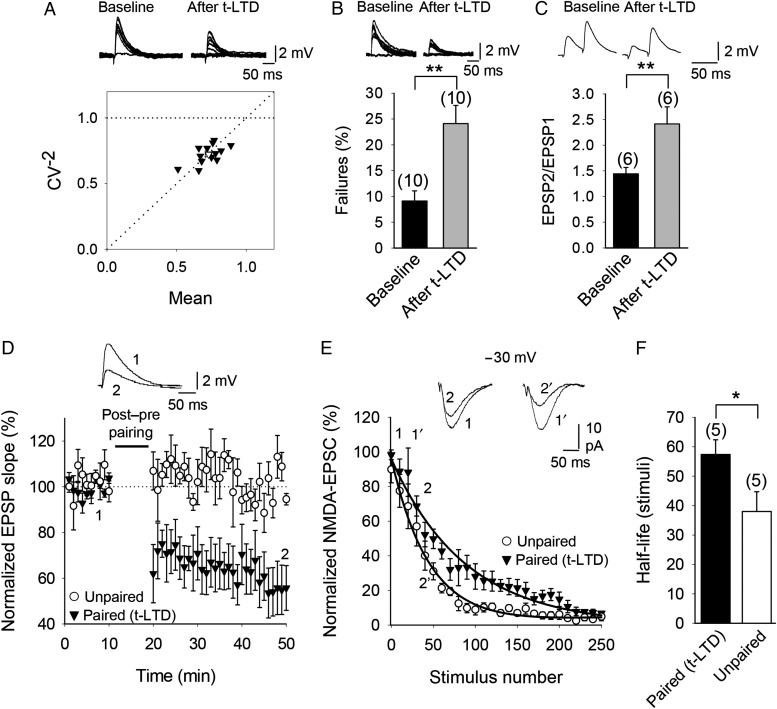
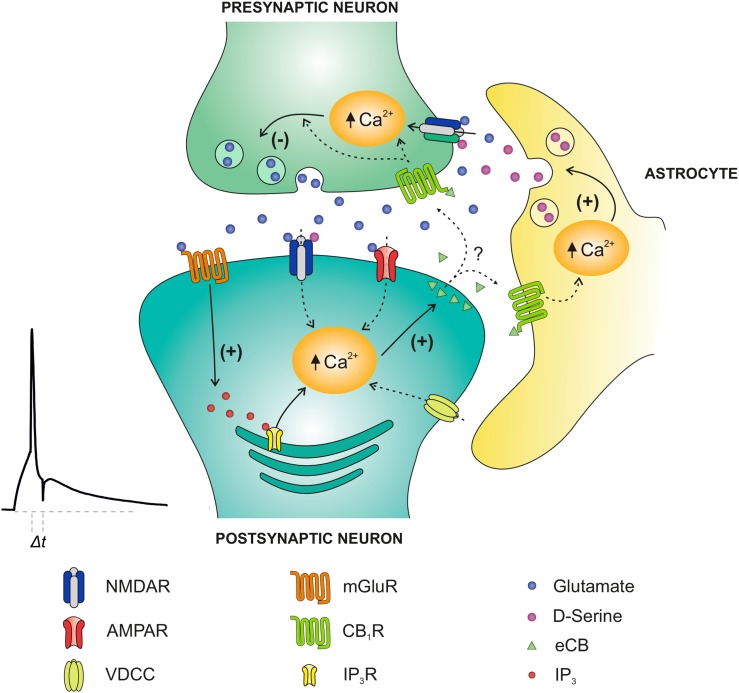
Spike timing-dependent plasticity (STDP) is a Hebbian learning rule important for synaptic refinement during development and for learning and memory in the adult. Given the importance of the hippocampus in memory, surprisingly little is known about the mechanisms and functions of hippocampal STDP. In the present work, we investigated the requirements for induction of hippocampal spike timing-dependent long-term potentiation (t-LTP) and spike timing-dependent long-term depression (t-LTD) and the mechanisms of these 2 forms of plasticity at CA3-CA1 synapses in young (P12-P18) mouse hippocampus. We found that both t-LTP and t-LTD can be induced at hippocampal CA3-CA1 synapses by pairing presynaptic activity with single postsynaptic action potentials at low stimulation frequency (0.2 Hz). Both t-LTP and t-LTD require NMDA-type glutamate receptors for their induction, but the location and properties of these receptors are different: While t-LTP requires postsynaptic ionotropic NMDA receptor function, t-LTD does not, and whereas t-LTP is blocked by antagonists at GluN2A and GluN2B subunit-containing NMDA receptors, t-LTD is blocked by GluN2C or GluN2D subunit-preferring NMDA receptor antagonists. Both t-LTP and t-LTD require postsynaptic Ca(2+) for their induction. Induction of t-LTD also requires metabotropic glutamate receptor activation, phospholipase C activation, postsynaptic IP3 receptor-mediated Ca(2+) release from internal stores, postsynaptic endocannabinoid (eCB) synthesis, activation of CB1 receptors and astrocytic signaling, possibly via release of the gliotransmitter d-serine. We furthermore found that presynaptic calcineurin is required for t-LTD induction. t-LTD is expressed presynaptically as indicated by fluctuation analysis, paired-pulse ratio, and rate of use-dependent depression of postsynaptic NMDA receptor currents by MK801. The results show that CA3-CA1 synapses display both NMDA receptor-dependent t-LTP and t-LTD during development and identify a presynaptic form of hippocampal t-LTD similar to that previously described at neocortical synapses during development.

Keywords: NMDA receptor; hippocampus; spike timing-dependent plasticity; t-LTD; t-LTP.


Figures

Figure 1.
Figure 1.
Scheme showing general experimental setup. R, recording electrode; S1 and S2, stimulating electrodes.
Figure 2.
Figure 2.
Input-specific STDP in the CA1 region of the hippocampus. (A) Pre-before-post, single-spike pairing protocol induced t-LTP. The EPSP slopes monitored in paired (black symbols) and unpaired pathway (open symbols) are shown. Inset, pairing protocol (Δt, time between EPSP onset and peak of spike). Traces show EPSP before (1) and 30 min after (2) pairing. Potentiation was observed only in the paired pathway. (B) Post-before-pre, single-spike pairing protocol induced t-LTD. Symbols and traces as in (A). t-LTD was observed only in the paired pathway. (C) Summary of results. (D,E) t-LTP and t-LTD required NMDA receptors. In the presence of 50 µM d-AP5, t-LTP (D) and t-LTD (E) were completely blocked. Symbols and traces as in (A). (F) Summary of results. Error bars are SEM. **P < 0.01, unpaired Student's t-test. The numbers of slices are shown in parentheses.
Figure 3.
Figure 3.
t-LTP but not t-LTD requires postsynaptic ionotropic NMDA receptors. (A) Postsynaptic MK-801 completely blocked induction of t-LTP. EPSP slope monitored in MK-801-treated (gray symbols) and nontreated cells (black symbols). Inset, Traces show EPSP before (1) and 30 min after (2) pairing. (B) Inclusion of MK-801 in the postsynaptic pipette did not block t-LTD. Symbols and traces as in (A). (C) Summary of results. (D) EPSP slope monitored over time in MK-801-treated neurons in a test pathway (gray symbols) and an unpaired control pathway (open symbols). After 10 min of baseline recording with 1 mM MK801 in the postsynaptic recording pipette, a pre-before-post pairing protocol in the test pathway failed to induce t-LTP and the unpaired pathway remained unchanged. Thirty minutes after the pre-before-post pairing protocol, a post-before-pre pairing protocol was applied to the same pathway. Input-specific t-LTD was induced. (E) Summary of results. Error bars are SEM. **P < 0.01, unpaired Student's t-test. The numbers of slices are shown in parentheses.
Figure 4.
Figure 4.
Subunit composition of NMDA receptors involved in t-LTP and t-LTD at CA3-CA1 synapses of the hippocampus. (A) GluN2A subunit dependence of t-LTP. t-LTP induction following a pre-before-post pairing paradigm was completely blocked by bath application of 300 nM Zn2+ (gray squares). (B) t-LTD following post-before-pre pairing was unaffected by bath application of 300 nM Zn2+ (gray triangles). Insets, Traces show EPSP before (1) and 30 min after (2) pairing in (A,B). (C) Summary of results. NVP, NVP-AAM077. (D) GluN2B subunit dependence of t-LTP. t-LTP induction was almost completely prevented by bath application of 0.5 µM Ro 25-6981 (gray squares). (E) t-LTD was unaffected by bath application of 0.5 µM Ro 25-6981 (gray triangles). Insets, EPSP before (1) and 30 min after (2) the pairing protocol in (D,E). (F) Summary of results. (G) Neither PPDA (10 µM) nor UBP-141 (3 µM) prevented t-LTP induction following a pre-before-post pairing protocol (gray triangles). (H) GluN2C/2D subunit dependence of t-LTD. PPDA (10 µM) blocked t-LTD following a post-before-pre pairing protocol. A more selective GluN2C/2D blocker, UBP-141 (3 µM), also blocked t-LTD (gray squares). Insets, EPSP before (1 and 1′) and 30 min after (2 and 2′) the pairing protocol. (I) Summary of results. Error bars are SEM. *P < 0.05, **P < 0.01, unpaired Student's t-test. The numbers of slices are shown in parentheses.
Figure 5.
Figure 5.
Calcium sources for t-LTD. (A) t-LTD was prevented by BAPTA (20 mM) in the postsynaptic recording pipette. Insets show EPSP before (1 and 1′) and after (2 and 2′) post-before-pre pairing in control conditions and with BAPTA in the postsynaptic pipette. (B) Summary of results. Both t-LTD and t-LTP were blocked by postsynaptic BAPTA. (C) Nimodipine or blocking Ca2+ release from internal stores with thapsigargin (10 µM) prevented t-LTD. The EPSP slopes monitored in paired control slices (black symbols) and in paired slices treated with nimodipine (gray symbols) or thapsigargin (dark gray symbols). Traces show EPSP before (1 and 1′) and 30 min after (2 and 2′) pairing in slices treated with nimodipine (1 and 2) or thapsigargin (1′ and 2′). (D) Summary of results. Nimodipine, thapsigargin and heparin (400 U/mL) all blocked induction of t-LTD, shown versus the pooled interleaved controls (73 ± 8%, n = 18), whereas ryanodine did not. Error bars are SEM. **Indicates P < 0.01, unpaired Student's t-test. The numbers of slices are shown in parentheses.
Figure 6.
Figure 6.
Metabotropic glutamate receptor involvement in t-LTD. (A) t-LTD requires mGlu5 receptors and PLC signaling. The EPSP slopes monitored in control slices (black symbols) and in slices treated with the mGluR antagonist LY341495 (gray symbols) or the mGlu5 receptor antagonist MPEP (dark gray symbols) following post-before-pre pairing. Inset, Traces show EPSP before (1 and 1′) and 30 min after (2 and 2′) pairing in slices treated with LY341495 (1 and 2) and in slices treated with MPEP (1′ and 2′). (B) Summary of results. (C) t-LTD requires activation of postsynaptic metabotropic receptors. Time course of t-LTD induction in control conditions (black symbols) and with the postsynaptic neuron loaded with GDPβS. Inset, Traces show EPSP before (1 and 1′) and 30 min after pairing (2 and 2′) in control slices (1 and 2) and with the postsynaptic neuron loaded with GDPβS (1′ and 2′). (D) Summary of results. Error bars are SEM. **P < 0.01, unpaired Student's t-test. The numbers of slices are shown in parentheses.
Figure 7.
Figure 7.
Cannabinoid receptor involvement in t-LTD. (A) t-LTD requires activation of CB1 receptors. Time course of t-LTD induction in control conditions (black symbols) and in slices treated with the CB1 receptor antagonist AM251 following post-before-pre pairing. Inset: Traces show EPSP before (1 and 1′) and 30 min after pairing (2 and 2′) in control slices (1 and 2) and in slices treated with AM251 (1′ and 2′). (B) Summary of results. Note that in the presence of THL, t-LTD was completely prevented. (C) 2-AG effect on EPSPs. After 2-AG t-LTD induction is prevented. Inset: Traces show baseline EPSP (1), after 2-AG (2), and 30 min after pairing (3). (D) Summary of results. Error bars are SEM. *P < 0.05, **P < 0.01, unpaired Student's t-test. The numbers of slices are shown in parentheses.
Figure 8.
Figure 8.
Astroglial involvement in t-LTD. (A) Time course of t-LTD induction in control conditions (black symbols) and absence of t-LTD in fluoroacetate (FAc)-treated slices (gray symbols). Inset, Traces show EPSP before (1 and 1′) and 30 min after pairing (2 and 2′) in control slices (1 and 2) and in slices treated with FAc (1′ and 2′). (B) Summary of results. (C) Astrocyte-neuron dual recordings performed during t-LTD induction in control conditions (astrocyte loaded with the same intracellular solution as used for neurons; black symbols) and with astrocytes loaded with the calcium chelator BAPTA via the recording pipette (a-BAPTA; gray symbols). Inset: Traces show EPSP before (1 and 1′) and 30 min after pairing (2 and 2′) in control conditions (1 and 2) and in a-BAPTA conditions (1′ and 2′). (D) Summary of results. Error bars are SEM. *P < 0.05, **P < 0.01, unpaired Student's t-test. The numbers of slices are shown in parentheses.
Figure 9.
Figure 9.
Astroglial d-serine involvement in t-LTD. (A) d-Serine recovers t-LTD in recordings with BAPTA-treated astrocytes. Astrocyte-neuron dual recordings during post-before-pre pairing with the calcium chelator BAPTA included in the astrocyte via the recording pipette (a-BAPTA conditions) without (gray squares) and in the presence of 100 µM d-serine (black triangles). Inset: Representative traces from baseline (1) and 30 min after pairing protocol (2) in a-BAPTA conditions and from baseline (1′) and 30 min after pairing protocol (2′) in a-BAPTA conditions in the presence of 100 µM d-serine. (B) Summary of results. Gray column labeled ‘d-Serine’ shows a-BAPTA condition without pairing protocol. (C) d-Serine recovers t-LTD in recordings with GDPβS-treated astrocytes. Astrocyte-neuron dual recordings performed during post-before-pre pairing with GDPβS included in the astrocyte via the recording pipette (a-GDPβS conditions) without (gray squares) and in the presence of 100 µM d-serine (gray triangles). Inset: Representative traces from baseline (1) and 30 min after pairing protocol (2) in a-GDPβS conditions and 30 min after applying again the t-LTD induction protocol in the presence of 100 µM d-serine (3). (D) Summary of results. (E) d-Serine recovers t-LTD in AM251-treated slices. In the presence of AM251 t-LTD induction is prevented (gray squares) and recovered in the presence of 100 µM d-serine (gray triangles). Inset: Representative traces from baseline (1) and 30 min after pairing protocol (2) in AM251-tretaed slices and 30 min after applying again the t-LTD induction protocol in the presence of 100 µM d-serine (3). (F) Summary of results. Error bars are SEM. **P < 0.01, unpaired Student's t-test. The numbers of slices are shown in parentheses.
Figure 10.
Figure 10.
Presynaptic calcineurin is involved in t-LTD at CA3-CA1 synapses. (A) Time course of effect of post-before-pre pairing in control conditions (black triangles) and in FK506 (10 µM)-treated slices (bath applied, gray squares) or loaded into the postsynaptic cell via the patch pipette (gray triangles). Inset, Traces show EPSP before (1, 1′ and 1″) and 30 min after pairing (2, 2′ and 2″) in control slices (1 and 2) and in slices treated with FK506 in the bath (1′ and 2′) or loaded into the postsynaptic cell (1″ and 2″). (B) Time course of effect of post-before-pre pairing in control conditions (black triangles) and in FK506 (10 µM)-treated slices loaded into astrocytes via the patch pipette (gray triangles). Inset, Traces show EPSP before (1 and 1′) and 30 min after pairing (2 and 2′) in control slices (1 and 2) and in slices treated with FK506 loaded into the astrocytes (1′ and 2′). Note that t-LTD induction is prevented by adding FK506 to the bath, whereas it is not affected by loading the inhibitor into the postsynaptic cell or into the astrocyte. (C) Summary of results. Error bars are SEM. **P < 0.01, unpaired Student's t-test. The numbers of slices are shown in parentheses.
Figure 11.
Figure 11.
t-LTD at CA3-CA1 synapses is presynaptically expressed. (A) CV analysis is consistent with presynaptic expression of t-LTD. Normalized plot of CV−2 versus mean EPSP slope yielded points along the diagonal following induction of t-LTD. Inset, Example traces during baseline and 30 min after induction of t-LTD. (B) Number of failures increased after t-LTD induction. Inset, Example traces during baseline and 30 min after induction of t-LTD. (C) PPR increased after t-LTD. Inset, Example traces during baseline and 30 min after induction of t-LTD. (D) EPSP slopes monitored in paired (black triangles) and unpaired pathway (white circles). Traces show EPSP before (1) and 30 min after (2) t-LTD induction protocol in the paired pathway. Only the paired pathway showed t-LTD. (E) NMDA receptor-mediated EPSC peak amplitudes monitored in the same cells after bath application of MK-801 at the end of the EPSP recordings shown in (D). A single exponential function was fitted to the experimental data in both pathways. A slower decay of NMDAR-EPSC amplitudes was observed in the paired pathway (black triangles) compared with the unpaired pathway (white circles). (F) The half-life was estimated from the fitted function for each individual experiment in paired and unpaired pathways. The error bars are SEM. *P < 0.05, **P < 0.01, unpaired Student's t-test. The numbers of slices are shown in parentheses.
Figure 12.
Figure 12.
Model of presynaptic t-LTD at CA3-CA1 synapses of the hippocampus. t-LTD is induced by a post-before-pre, single-spike pairing protocol. Postsynaptic action potentials activate voltage-dependent Ca2+ channels (VDCCs), and presynaptically released glutamate activates postsynaptic mGlu5 receptors, which synergistically activate PLC, producing IP3, which causes Ca2+ release from internal stores, and DAG, which serves as precursor for eCBs synthesis. The eCB signal leads to activation of CB1 receptors, facilitating d-serine release from astrocytes, which, together with glutamate released from presynaptic neurons, activates presynaptic NMDA receptors on Schaffer collateral boutons. This leads to an increase in presynaptic Ca2+, activation of calcineurin and synaptic depression.

References

    1. Alger BE. 2002. Retrograde signalling in the regulation of synaptic transmission: focus on endocannabinoids. Prog Neurobiol. 68:247–286. - PubMed
    1. Andersson M, Blomstand F, Hanse E. 2007. Astrocytes play a critical role in transient heterosynaptic depression in the rat hippocampal CA1 region. J Physiol. 585:843–855. - PMC - PubMed
    1. Anwyl R. 1999. Metabotropic glutamate receptors: electrophysiological properties and role in plasticity. Brain Res Rev. 29:83–120. - PubMed
    1. Araque A, Carmignoto G, Haydon PG, Oliet SH, Robitaille R, Volterra A. 2014. Gliotransmitters travel in time and space. Neuron. 81:728–739. - PMC - PubMed
    1. Auberson YP, Allegier H, Bischoff S, Lingenhoehl K, Moretti R, Schmutz M. 2002. 5-Phosphonomethylquinoxalinediones as competitive NMDA receptor antagonists with a preference for the human 1A/2A, rather 1A/2B receptor composition. Bioorg Med Chem Lett. 12:1099–1102. - PubMed

MeSH terms