. 2016 Jun 10:6:27569.
doi: 10.1038/srep27569.

IDH-mutant glioma specific association of rs55705857 located at 8q24.21 involves MYC deregulation

Affiliations

IDH-mutant glioma specific association of rs55705857 located at 8q24.21 involves MYC deregulation

Yavuz Oktay et al. Sci Rep. .

Abstract

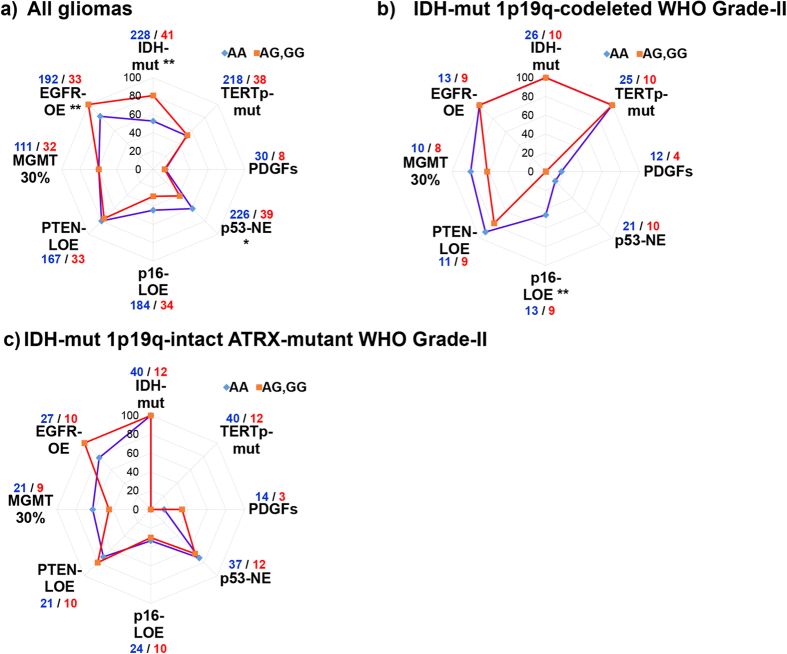
The single nucleotide polymorphism rs55705857, located in a non-coding but evolutionarily conserved region at 8q24.21, is strongly associated with IDH-mutant glioma development and was suggested to be a causal variant. However, the molecular mechanism underlying this association has remained unknown. With a case control study in 285 gliomas, 316 healthy controls, 380 systemic cancers, 31 other CNS-tumors, and 120 IDH-mutant cartilaginous tumors, we identified that the association was specific to IDH-mutant gliomas. Odds-ratios were 9.25 (5.17-16.52; 95% CI) for IDH-mutated gliomas and 12.85 (5.94-27.83; 95% CI) for IDH-mutated, 1p/19q co-deleted gliomas. Decreasing strength with increasing anaplasia implied a modulatory effect. No somatic mutations were noted at this locus in 114 blood-tumor pairs, nor was there a copy number difference between risk-allele and only-ancestral allele carriers. CCDC26 RNA-expression was rare and not different between the two groups. There were only minor subtype-specific differences in common glioma driver genes. RNA sequencing and LC-MS/MS comparisons pointed to significantly altered MYC-signaling. Baseline enhancer activity of the conserved region specifically on the MYC promoter and its further positive modulation by the SNP risk-allele was shown in vitro. Our findings implicate MYC deregulation as the underlying cause of the observed association.


Figures

Figure 1
Figure 1. rs55705857 is associated with increased glioma risk in the Turkish population.
(a) Comparison of rs55705857 G-allele frequency (MAF) in Turkish population to other populations. Allele frequency was obtained by genotyping a total of 727 controls (316 healthy controls and 411 cancer patients). (b) 285 glioma patients of various grades and pathologies were genotyped and odds ratio (OR) of developing glioma for rs55705857-G allele carriers was determined. Error bars indicate 95% confidence interval. (c) Trio based Transmission disequilibrium test (TDT) was employed to test for association between rs55705857 genotype and glioma risk. OR: odds ratio; p-value was calculated by chi-square-test.
Figure 2
Figure 2. rs55705857 is associated with IDH mutations and lower-grade in gliomas.
Stratification of gliomas by (a) grade and IDH mutation status, (b) molecular subtype that is based on IDH1/2 mutation, 1p/19q-codeletion, ATRX mutation status and grade. (square) indicates IDH-mutant tumors, (triangle) indicates IDH-wild-type tumors. Error bars indicate 95% confidence interval. Number of patients genotyped under each subtype is given on the left hand side and their genotype distribution on the right hand side, while the exact value of odds ratio is indicated above data points. (*) Indicates a statistical significance level of p < 0.05; (**) indicates a statistical significance level of p < 0.001; (***) indicates a statistical significance level of p < 0.0001. (c) 114 matched blood-tumor samples for genotyped for rs55705857 to exclude possible “Knudsonian second-hits”. 14 samples were of A/G genotype, 100 samples were of A/A genotype. y-axis indicates “%” concordance OR: odds ratio; n = number of patients.
Figure 3
Figure 3. Distribution of molecular alterations according to rs55705857 genotype and glioma subtype suggests subtype-specific differences.
Differential distribution of molecular alterations between A/G and A/A groups of (a) all gliomas, (b) WHO grade-II oligodendrogliomas with IDH mutation, 1p/19q-codeletion and lack of ATRX mutations, (c) WHO grade-II astrocytomas with IDH mutation and ATRX mutations, were plotted as radar graphs. ATRX, p53, p16, PTEN, EGFR and MGMT status was determined by immunohistochemical staining of FFPE-sections. An arbitrary level of 30% was used to determine MGMT promoter methylation. IDH1/2 and TERT promoter mutations were detected by PCR and Sanger sequencing of target region or by “mini-sequencing”. PDGFs indicates copy number gain in any of PDGFA, PDGFB, PDGFRA or PDGFRB, determined by exome sequencing. Number of samples analyzed for each alteration are indicated at the corners of the radar graph in blue (A/A) and red (A/G, G/G). Differential distribution of each molecular alteration between A/G and A/A groups of tumors was determined by chi-square test. y-axis indicates percentage of samples with alteration. (*) Indicates a significance level of p < 0.05; (**) indicates a significance level of p < 0.01. LOE: loss-of-expression; NE: nuclear-expression; TERTp: TERT promoter.
Figure 4
Figure 4. Transcriptional regulation analysis of LC-MS/MS comparison of WHO grade-II oligodendrogliomas and astrocytomas point to differential MYC network activity between rs55705857-G allele carriers and non-carriers.
Left panel: MetaCore transcriptional regulation analysis of differentially expressed proteins between A/G (n = 3) and A/A (n = 6) groups of IDH-mutant 1p/19q co-deleted ATRX-wt diffuse gliomas. Right panel: the same analysis was performed on LC-MS/MS data of IDH-mutant 1p/19q-intact ATRX-mut diffuse gliomas, A/G (n = 3) and A/A (n = 4) groups. “GO processes” and the particular p-value for each process is listed in the second column of each panel. zScore indicates the standard/normalized score for each transcription factor network analyzed.
Figure 5
Figure 5. The region encompassing rs55705857 acts as a MYC enhancer and rs55705857-G allele increases this activity.
(a) Chromatin Topological Domain structure and epigenetic and transcriptional features of the region around rs55705857 and MYC. Normalized Hi–C interaction frequency displayed as a two-dimensional heat map showing the topologic domain that includes the glioma risk allele rs55705857 as well as the MYC oncogene (Adapted from21). The frequency of interaction between two 40-kb genomic regions is indicated by the color intensity at their diagonal intersection. (b) Epigenetic and transcriptional features, obtained from UCSC Genome Browser, are as follows 1) The genomic region encompassing rs55705857 shows evidence of a high sequence conservation between evolutionarily-divergent species, 2) rs55705857 resides in DNaseI hypersensitivity site, detected in 3 cell-lines (one of which being hippocampal astrocyte cell line HA-h), 3) This genomic region displays H3K27ac and H3K4me1 signals, both of which distinguish active enhancers from inactive/poised enhancer elements, detected in H1-derived neuronal progenitor cells, 4) An RNA polymerase II binding site, as indicated by Pol2 ChIA-PET signal in HeLaS3 cells, overlaps the genomic region encompassing rs55705857, suggesting active-transcription, 5) This genomic region also displays a balanced short RNA transcription, characteristic of enhancer-associated RNAs (eRNAs), which is a hallmark of active enhancers. (small RNA-seq data). (c) The left panel shows the organization of luciferase assay constructs. HEK293 cells were transfected with Renilla luciferase plasmid pRL-CMV and one of three firefly luciferase plasmids: MYC promoter alone, MYC promoter plus enhancer region with rs55705857-A allele or MYC promoter plus enhancer region with rs55705857-G allele. As a control, MYC promoter was replaced with the CDX2 promoter and assayed in parallel. After 48–72 hours, luciferase expression was measured via Dual-Glo Luciferase Assay System. Average of 3 experiments are shown (errors bars indicate S.E.M). y-axis shows normalized luciferase activity in logarithmic scale. (*) Indicates a statistical significance level of p < 0.05.

References

    1. Shete S. et al. Genome-wide association study identifies five susceptibility loci for glioma. Nat Genet 41, 899–904 (2009). - PMC - PubMed
    1. Jenkins R. B. et al. Distinct germ line polymorphisms underlie glioma morphologic heterogeneity. Cancer Genet 204, 13–18 (2011). - PMC - PubMed
    1. Rajaraman P. et al. Genome-wide association study of glioma and meta-analysis. Hum Genet 131, 1877–1888 (2012). - PMC - PubMed
    1. Jenkins R. B. et al. A low-frequency variant at 8q24.21 is strongly associated with risk of oligodendroglial tumors and astrocytomas with IDH1 or IDH2 mutation. Nat Genet 44, 1122–1125 (2012). - PMC - PubMed
    1. Claus E. B. et al. Survival and low-grade glioma: the emergence of genetic information. Neurosurg Focus 38, E6 (2015). - PMC - PubMed

Publication types

MeSH terms

LinkOut - more resources