. 2016 Jun 10:6:27947.
doi: 10.1038/srep27947.

Perceived visual time depends on motor preparation and direction of hand movements

Affiliations

Perceived visual time depends on motor preparation and direction of hand movements

Alice Tomassini et al. Sci Rep. .

Abstract

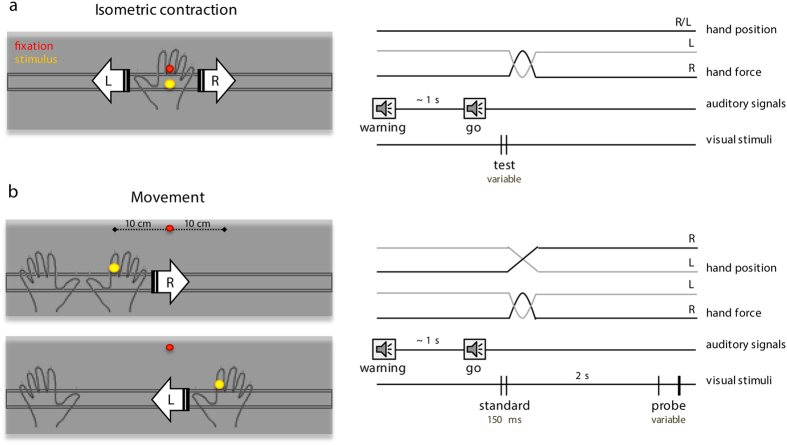
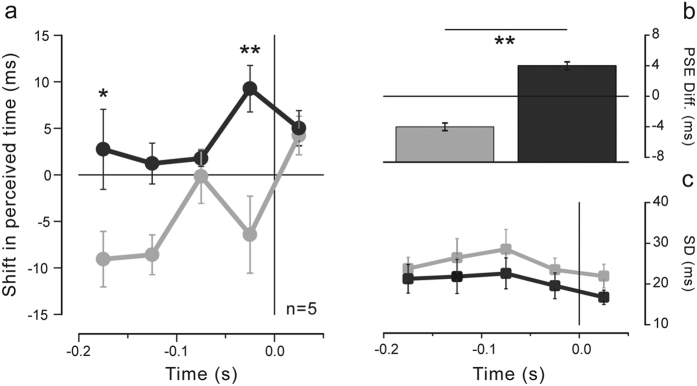
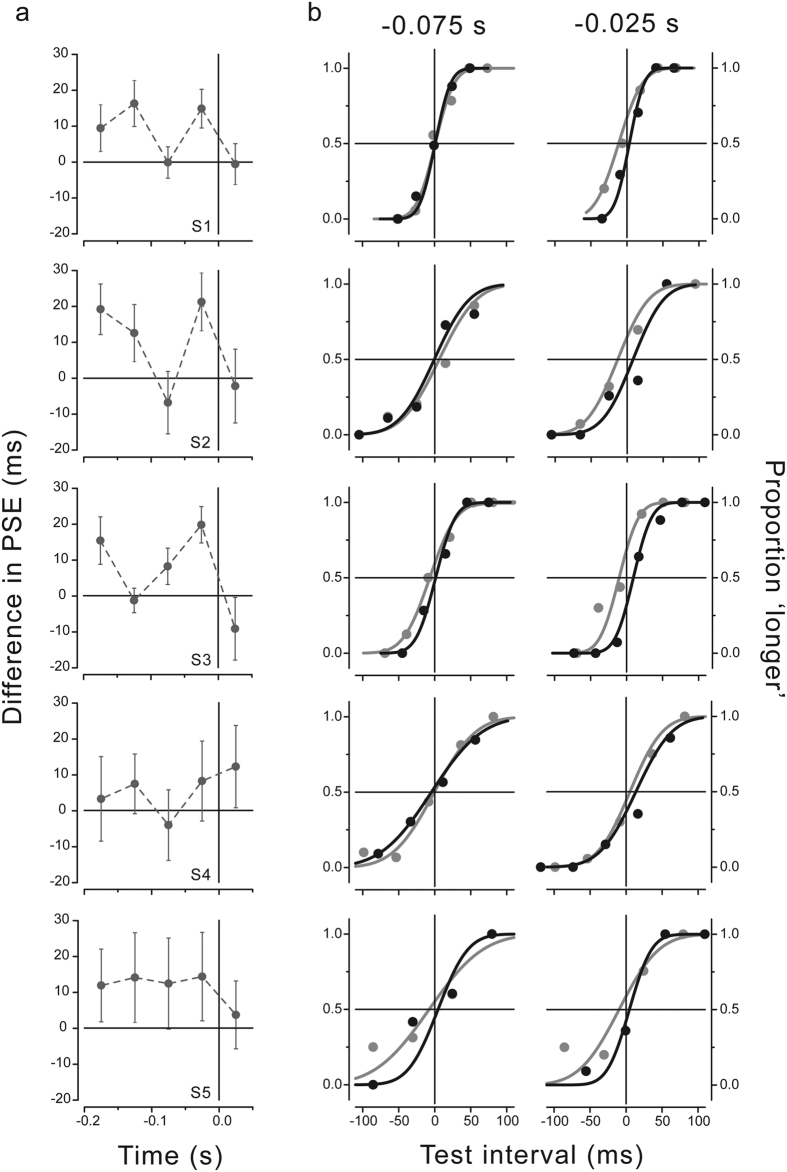
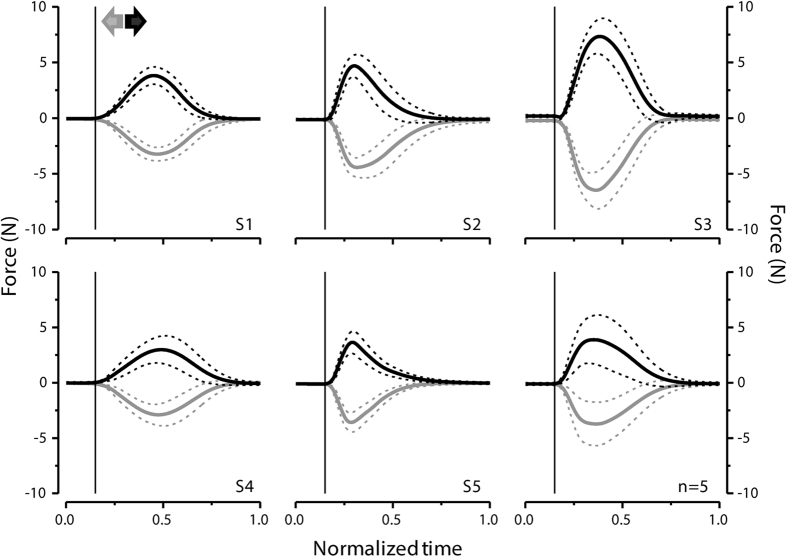
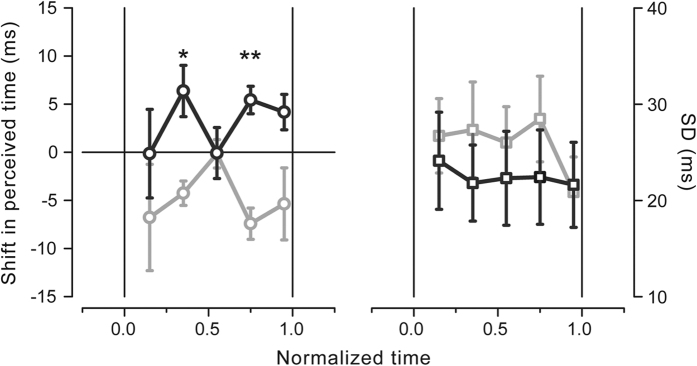
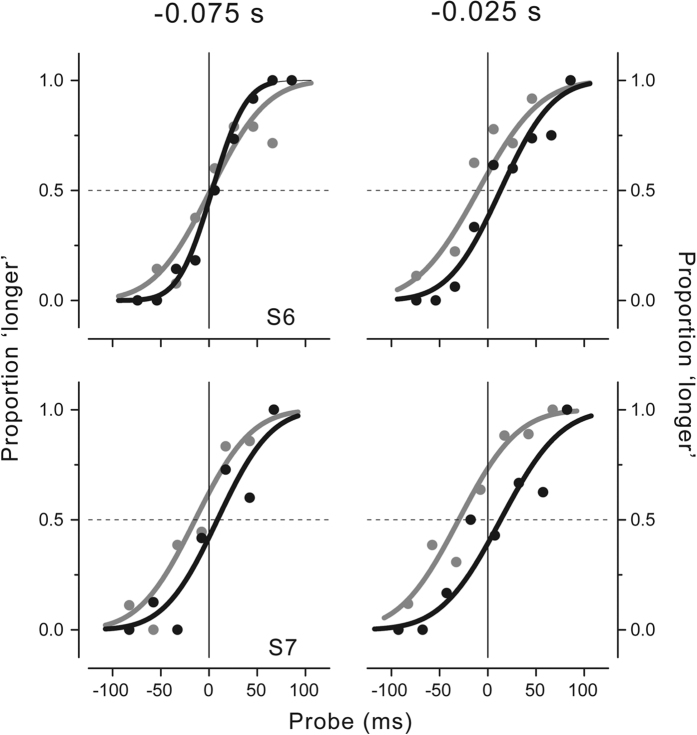
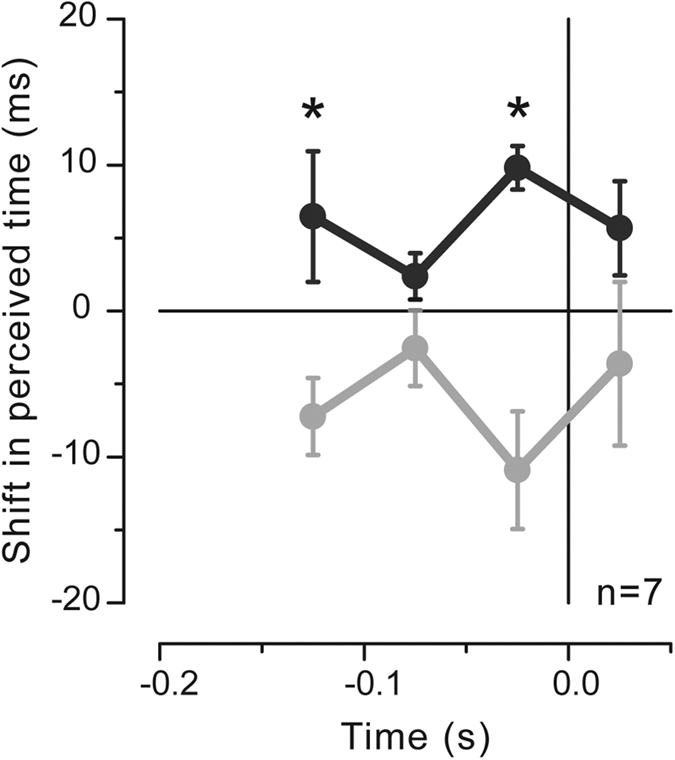
Perceived time undergoes distortions when we prepare and perform movements, showing compression and/or expansion for visual, tactile and auditory stimuli. However, the actual motor system contribution to these time distortions is far from clear. In this study we investigated visual time perception during preparation of isometric contractions and real movements of the hand in two different directions (right/left). Comparable modulations of visual event-timing are found in the isometric and in the movement condition, excluding explanations based on movement-induced sensory masking or attenuation. Most importantly, and surprisingly, visual time depends on the movement direction, being expanded for hand movements pointing away from the body and compressed in the other direction. Furthermore, the effect of movement direction is not constant, but rather undergoes non-monotonic modulations in the brief moments preceding movement initiation. Our findings indicate that time distortions are strongly linked to the motor system, and they may be unavoidable consequences of the mechanisms subserving sensory-motor integration.


Figures

Figure 1
Figure 1. Schematic illustration of the experimental setup and procedure.
(a) Isometric contraction condition. Participants kept their right hand on a hand-shaped plaster cast that was mounted on a sliding guide. Two LEDs were positioned above the hand: the red LED was the fixation point and the yellow LED delivered the visual stimuli (left panel). An auditory tone (warning signal) marked the beginning of the trial. After a variable delay, a second tone (go signal) cued participants to push their right hand either to the right or to the left direction according to previous verbal instructions. The hand plaster cast was securely blocked so that the horizontal force did not result in hand displacement. At random times with respect to the go signal, two visual flashes (5 ms) were presented marking a variable time interval– the test interval (right panel). At the end of the trial participants were asked to tell whether the test was shorter or longer compared with the standard interval of 150 ms (shown 10 times consecutively at the beginning of each block of trials). (b) Movement condition. The red fixation LED was attached on the table, above the sliding guide; the yellow LED was mounted on the right index finger. The hand plaster cast was let free to slide along the guide. Participants positioned their right hand ~10 cm to the left and ~10 cm to the right with respect to the body midline prior to executing a leftward or a rightward movement, respectively (left panel). Like in the isometric condition, two auditory tones were presented; the second tone signaled participants to move their hand ~20 cm to the right or left direction, according to previous instructions. Two time intervals were presented: the standard-150 ms-was delivered at random times with respect to the go signal; the probe, of variable duration, was delivered 2 s after the standard, when the hand was still (right panel). Participants indicated verbally at the end of the trial which of the two visual intervals was longer.
Figure 2
Figure 2
(a) Perceived time as a function of stimulus presentation time with respect to movement onset time (zero time) averaged across subjects for the right (black) and left (gray) hand force direction in the isometric contraction condition. Results are expressed as the deviation of the PSEs from the mean individual PSE (i.e., the PSE averaged across stimulus latencies and movement directions, calculated separately for each subject). Negative and positive values indicate relative underestimation and overestimation of the time interval, respectively. Asterisks represent the significance level of one-tailed post-hoc t-tests (*p < 0.05, **p < 0.01; Bonferroni-corrected for multiple comparisons). (b) Average deviation in the perceived temporal interval for the right (black) and left (gray) hand force directions. Asterisks represent the significance level of the paired-samples t-test. (c) Precision of the temporal judgments (SDs) as a function of stimulus presentation time with respect to movement onset time averaged across subjects for the right (black) and left (gray) hand force direction. Error bars represent standard errors of the means.
Figure 3
Figure 3
(a) Difference between the PSEs for the right and left hand force direction as a function of stimulus presentation time with respect to movement onset time (zero time). Results for all subjects. Error bars represent standard errors estimated by bootstrap. (b) Psychometric functions showing the proportion of trials where the test stimulus interval was judged to be longer than the standard interval in the isometric condition. Data for all subjects are shown for two critical stimulus presentation times relative to force onset (−0.075 and −0.025 s; bin size of 50 ms) for the right (black) and left (gray) movement directions. The test stimulus interval is expressed as deviation from the mean individual PSE. The vertical and horizontal lines represent no deviation from the mean perceived time.
Figure 4
Figure 4. Force profiles for the right (black) and left (gray) directions.
Forces have been aligned to force onset time and then averaged across trials for each subject (thick lines). Dashed lines represent MEANS ± 1SD. Vertical lines indicate hand force onset time. Individual and mean (n = 5; right bottom graph) force profiles are shown.
Figure 5
Figure 5. Time course of the shift in perceived time when stimulus latencies are normalized on the reaction time on a trial-by-trial basis for the right and left hand directions (results are averaged across subjects; left graph).
Time 0 represents the go signal presentation time; time 1 represents the hand force onset time. Mean precision of the temporal judgments (SDs) for the data normalized on the reaction times are shown in the right graph. Error bars represent standard errors of the mean. Asterisks represent the significance level of one-tailed post-hoc t-tests (*p < 0.05, **p < 0.01; Bonferroni-corrected for multiple comparisons).
Figure 6
Figure 6. Psychometric functions showing the proportion of trials where the probe was judged to be longer than the standard interval in the movement condition.
Data for the two tested subjects are shown for two critical stimulus presentation times relative to movement onset (−0.075 and −0.025 s; bin size of 50 ms) for the right (black) and left (gray) movement directions. The probe is expressed as deviation from the mean individual PSE (i.e., the PSE averaged across stimulus latencies and movement directions, calculated separately for each subject; S6 = 154 ± 3.5 ms, S7 = 165 ± 8.3 ms). The vertical and horizontal lines represent no deviation from the mean perceived time.
Figure 7
Figure 7. Time course of the shift in perceived time for the right (black) and left (gray) directions averaged across all tested subjects in the two different motor tasks (n = 7; isometric contraction and movement condition).
Error bars are standard errors of the mean. Asterisks represent the significance level of post-hoc t-tests (*p < 0.05, **p < 0.01; Bonferroni-corrected for multiple comparisons).

References

    1. Kanai R., Paffen C. L., Hogendoorn H. & Verstraten F. A. Time dilation in dynamic visual display. Journal of vision 6, 1421–1430, doi: 10.1167/6.12.8 (2006). - DOI - PubMed
    1. Johnston A., Arnold D. H. & Nishida S. Spatially localized distortions of event time. Current biology: CB 16, 472–479, doi: 10.1016/j.cub.2006.01.032 (2006). - DOI - PubMed
    1. Burr D. C., Cicchini G. M., Arrighi R. & Morrone M. C. Spatiotopic selectivity of adaptation-based compression of event duration. Journal of vision 11, 21; author reply 21a, doi: 10.1167/11.2.21 (2011). - DOI - PubMed
    1. Tomassini A., Gori M., Burr D., Sandini G. & Morrone M. C. Perceived duration of Visual and Tactile Stimuli Depends on Perceived Speed. Frontiers in integrative neuroscience 5, 51, doi: 10.3389/fnint.2011.00051 (2011). - DOI - PMC - PubMed
    1. Harrington D. L., Castillo G. N., Fong C. H. & Reed J. D. Neural underpinnings of distortions in the experience of time across senses. Frontiers in integrative neuroscience 5, 32, doi: 10.3389/fnint.2011.00032 (2011). - DOI - PMC - PubMed

Publication types

LinkOut - more resources