. 2016 Aug 9;7(32):51435-51449.
doi: 10.18632/oncotarget.9843.

Biguanides sensitize leukemia cells to ABT-737-induced apoptosis by inhibiting mitochondrial electron transport

Affiliations

Biguanides sensitize leukemia cells to ABT-737-induced apoptosis by inhibiting mitochondrial electron transport

Juliana Velez et al. Oncotarget. .

Abstract

Metformin displays antileukemic effects partly due to activation of AMPK and subsequent inhibition of mTOR signaling. Nevertheless, Metformin also inhibits mitochondrial electron transport at complex I in an AMPK-independent manner, Here we report that Metformin and rotenone inhibit mitochondrial electron transport and increase triglyceride levels in leukemia cell lines, suggesting impairment of fatty acid oxidation (FAO). We also report that, like other FAO inhibitors, both agents and the related biguanide, Phenformin, increase sensitivity to apoptosis induction by the bcl-2 inhibitor ABT-737 supporting the notion that electron transport antagonizes activation of the intrinsic apoptosis pathway in leukemia cells. Both biguanides and rotenone induce superoxide generation in leukemia cells, indicating that oxidative damage may sensitize toABT-737 induced apoptosis. In addition, we demonstrate that Metformin sensitizes leukemia cells to the oligomerization of Bak, suggesting that the observed synergy with ABT-737 is mediated, at least in part, by enhanced outer mitochondrial membrane permeabilization. Notably, Phenformin was at least 10-fold more potent than Metformin in abrogating electron transport and increasing sensitivity to ABT-737, suggesting that this agent may be better suited for targeting hematological malignancies. Taken together, our results suggest that inhibition of mitochondrial metabolism by Metformin or Phenformin is associated with increased leukemia cell susceptibility to induction of intrinsic apoptosis, and provide a rationale for clinical studies exploring the efficacy of combining biguanides with the orally bioavailable derivative of ABT-737, Venetoclax.

Keywords: ABT 737; leukemia; metformin; mitochondria; phenformin.


Conflict of interest statement

The authors declare that they have not conflict of interest.

Figures

Figure 1
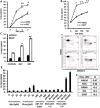
Figure 1. Metformin inhibits electron transport in leukemia cell lines
A. REH and NALM-6 cells were seeded at 2×10⁶ cells/mL in 100 μl of RPMI medium in microfuge tubes and treated with 10 mmol/L Metformin (MET), 1 μmole/L rotenone or 4 mmole/L sodium cyanide for 1 hr and processed to determine oxygen consumption as described in Materials and Methods. Untreated cells were used as controls. * = p < 0.05 compared to control. B. KBM5, OCI-AML3, NALM-6, and REH cells (2×10⁶ cells/mL in microfuge tubes) were exposed to increasing concentrations (0, 1, 5, and 10 mmol/L) of Metformin for 1 hr and oxygen consumption determined as above. IC50 values for Metformin are indicated next to each cell line. ** = p < 0.05 compared to 0 mmole/L Metformin for all lines tested. C. Three primary samples (#1, #2, and #3) were seeded in 100 μl of RPMI medium in microfuge tubes and treated with 0, 5, or 10 mmol/L Metformin for 1 h and processed to determine oxygen consumption as above. Sample #2 was stained with anti-CD34 APC prior to fixation, and results are derived from CD34-positive leukemia blasts. D. OCI-AML3 cells were treated with 4 mmole/L sodium cyanide (as a control for inhibition of oxygen consumption) or increasing micromolar concentrations of Metformin or Phenformin for 1 hr and oxygen consumption determined as above. * = p < 0.05 compared to control. The data was normalized by substracting the MFI values of OCI-AML3 cells treated with 4 mmole/L sodium cyanide.
Figure 2
Figure 2. Metformin induces accumulation of triglycerides and promotes alterations in mitochondrial phospholipid content in leukemia cell lines
A. REH and NALM-6 cells were seeded at 2×10^5 cells/mL (300 μl in 48-well plates) and treated with 10 mmol/L Metformin (MET) or 1 μmole/L rotenone for 16 hr and processed to determine neutral lipid content as described in Materials and Methods. Untreated cells were used as controls. B. KBM5, NALM-6, and REH cells (2×10^5 cells/mL in 48-well plates) were exposed to increasing concentrations (0, 1, and 10 mmol/L) of Metformin for 4 hr and accumulation of neutral lipids determined as above. C. KBM5, OCI-AML3, NALM-6, and REH cells (2×10^5 cells/mL in 48-well plates) were exposed to increasing concentrations of Metformin as above, and mitochondrial phospholipid content assessed via NAO staining as described in Materials and Methods. D. REH and NALM-6 cells (2×10^5 cells/mL in 48-well plates) were seeded as above and treated with Metformin (10 mmol/L) or rotenone (1 μmol/L) for 6 h and mitochondrial phospholipid content determined as above. * = p < 0.05 when compared to control; # = p < 0.005 when compared to control; $ = p < 0.0005 when compared to control.
Figure 3
Figure 3. Metformin promotes superoxide generation and loss of reduced glutathione (GSH) in leukemia cells
A. KBM5, REH, and OCI-AML3 cells were seeded at 2×10^5 cells/mL (300 μl in 48-well plates) and treated with Metformin (MET; 5 or 10 mmol/L) for 2 h and superoxide generation determined via DHE staining as described in Materials and Methods. B. OCI-AML3 cells were seeded at 2×10⁵ cells/mL (500 μl in 24-well plates) and treated with increasing micromolar concentrations of Metformin or Phenformin for 2 h and superoxide generation determined via DHE staining as above. C. REH and NALM-6 cells (2×10⁵ cells/mL in 48-well plates) were exposed to 10 mmol/L Metformin (MET) or 1 μmole/L rotenone for 2 h and superoxide generation assessed as above. D. REH and NALM-6 cells (2×10⁵ cells/mL in 48-well plates) were exposed to increasing concentrations (0, 1, 5, and 10 mmol/L) of Metformin for 2 h and GSH levels determined by flow cytometry as described in Materials and Methods. * = p < 0.05 when compared to control; ** = p < 0.005 when compared to control.
Figure 4
Figure 4. Metformin and rotenone potentiate the cytotoxic effects of the bcl-2 inhibitor ABT-737
A. KBM5 cells (2×10^5 cells/mL in 48-well plates) were exposed to increasing concentrations of ABT-737 (0, 2, 4, and 6 μmol/L), alone or in the presence of 10 mmol/L Metformin for 16 h and % cell death was determined via TMRM staining as described in Materials and Methods. B. REH cells (2×10^5 cells/mL in 48-well plates) were exposed to increasing concentrations of ABT-737 (0, 250, 500, and 750 nmol/L), alone or in the presence of 10 mmol/L Metformin for 16 h and % cell death was determined as above. C. REH cells seeded as above were treated with 250 nmol/L ABT-737, alone or in the presence of 10 mmol/L Metformin or 1 μmol/L rotenone for 16 h and cell death was determined as above. D. KBM5 cells (2×10⁵ cells/mL in 48-well plates) were exposed to 750 nmol/L ABT-737, alone or in the presence of 15 mmol/L Metformin and Annexin staining was quantitated as described in Materials and Methods. E. OCI-AML3 cells were seeded at 2×10⁵ cells/mL (500 μl in 24-well plates) and treated with increasing micromolar concentrations of Metformin or Phenformin, ABT-737, or combinations of biguanides and ABT-737 in an isobologram design. Viable cells were determined by propidium iodide staining and flow cytometry as described in Materials and Methods. * = p < 0.05 when compared to ABT-737 alone; ** = p < 0.005 when compared to ABT-737 alone. F. Leukemia cells (2×10⁵ cells/mL in 48-well plates) were treated with Metformin (5, 10, or 15 mmol/L) or ABT-737 (250, 500, 750 nmol/L for REH and KBM5; 1, 2, 3 μmol/L for OCI-AML3; 1, 2, 3 μmol/L for NALM-6; and 250, 500, and 750 nmole/L for U937), and the fixed ratio combinations of Metformin + ABT-737 for 16 h and cell death was determined as described in Materials and Methods. Isobologram analysis and CI were determined using Calcusyn version 2.1. Averaged CI values are shown for each cell line.
Figure 5
Figure 5. Metformin overcomes the protective effects of bone marrow derived MSC
A. KBM5, REH, OCI AML3, U937 (0.2×10^6 cells/ml) were seeded in T25 flasks and treated or not with Metformin (10 mM) for 16 hrs. After incubation, the cells were counted and lysed to perform immunoblot detection of Bcl-2 and Mcl-1 proteins. B. KBM5 cells were cultured alone (2×10^5 cells/mL in 300 μl in 48-well plates), or on a feeder layer of 1×10^4 bone marrow derived MSC, and exposed to 4 μmol/L ABT-737 +/− 10 mmol/L Metformin or 1 μmol/L rotenone. Cells were incubated for 16 h and % cell death was determined as described in the Materials and Methods in the CD90 (−) compartment. C. REH cells were cultured alone (2×10⁵ cells/mL in 300 μl in 48-well plates), or on a feeder layer of 1×10⁴ bone marrow derived MSC, and exposed to 500 nmol/L ABT-737 +/− of 10 mmol/L Metformin. % cell death was determined as above. * = p < 0.05 when compared to cells cultured alone; # = p < 0.05 when compared to ABT-737 alone in coculture. D. REH and NALM-6 cells (2×10^5 cells/mL in 48-well plates) were cultured in RPMI or RPMI supplemented with 200 μmol/L palmitoleate (PO), and treated with ABT-737 (500 nmol/L for REH and 4 μmol/L for NALM-6) for 16 h and cell death determined by flow cytometry as described in Materials and Methods. * = p < 0.01 when compared to RPMI without PO. E. OCI-AML3 cells (2×10^5 cells/mL in 48-well plates) were treated with 250 nmol/L ABT-737, +/− 200 μmol/L ethacrynic acid (EA) or 2 mmol/L diethylmaleate (DEM) for 16 h and apoptosis was determined by Annexin V staining as described in Materials and Methods. $ = p < 0.0005 when compared to ABT-737 alone. F. U937 cells were seeded at 2×10⁵ cells/mL (15 mls in T-75 culture flasks) and treated with 500 nmol/L ABT-737 in the presence or absence of 10 mmol/L Metformin for 4 h. Bak crosslinking was determined as described in Materials and Methods.
Figure 6
Figure 6. Metformin and Phenformin potentiate the cytotoxicity of ABT-737 in primary leukemia CD34 (+) cells
A. and B. Two AML primary samples were exposed to increasing concentrations of Metformin, ABT-737, or a combination of each agent using a 1:1 fixed dose increase schedule. Apoptosis was monitored quantitated by flow cytometry, gating on CD34 (+) cells as described in Materials and Methods. C. Summary of CI values (10 samples) and patient characteristics for the primary leukemia samples used in this study. Acute lymphoblastic leukemia samples were analyzed by gating on leukemic blasts by FSC/SSC. D. Two primary AML samples were exposed to micromolar concentrations (50 μmoles/L) of Metformin or Phenformin, +/− 50 nmoles/L ABT-737 for 24 h and apoptosis quantitated by flow cytometry as above. * = p<0.05 from ABT-737 alone. E. 3 primary AML samples were exposed to 20 μmoles/L Phenformin, +/− 20 nmles/L ABT-737, and apoptosis determined by flow cytometry, gating on CD34 (+) cells as in A and B. * = p<0.05 from ABT-737 alone. F. Left – untreated leukemia cell; Right – biguanides inhibit electron transport leading to the accumulation of citrate which may promote de novo phospholipid/cardiolipin synthesis and changes to the topology of the inner mitochondrial membrane (represented by the thicker grey line). These changes potentiate the permeabilization of the outer mitochondrial membrane (represented by the dotted line) and release of apoptogenic factors induced by ABT-737.

Similar articles

Cited by

References

    1. Ofran Y, Rowe JM. Treatment for relapsed acute myeloid leukemia: what is new? Curr Opin Hematol. 2012;19:89–94. - PubMed
    1. Narayanan S, Shami PJ. Treatment of acute lymphoblastic leukemia in adults. Crit Rev Oncol Hematol. 2012;81:94–102. - PubMed
    1. Konopleva M, Andreeff M. Targeting the leukemia microenvironment. Curr Drug Targets. 2007;8:685–701. - PubMed
    1. Tabe Y, Konopleva M, Igari J, Andreeff M. Spontaneous migration of acute promyelocytic leukemia cells beneath cultured bone marrow adipocytes with matched expression of the major histocompatibility complex. Rinsho Byori. 2004;52:642–648. - PubMed
    1. Ishikawa F, Yoshida S, Saito Y, Hijikata A, Kitamura H, Tanaka S, Nakamura R, Tanaka T, Tomiyama H, Saito N, Fukata M, Miyamoto T, Lyons B, Ohshima K, Uchida N, Taniguchi S, et al. Chemotherapy-resistant human AML stem cells home to and engraft within the bone-marrow endosteal region. Nat Biotechnol. 2007;25:1315–1321. - PubMed