

Detailed Characterization of Human Induced Pluripotent Stem Cells Manufactured for Therapeutic Applications
- PMID: 27283945
- PMCID: PMC4919381
- DOI: 10.1007/s12015-016-9662-8
Detailed Characterization of Human Induced Pluripotent Stem Cells Manufactured for Therapeutic Applications
Abstract
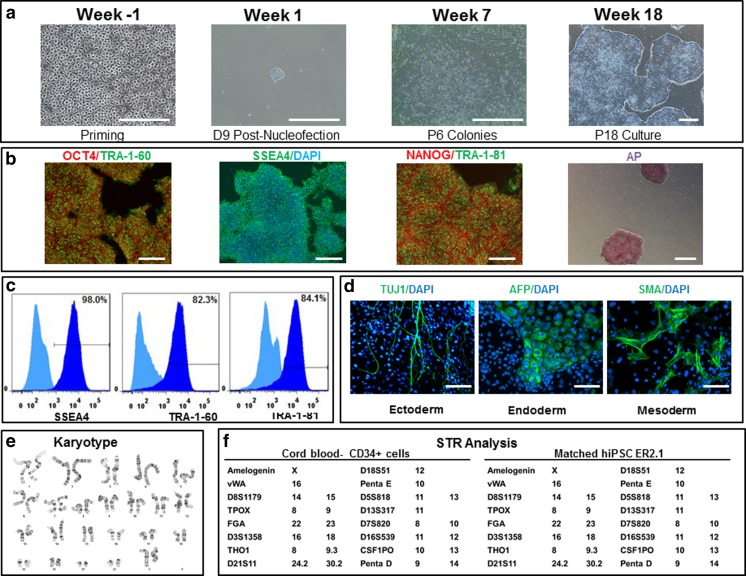
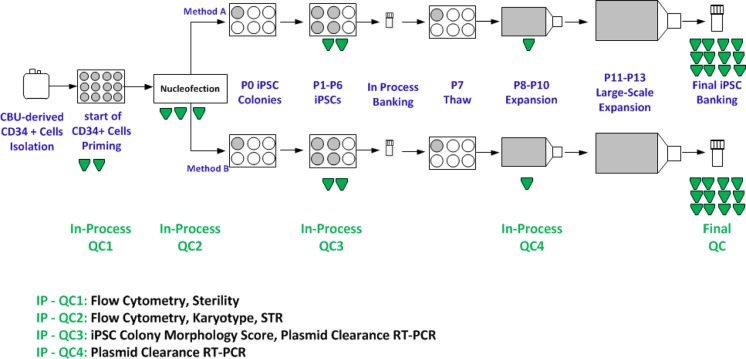
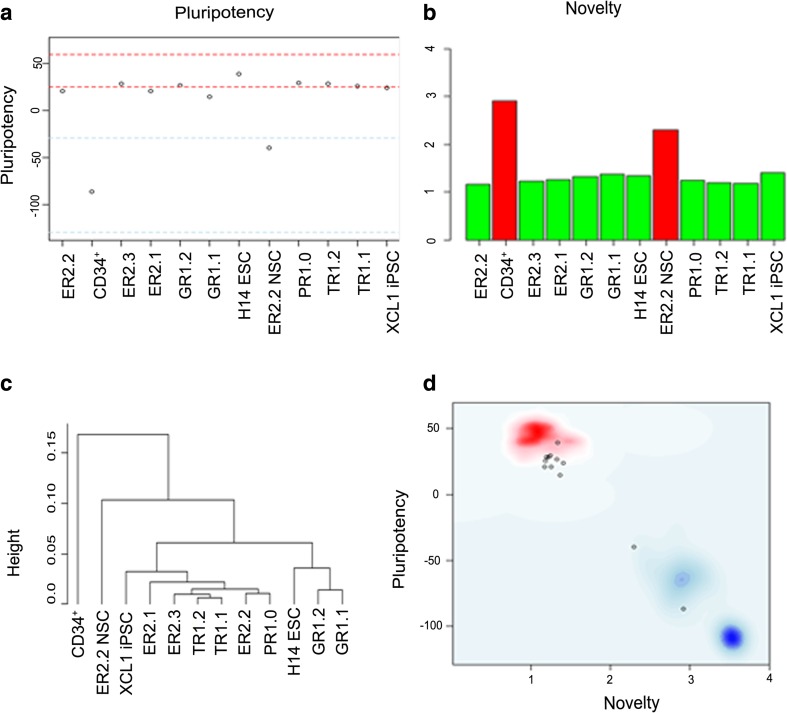
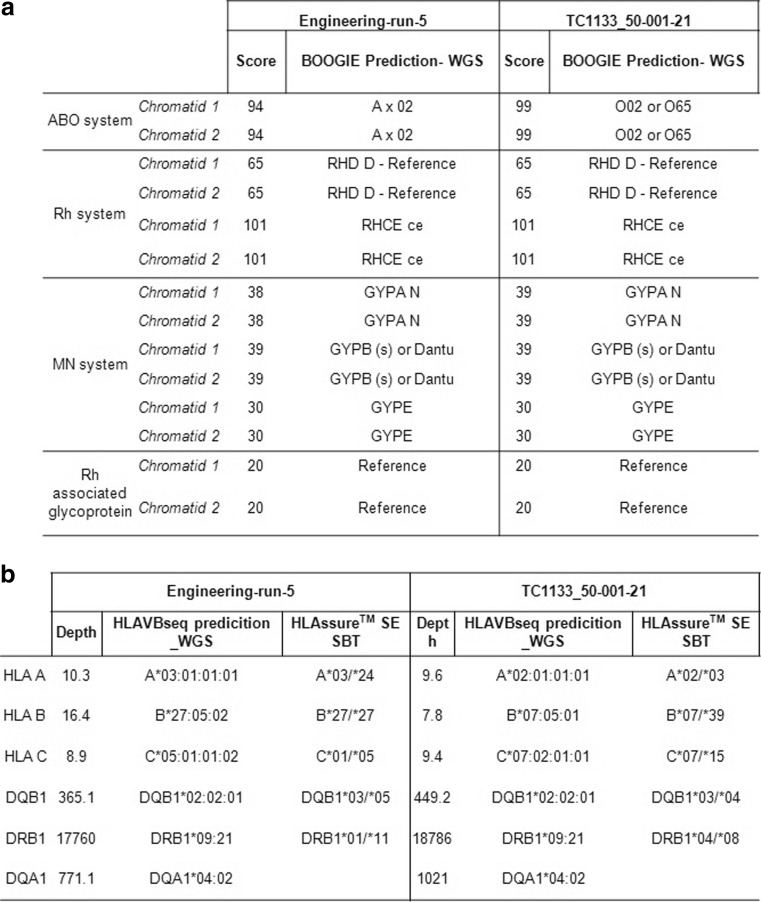
We have recently described manufacturing of human induced pluripotent stem cells (iPSC) master cell banks (MCB) generated by a clinically compliant process using cord blood as a starting material (Baghbaderani et al. in Stem Cell Reports, 5(4), 647-659, 2015). In this manuscript, we describe the detailed characterization of the two iPSC clones generated using this process, including whole genome sequencing (WGS), microarray, and comparative genomic hybridization (aCGH) single nucleotide polymorphism (SNP) analysis. We compare their profiles with a proposed calibration material and with a reporter subclone and lines made by a similar process from different donors. We believe that iPSCs are likely to be used to make multiple clinical products. We further believe that the lines used as input material will be used at different sites and, given their immortal status, will be used for many years or even decades. Therefore, it will be important to develop assays to monitor the state of the cells and their drift in culture. We suggest that a detailed characterization of the initial status of the cells, a comparison with some calibration material and the development of reporter sublcones will help determine which set of tests will be most useful in monitoring the cells and establishing criteria for discarding a line.
Keywords: Consent; Embryonic stem cells; Induced pluripotent stem cells; Manufacturing; Markers; cGMP.
Figures

Similar articles
-
Array-comparative genomic hybridization characterization of human pluripotent stem cells.Methods Mol Biol. 2012;873:261-7. doi: 10.1007/978-1-61779-794-1_17. Methods Mol Biol. 2012. PMID: 22528361
-
Primed pluripotent cell lines derived from various embryonic origins and somatic cells in pig.PLoS One. 2013;8(1):e52481. doi: 10.1371/journal.pone.0052481. Epub 2013 Jan 11. PLoS One. 2013. PMID: 23326334 Free PMC article.
-
Rapid and Efficient Generation of Transgene-Free iPSC from a Small Volume of Cryopreserved Blood.Stem Cell Rev Rep. 2015 Aug;11(4):652-65. doi: 10.1007/s12015-015-9586-8. Stem Cell Rev Rep. 2015. PMID: 25951995 Free PMC article.
-
Reverse engineering human neurodegenerative disease using pluripotent stem cell technology.Brain Res. 2016 May 1;1638(Pt A):30-41. doi: 10.1016/j.brainres.2015.09.023. Epub 2015 Sep 28. Brain Res. 2016. PMID: 26423934 Free PMC article. Review.
-
Evolution of induced pluripotent stem cell technology.Curr Opin Hematol. 2010 Jul;17(4):276-80. doi: 10.1097/MOH.0b013e328339f2ee. Curr Opin Hematol. 2010. PMID: 20442654 Review.
Cited by
-
Induced pluripotency in the context of stem cell expansion bioprocess development, optimization, and manufacturing: a roadmap to the clinic.NPJ Regen Med. 2021 Nov 1;6(1):72. doi: 10.1038/s41536-021-00183-7. NPJ Regen Med. 2021. PMID: 34725374 Free PMC article. Review.
-
Modeling Cardiovascular Diseases with hiPSC-Derived Cardiomyocytes in 2D and 3D Cultures.Int J Mol Sci. 2020 May 11;21(9):3404. doi: 10.3390/ijms21093404. Int J Mol Sci. 2020. PMID: 32403456 Free PMC article. Review.
-
Addressing Manufacturing Challenges for Commercialization of iPSC-Based Therapies.Methods Mol Biol. 2021;2286:179-198. doi: 10.1007/7651_2020_288. Methods Mol Biol. 2021. PMID: 32430594 Review.
-
Manufacturing clinical-grade human induced pluripotent stem cell-derived beta cells for diabetes treatment.Cell Prolif. 2022 Aug;55(8):e13232. doi: 10.1111/cpr.13232. Epub 2022 Apr 26. Cell Prolif. 2022. PMID: 35474596 Free PMC article. Review.
-
Transplantation of retinal pigment epithelium and photoreceptors generated concomitantly via small molecule-mediated differentiation rescues visual function in rodent models of retinal degeneration.Stem Cell Res Ther. 2021 Jan 19;12(1):70. doi: 10.1186/s13287-021-02134-x. Stem Cell Res Ther. 2021. PMID: 33468244 Free PMC article.
References
-
- Thomson JA, Itskovitz-Eldor J, Shapiro SS, et al. Embryonic stem cell lines derived from human blastocysts. Science. 1998;282(5391):1145–7. - PubMed
-
- Takahashi K, Tanabe K, Ohnuki M, et al. Induction of pluripotent stem cells from adult human fibroblasts by defined factors. Cell. 2007;131(5):861–72. - PubMed
Publication types
MeSH terms
Substances
Grants and funding
LinkOut - more resources
Full Text Sources
Other Literature Sources
Research Materials
