. 2016 Jul 12;7(28):44505-44521.
doi: 10.18632/oncotarget.9887.

Synergy between histone deacetylase inhibitors and DNA-damaging agents is mediated by histone deacetylase 2 in colorectal cancer

Affiliations

Synergy between histone deacetylase inhibitors and DNA-damaging agents is mediated by histone deacetylase 2 in colorectal cancer

Samer Alzoubi et al. Oncotarget. .

Abstract

Previous studies have associated the overexpression of histone deacetylase 2 (HDAC2) and the presence of TP53 mutations with the progression to advanced stage drug resistant colorectal cancer (CRC). However, the mechanistic link between HDAC2 expression and the TP53 mutational status has remained unexplored. Here, we investigated the function of HDAC2 in drug resistance by assessing the synergistic effects of DNA-targeted chemotherapeutic agents and HDAC inhibitors (HDACis) on two TP53-mutated colorectal adenocarcinoma CRC cell lines (SW480 and HT-29) and on the TP53-wild type carcinoma cell line (HCT116 p53+/+) and its TP53 deficient sub-line (HCT116 p53-/-). We showed that in the untreated SW480 and HT-29 cells the steady-state level of HDAC2 was low compared to a TP53-wild type carcinoma cell line (HCT116 p53+/+). Increased expression of HDAC2 correlated with drug resistance, and depletion by shRNA sensitised the multi-drug resistance cell line HT-29 to CRC chemotherapeutic drugs such as 5-fluorouracil (5-FU) and oxaliplatin (Oxa). Combined treatment with the HDACi suberoylanilide hydroxamic acid plus 5-FU or Oxa reduced the level of HDAC2 expression, modified chromatin structure and induced mitotic cell death in HT-29 cells. Non-invasive bioluminescence imaging revealed significant reductions in xenograft tumour growth with HDAC2 expression level reduced to <50% in treated animals. Elevated levels of histone acetylation on residues H3K9, H4K12 and H4K16 were also found to be associated with resistance to VPA/Dox or SAHA/Dox treatment. Our results suggest that HDAC2 expression rather than the p53 mutation status influences the outcome of combined treatment with a HDACi and DNA-damaging agents in CRC.

Keywords: HDAC2; colorectal cancer; drug resistance and in vivo imaging; histone acetylation; p53.


Conflict of interest statement

The authors declare no conflicts of interest.

Figures

Figure 1
Figure 1. Characterization of WT, null, and mutated P53 CRC cell lines response to DNA damaging agents
A. HCT116 P53+/+ cells were treated with dose-increase of Dox for 24hr and checked for PARP cleavage, also activation and stabilization of P53 were analyzed by western blotting. B. Comparison of PARP cleavage upon Dox 1μM between HCT116 P53+/+ and HCT116 P53−/−. C. Assessment of PARP cleavage in SW480 and HT-29cells lines upon a dose-increase of Dox. D. HCT116 P53+/+, HCT116 P53−/−, and HT-29 cells were treated with 1μM Dox and proteins cell lysate were separated using SDS-PAGE and detected by WB analysis. Quantification of PARP cleavage detected by western blotting was performed by ImageJ software and based on the ratios of normalized cleaved PARP by βactin and normalized uncleaved PARP. (Fold changes are the average of three independent of three independent experiments (n=3)). E. HCT116 P53+/+ cells, HCT116 P53−/− and HT-29 cells were treated with chemotherapeutic drugs for 24hr. Cells were lysed and the proteins separated using SDS-PAGE and detected by WB analysis. The cleavage of PARP was assessed using the appropriate antibodies. F. HT-29 cell death investigated by propidium iodide (PI) staining and flow cytometry analysis (mean ± S.E.M. of three independent experiments (n=3)), the cell death following treatments with (5-FU and Oxa) were not significant in comparison with the control (P=0.55), and this supports the results western blot for these treatments (no PARPc). In all the western blotting experiments βactin was used as a loading control.
Figure 2
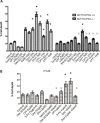
Figure 2. Combined treatment with distinct HDAC inhibitors and DNA damaging agents induces different levels of sensitivity in CRC cells
A. HCT116 p53+/+, HCT116 p53−/− cells were treated with a single treatment of Dox (0.5μM) and Camptothecin-11 (CPT-11) (5μM) or combined treatment with VPA (1 mM), SAHA (0.5μM), and sodium butyrate (NaB) (1 mM) for 24 h and then cells were prepared for the cell death analysis by flow cytometry using Propidium iodide (PI) staining. We calculated the combination index (CI) according to the Chou-Talalay method using Calculsyn software (Biosoft, Cambridge, UK). Chou-Talalay method for drug combination was based on the median-effect to defined synergy and antagonism [38]. This method offered synergistic (CI < 1), and antagonistic effect (CI > 1) in drug combinations. Error bars represent ± S.E.M of three independent experiments (n=3). B. HT-29 cell death analysis by flow cytometry after 24 hours treatment with (Dox, CPT, 5FU), SAHA or their combination. Cells were harvested and stained with Propidium iodide (PI) to determine cell death using FACS analysis. * denotes a synergistic effect and X denotes an antagonistic effect. Error bars represent ± S.E.M of three independent experiments (n=3).
Figure 3
Figure 3. Early effects of Dox combined to SAHA or VPA on CRC cell lines
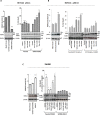
A and B. HCT116 and HT-29 cells were treated for 24 hr treatment with dose-increase of Dox, Oxa or 5-FU. Cells were lysed and the proteins separated using SDS-PAGE and detected by WB analysis. The cleavage of PARP (PARPc) and the protein level of HDAC2 were assessed and quantified using the appropriate antibodies. Actin was used as a loading control. C. The four cell lines (HCT116 p53+/+, HCT116 p53−/−, SW480, and HT-29) were treated for 6 hours with Dox, VPA or SAHA only or as a combined treatment. Cells were lysed and the proteins separated using SDS-PAGE and detected by WB analysis. The PARPc and the protein level of HDAC2 were assessed using the appropriate antibodies. Actin was used as a loading control. D. Four cell lines were treated with Dox either singly or combined with SAHA or VPA for 6 hours and cells were lysed and the proteins separated using SDS-PAGE and detected by WB analysis. HDAC2 protein levels were assessed using the appropriate antibodies and quantified using ImageJ software. E. Total RNA was extracted from HCT116 p53+/+ and HT-29 cells and HDAC2 mRNA expression level was measured by quantitative RT-PCR using the primer: forward primer (5′-3′) GT GAG ATT CCC AAT GAG TTG C. reverse primer (5′-3′) GGT AAC ATG CGC AAA TTT TCA A. Error bars represent ± S.E.M.; n=3 independent experiments. Test, t-test, * for p<.005, ** for p<.001, and *** for p<.0001.
Figure 4
Figure 4. Characterisation of HDAC2 expression levels in distinct CRC cell lines and its relationship with P53 and resistance to HDACis combined with DNA damaging agent doxorubicin
A. HCT116 p53+/+, null p53, SW480 and HT-29 cells were treated with Dox either singly or combined with SAHA or VPA for 24 hours. Cells were lysed and the proteins separated using SDS-PAGE and detected by WB analysis. The cleavage of PARP, a hallmark of apoptosis and the protein level of HDAC1 and HDAC2 were assessed using the appropriate antibodies. Actin was used as a loading control. B. Four cell lines were treated with Dox either singly or combined with SAHA or VPA for 24 hours and cells were lysed and the proteins separated using SDS-PAGE and detected by WB analysis. HDAC2 protein levels were assessed using the appropriate antibodies and quantified using ImageJ software. C and D. P53 expression vectors were transiently transfected into HT-29 cells and HT29-ShRNA-HDAC2 cells, The cells were treated with Oxa (10μM) for 24 hours. Cells were lysed and the proteins separated using SDS-PAGE and detected by WB analysis. The PARPc and the protein level of p53 were assessed using the appropriate antibodies. Actin was used as a loading control. D) P53 transfected cells were also analyzed for cell death using PI staining and FACS analysis. Cells treated with SAHA+ Oxa or illuminated by UV-C (50 mJ/m2) were used as positive controls. Error bars represent ± S.E.M. of three independent experiments (n=3) and statistical significance is depicted by (*) for p<0.05 calculated by a two-tailed Student's T test compared to the control group.
Figure 5
Figure 5. TP53 mutations (S15A, K120R, K373R and K381R) sensitise HT-29 to Dox treatment
A. Overexpression of mutations (S15A, K120R, K305R K320R, K372R K373R, and K381Rand K382R) in null P53 HCT-116 cells. All p53 mutants' cells were treated with 0.5μM Dox and cleavage of PARP was detected by WB. B. Cell death analysis by flow cytometry. Stable clone HCT116 p53−/− cells were treated with 0.5μM Dox for 24 hours and cell death was assayed by incubating live cells with propidium iodide. C. Stable HT-29 cell line was generated from selected mutants (S15A, K120R, K373R and K381R). Cell death analysis was assessed by FACS after 0.5 μM Dox treatment for 24 hours and propidium iodide staining. Error bars represent ± S.E.M.; n=3 independent experiments. Test, t-test, * for p<.005, ** for p<.001.
Figure 6
Figure 6. Modulation of HDAC2 expression level by depletion or overexpression directly influences the effect of Dox as single or combined to HDACis in CRC cells
A. Stable ShRNA-HDAC2 HCT116 p53−/− cells were generated by using lentiviral vector and HDAC2 downregulation was confirmed by WB. Actin was used a loading control. Cells were exposed for 24hr to Dox as single treatment or combined with VPA. Protein cell lysates were separated by SDS-PAGE and detected by WB analysis. The PARPc protein level was assessed using the appropriate antibodies. Actin was used as a loading control. Cells were also harvested and stained by PI to determine cell death using FACS analysis. Error bars represent ± S.E.M. of three independent experiments (n=3) and statistical significance is depicted by * for p<0.05 calculated by a two-tailed Student's T test compared to the control group. B and C. HCT16 p53+/+ and SW480 cell lines were transfected with HDAC2 vector. After 24 hours post-transfection, cells were lysed and the proteins separated using SDS-PAGE. The overexpression of HDAC2 level was detected by WB and quantified using ImageJ densitometry software. HCT16 p53+/+ and SW480 cells transiently transfected with HDAC2 vector were treated with Dox only or combined with VPA or SAHA. After 24 hours, cells were lysed and the proteins separated using SDS-PAGE. The PARPc was analyzed by WB and cell death was quantified by FACS after PI staining. Error bars represent ± S.E.M. of three independent experiments (n=3) and statistical significance is depicted by * for p<0.05 calculated by a two-tailed Student's T test compared to the control group.
Figure 7
Figure 7. HDAC2 controls the chromatin plasticity and its depletion enhances mitotic cell death in drug resistant HT-29 cells upon 5-FU and Oxa treatments
A. PARPc measurement in HT-29 treated by 5-FU and Oxa combined with SAHA. After 24 hours, cells were lysed and the proteins separated using SDS-PAGE. B and C. HT-29 cell lines were treated by 5-FU or Oxa alone or combined with SAHA. After 24 hours, Cells were fixed 4% paraformaldehyde, subsequently DNA was stained with DAPI (0.1 μg/ml; Sigma-Aldrich) and the number of apoptotic cells was measured quantitatively by assessing the percentage of cells with fragmented or condensed nuclei. Mitotic cell death (MCD) was quantified by using phosphorylated histone 3 (ser10) as a mitotic cell marker. C) Representative image of mitotic cell death (MCD) in HT-29 upon SAHA + Oxa combined treatment. D. HT-29 or shRNA-HDAC2 HT-29 cells lines were treated with 5-FU or Oxa only or in combination with SAHA. After 24 hours, cells were lysed and the proteins separated using SDS-PAGE. The PARPc and the protein level of HDAC2 were analyzed by WB. Actin was used as a loading control. E. HT-29 cell lines or shRNA-HDAC2 HT-29 cells lines were treated by 5-FU, Oxa or SAHA. After 24 hours, mitotic cell death (MCD) was quantified by using phosphorylated histone 3 (ser10) as a mitotic cell marker. F. HT-29 cell lines were treated by Oxa alone or combined with SAHA and shRNA-HDAC2 HT-29 cells were treated with Oxa. After 24 hours, cells were fixed and HDAC2 protein was detected after immunofluorescence staining. Nucleus was counterstained using DAPI staining. + z-Stack shows nuclear deformation. G. MNase accessibility assay was used to study relaxed chromatin which has higher accessibility to micrococal nuclease enzyme (MNase). Cells HT-29 cells were treated with Oxa or SAHA alone or combined for 24hr and chromatin was extracted and incubated with 0.06U of MNase and fragmented DNA was separated by gel agarose, the arrow represent the undigested DNA. For all the experiments error bars represent ± S.E.M. of three independent experiments (n=3) and statistical significance is depicted by * for p<0.05 calculated by a two-tailed Student's T test compared to the control group. Actin was used as a loading control.
Figure 8
Figure 8. In vivo imaging and validation of the effect of combined treatment by liposome-encapsulated SAHA/Dox in xenograft mice
A-B. HCT116 p53+/+ or HCT116 p53−/− expressing sable luciferase-reporter were transplanted intraperitoneally in male BALB/c nude/nude mice. Liposomal SAHA/Dox-was used to treat HCT116 p53+/+ (n=4) or HCT116 p53−/− (n=4) xenograft mice groups compared to each control groups (n=4). Tumor size manually measured with calipers every three days and bioluminescence imaging measurement every week. Error bars indicate ± SEM (n = 4 replicates). *P <0.005; two-tailed t-test, Imaging was performed by using LICOR. Quantitation of luciferase intensity (error bars indicate ± SEM; n = 4 replicates). P < 0.005, two-tailed t-test). C. Protein levels of HDAC2 and survivin in control and treated tumour xenografts of HCT116 P53+/+ were analyzed by immunohistochemistry (HDAC2 expression was found in the nuclei of all control cells and in <50% of treated tumour cells). D. Protein levels of HDAC2, survivin, and P53 in normal human liver tissue and liver metastasis of CRC. All antigens were strongly expressed in CRC in contrast to absent or significantly less abundant in normal liver cells. Imaging was performed by using LICOR. (Right) Quantitation of luciferase intensity (error bars indicate ± SEM; P < 0.005, two-tailed t test, n = 4 replicates).
Figure 9
Figure 9. Dox/SAHA combination decreases drastically survivin protein level in HCT 116 p53+/+, HCT116 p53−/− and SW480 but not HT-29 cell lines
Four cell lines (HCT 116 p53+/+, HCT116 p53−/− SW480 and HT-29) were treated with Dox, VPA, SAHA or different combinations of these drugs for 24hours. Cells were lysed and the proteins separated using SDS-PAGE and detected by WB analysis. The protein level of Survivin and p53 were assessed using the appropriate antibodies. Actin was used as a loading control.
Figure 10
Figure 10. Dox combined with SAHA or VPA triggers induces histone hypo-acetylation
A. Histones were extracted by acid from the four cell lines (HCT 116 p53+/+, HCT116 p53−/− SW480 and HT-29) after exposure to Dox, VPA, SAHA or different combinations of these drugs for 24hours, also the cells were treated with 1μM. Extracted histones were separated using SDS-PAGE and detected by WB analysis. Histone acetylation levels at residues H3K9 and H4 (K12 and K16) were assessed using the appropriate antibodies. Total H3 and H4 protein levels were used as loading control. B. Quantifications of acetylated H3K9, H4K16, H4K12 residues in HCT116 P53+/+, SW480, HCT116 P53+/+, and HT-29 was measured by ImageJ software. Cells were treated only with Dox, VPA or SAHA or by different combinations of these drugs. The changes are presented as fold change in comparison to the control. Error bars represent ± S.E.M.; n=3 independent experiments. One-way ANOVA, Dunnett post-test, P =0.0001.

Similar articles

Cited by

References

    1. Sarkar S, Horn G, Moulton K, Oza A, Byler S, Kokolus S, Longacre M. Cancer development, progression, and therapy: an epigenetic overview. Int J Mol Sci. 2013;14:21087–113. - PMC - PubMed
    1. Hajji N, Wallenborg K, Vlachos P, Fullgrabe J, Hermanson O, Joseph B. Opposing effects of hMOF and SIRT1 on H4K16 acetylation and the sensitivity to the topoisomerase II inhibitor etoposide. Oncogene. 2010;29:2192–204. - PubMed
    1. Moss TJ, Wallrath LL. Connections between epigenetic gene silencing and human disease. Mutat Res. 2007;618:163–74. - PMC - PubMed
    1. Rajendran P, Ho E, Williams DE, Dashwood RH. Dietary phytochemicals, HDAC inhibition, and DNA damage/repair defects in cancer cells. Clin Epigenetics. 2011;3:4. - PMC - PubMed
    1. WHO www.who.int/gho/ncd/mortality_morbidity/cancer_text/en/

MeSH terms