. 2016 Apr;3(2):023505.
doi: 10.1117/1.JMI.3.2.023505. Epub 2016 Jun 1.

Improving pulse detection in multibin photon-counting detectors

Affiliations

Improving pulse detection in multibin photon-counting detectors

Scott S Hsieh et al. J Med Imaging (Bellingham). 2016 Apr.

Abstract

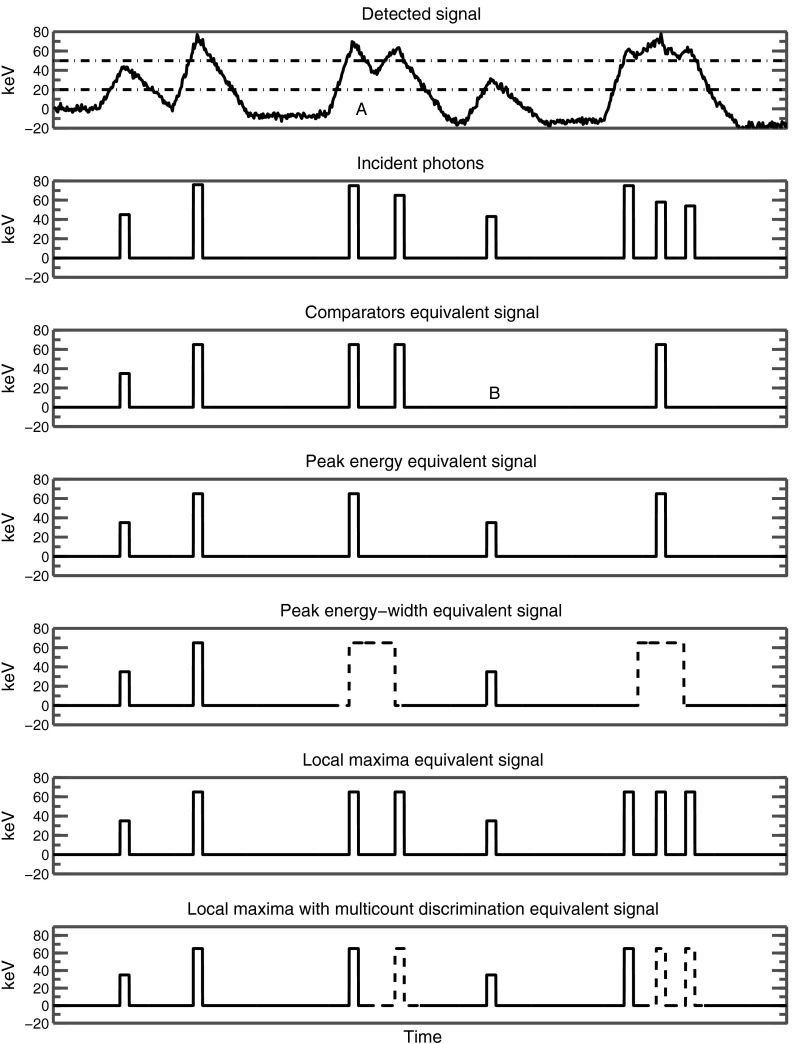
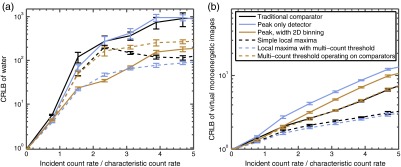
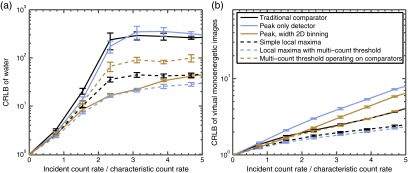
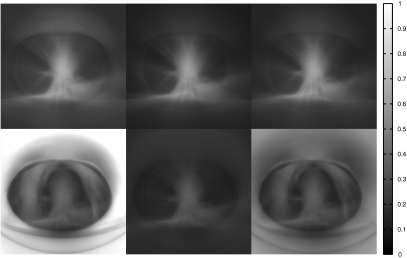
Energy-discriminating, photon-counting (EDPC) detectors are attractive for their potential for improved detective quantum efficiency and for their spectral imaging capabilities. However, at high count rates, counts are lost, the detected spectrum is distorted, and the advantages of EDPC detectors disappear. Existing EDPC detectors identify counts by analyzing the signal with a bank of comparators. We explored alternative methods for pulse detection for multibin EDPC detectors that could improve performance at high count rates. The detector signal was simulated in a Monte Carlo fashion assuming a bipolar shape and analyzed using several methods, including the conventional bank of comparators. For example, one method recorded the peak energy of the pulse along with the width (temporal extent) of the pulse. The Cramer-Rao lower bound of the variance of basis material estimates was numerically found for each method. At high count rates, the variance in water material (bone canceled) measurements could be reduced by as much as an order of magnitude. Improvements in virtual monoenergetic images were modest. We conclude that stochastic noise in spectral imaging tasks could be reduced if alternative methods for pulse detection were utilized.

Keywords: comparators; photon-counting detectors; pulse pileup; spectral imaging.


Figures

Fig. 1
Fig. 1
Example of different pulse-detection mechanisms. The “detected signal” plot is simulated from the incident photons, convolved with the bipolar detector response shape. Noise is added in this plot but absent in actual simulations. In the detected signal plot, two horizontal lines are drawn, representing energy thresholds for the comparators. Because of pileup, the signal contributions from different photons sometimes overlap and become difficult to separate. Each of the pulse-detection mechanisms loses different types of counts. For each mechanism, we draw an equivalent signal that can be compared against the incident photons to show which photons are lost. See text for details.
Fig. 2
Fig. 2
Relative CRLB of the variances for different pulse-detection logics, assuming ideal energy response. The x-axis corresponds to the incident flux normalized by the characteristic count rate, but the variances are reported at constant dose, so the measurement time decreases as the incident flux is increased. Within each plot, the CRLB has been normalized to performance at very low count rates. Hence, both axes are unitless. Error bars represent 95% confidence intervals. (a) Water material. (b) Equivalent monoenergetic imaging.
Fig. 3
Fig. 3
The same variance plots as in Fig. 2, but assuming a degraded energy response following that of Ref. . (a) Water material. (b) Equivalent monoenergetic imaging. Note that the y-axis is normalized to the CRLB of the degraded energy response at low count rate, which is a different normalization factor than used in Fig. 2.
Fig. 4
Fig. 4
Effect of different comparators in the noise of CT images. These are variance maps, with the brightness of pixel proportional to the variance in the reconstruction. The variance maps are for (top row) equivalent monoenergetic images and (bottom row) virtual noncontrast or water material images. The window widths and levels are constant within each row but different from row to row; the equivalent monoenergetic images have had their noise multiplied by 40 to display them on the same scale. The columns correspond to (left) the traditional bank of comparators, (middle) peak-width 2-D binning, and (right) local maxima detection with multicount distinction operating on the comparator signals.

References

    1. Taguchi K., Iwanczyk J. S., “Vision 20/20: single photon counting x-ray detectors in medical imaging,” Med. Phys. 40, 100901 (2013).10.1118/1.4820371 - DOI - PMC - PubMed
    1. Tanguay J., Kim H. K., Cunningham I. A., “The role of x-ray swank factor in energy-resolving photon-counting imaging,” Med. Phys. 37, 6205 (2010).10.1118/1.3512794 - DOI - PubMed
    1. Swank R. K., “Absorption and noise in x‐ray phosphors,” J. Appl. Phys. 44(9), 4199–4203 (1973).10.1063/1.1662918 - DOI
    1. Schlomka J., et al. , “Experimental feasibility of multi-energy photon-counting K-edge imaging in pre-clinical computed tomography,” Phys. Med. Biol. 53(15), 4031 (2008).10.1088/0031-9155/53/15/002 - DOI - PubMed
    1. Kappler S., et al. , “First results from a hybrid prototype CT scanner for exploring benefits of quantum-counting in clinical CT,” Proc. SPIE 8313, 83130X (2012).PSISDG10.1117/12.911295 - DOI