

Acute Slow Wave Responses to High-Frequency Gastric Electrical Stimulation in Patients With Gastroparesis Defined by High-Resolution Mapping
- PMID: 27284964
- PMCID: PMC5138141
- DOI: 10.1111/ner.12454
Acute Slow Wave Responses to High-Frequency Gastric Electrical Stimulation in Patients With Gastroparesis Defined by High-Resolution Mapping
Abstract
Background and aims: High-frequency gastric electrical stimulation (GES) has emerged as a therapy for gastroparesis, but the mechanism(s) of action remain unclear. There is a need to refine stimulation protocols for clinical benefit, but a lack of accurate techniques for assessing mechanisms in clinical trials, such as slow wave modulation, has hindered progress. We thereby aimed to assess acute slow wave responses to GES in gastroparesis patients using high-resolution (HR) (multi-electrode) mapping, across a range of stimulation doses achievable by the Enterra stimulation device (Medtronic Inc., MN, USA).
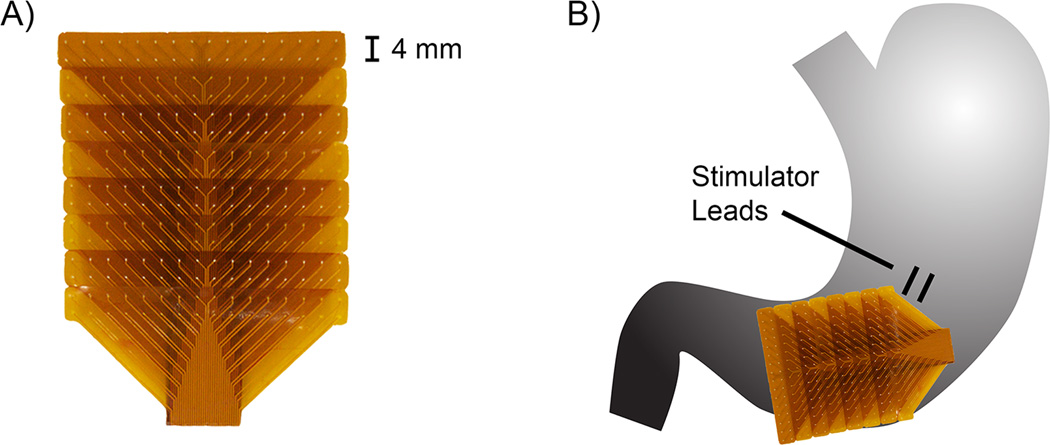
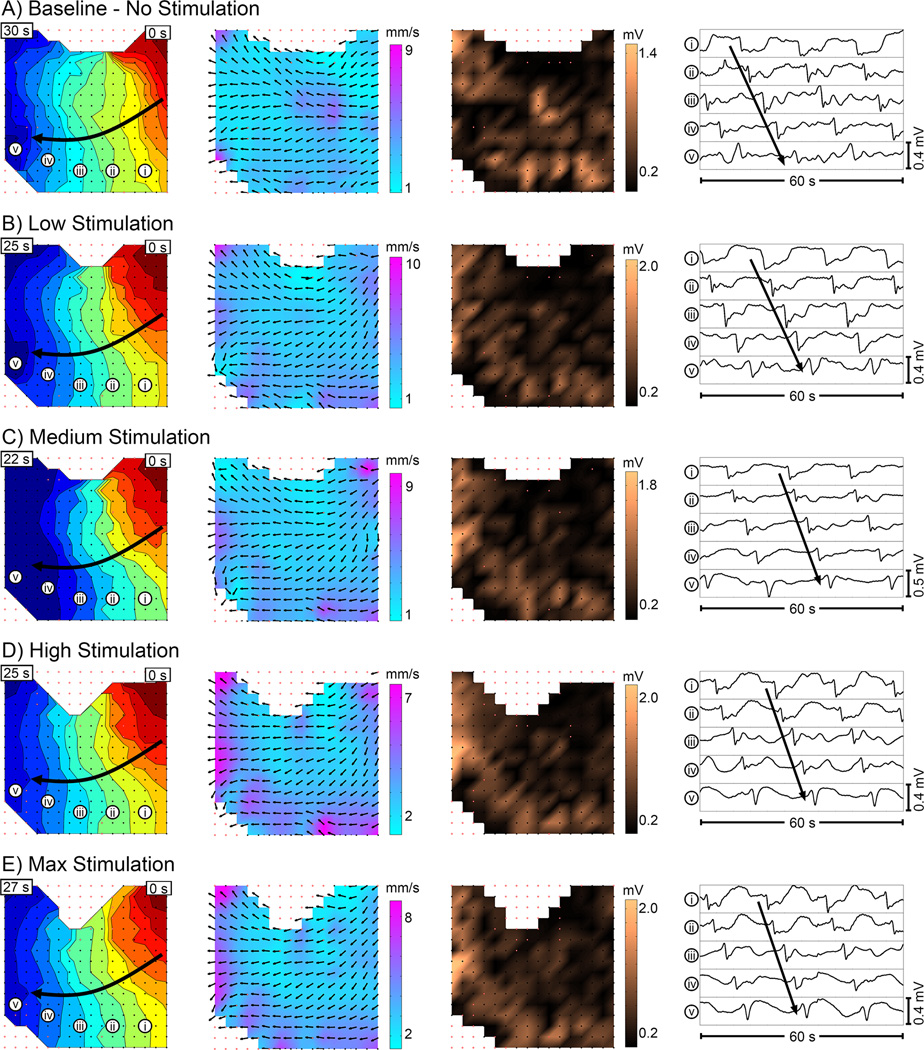
Materials and methods: Patients with medically refractory gastroparesis (n = 8) undergoing device implantation underwent intraoperative HR mapping (256 electrodes). Baseline recordings were followed by four protocols of increasing stimulation intensity, with washout periods. Slow wave patterns, frequency, velocity, amplitude, and dysrhythmia rates were quantified by investigators blinded to stimulation settings.
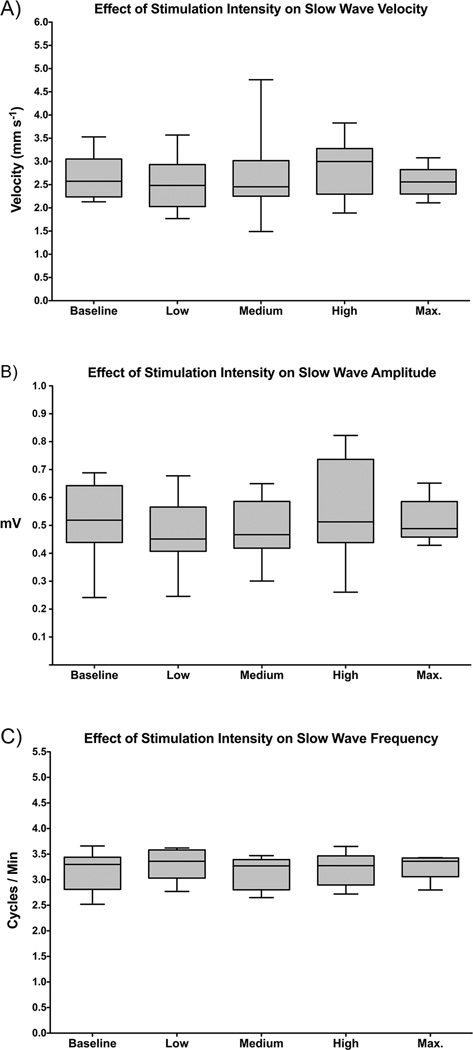
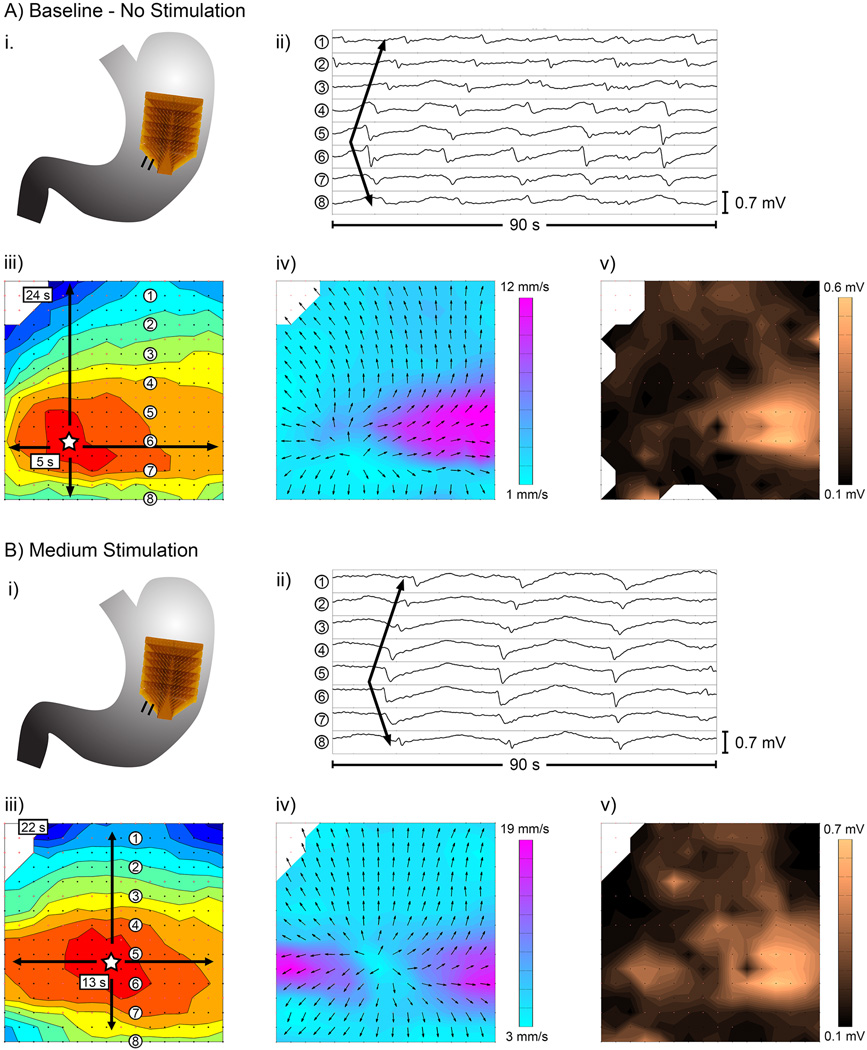
Results: There was no difference in slow wave pattern, frequency, velocity, or amplitude between baseline, washout, and stimulation periods (all p > 0.5). Dysrhythmias included ectopic pacemakers, conduction blocks, retrograde propagation, and colliding wavefronts, and dysrhythmia rates were unchanged with stimulation off vs. on (31% vs. 36% duration dysrhythmic; p > 0.5). Symptom scores and gastric emptying were improved at 5.8 month follow-up (p < 0.05).
Conclusions: High-frequency GES protocols achievable from a current commercial device did not acutely modulate slow wave activity or dysrhythmias. This study advances clinical methods for identifying and assessing therapeutic GES parameters, and can be applied in future studies on higher-energy protocols and devices.
Keywords: Diabetes mellitus; electrophysiology; high-resolution mapping; pacing; slow wave.
© 2016 International Neuromodulation Society.
Conflict of interest statement
Statement: Drs. Angeli, Du, Paskaranandavadivel, Cheng and O’Grady hold intellectual property and/or patent applications in the field of mapping gastrointestinal electrophysiology. Dr. Abell is a former licensor, consultant, and investigator for Medtronic, Inc. The other authors report not disclosures.
Figures
References
-
- Hasler WL. Gastroparesis: pathogenesis, diagnosis and management. Nat Rev Gastroenterol Hepatol. 2011;8:438–453. - PubMed
-
- Wang YR, Fisher RS, Parkman HP. Gastroparesis-related hospitalizations in the United States: trends, characteristics, and outcomes, 1995–2004. Am J Gastroenterol. 2008;103:313–322. - PubMed
-
- Tack J. The difficult patient with gastroparesis. Best Pr Res Clin Gastroenterol. 2007;21:379–391. - PubMed
-
- Abell T, McCallum R, Hocking M, et al. Gastric electrical stimulation for medically refractory gastroparesis. Gastroenterology. 2003;125:421–428. - PubMed
-
- Zhang J, Chen JDZ. Systematic review: applications and future of gastric electrical stimulation. Aliment Pharmacol Ther. 2006;24:991–1002. - PubMed
MeSH terms
Grants and funding
LinkOut - more resources
Full Text Sources
Other Literature Sources
