. 2016 Aug;44(3):2028-39.
doi: 10.1111/ejn.13295. Epub 2016 Jul 19.

Brain-derived neurotrophic factor prevents dendritic retraction of adult mouse retinal ganglion cells

Affiliations

Brain-derived neurotrophic factor prevents dendritic retraction of adult mouse retinal ganglion cells

Kate E Binley et al. Eur J Neurosci. 2016 Aug.

Abstract

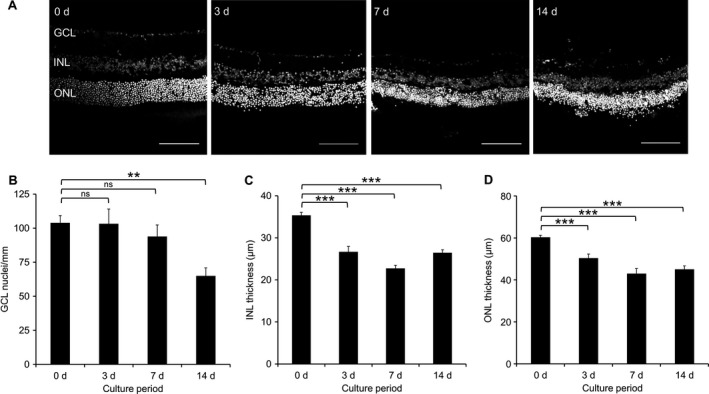
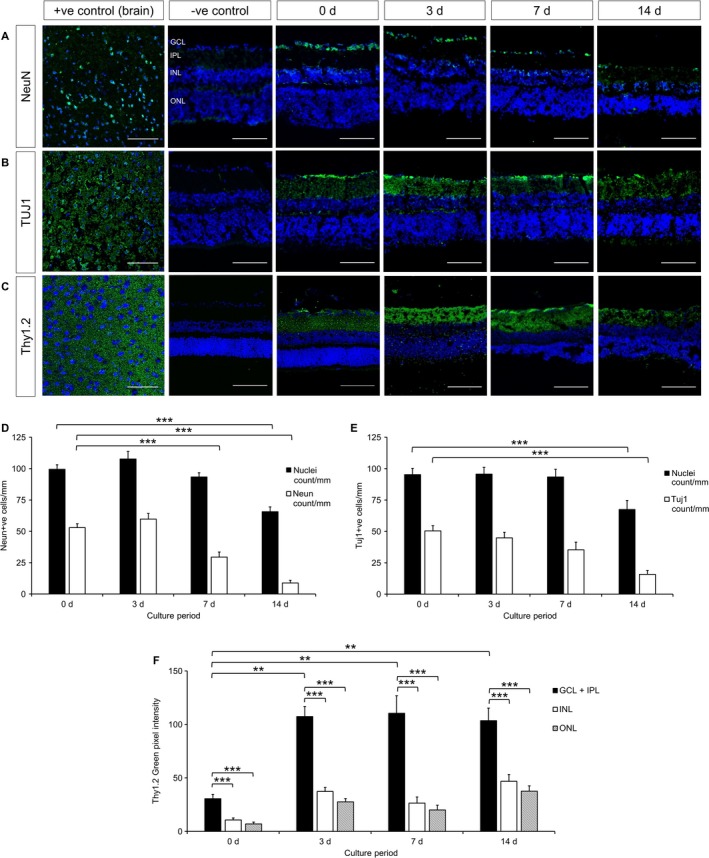
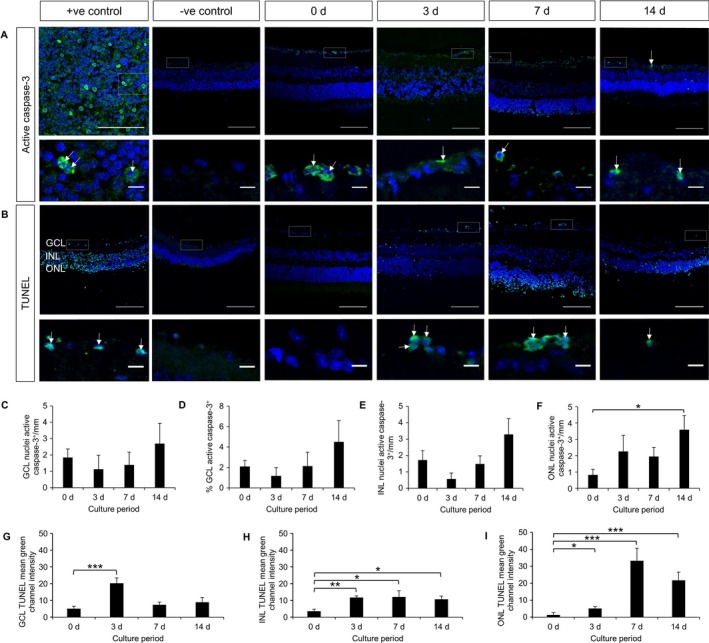
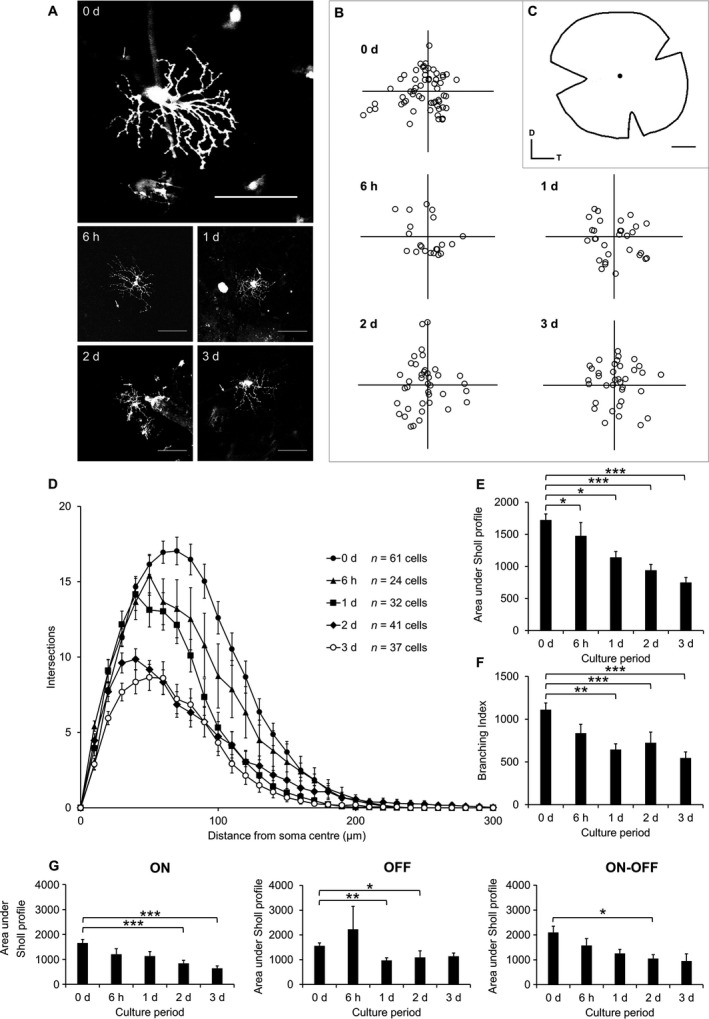
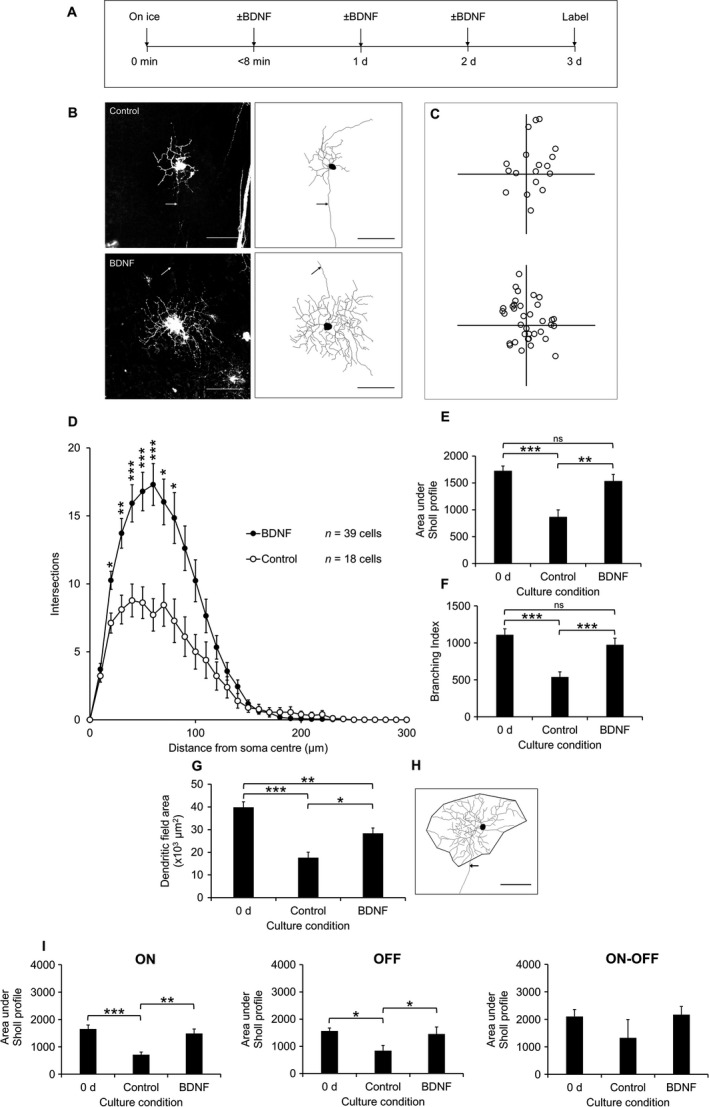
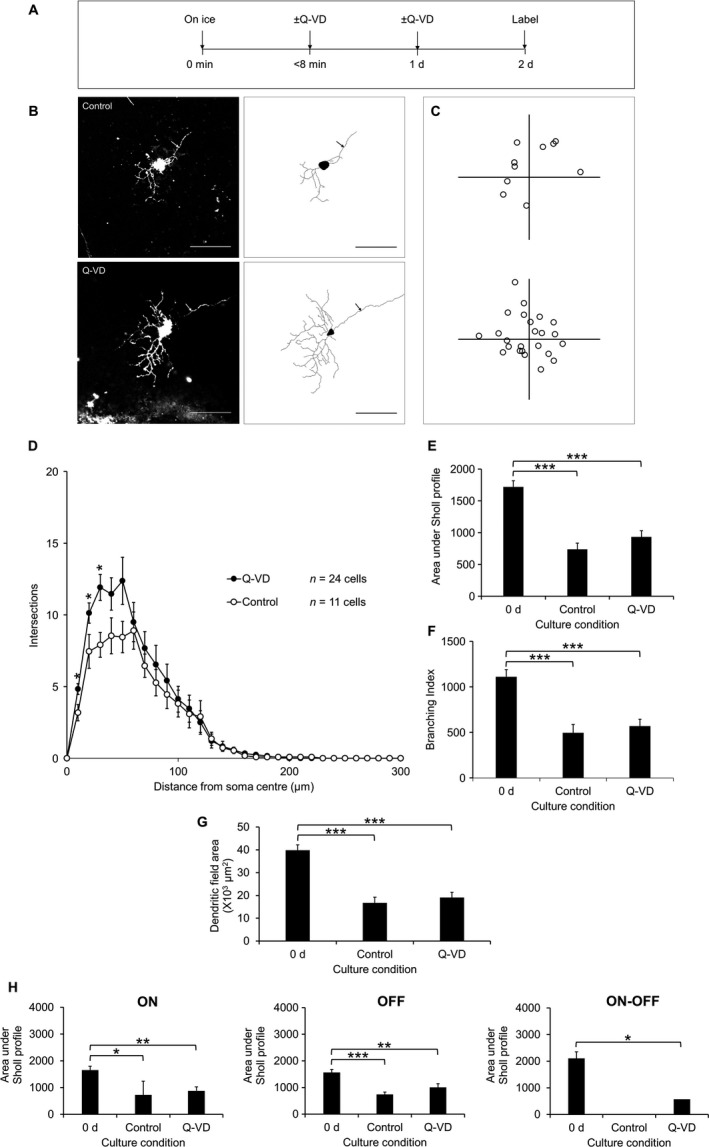
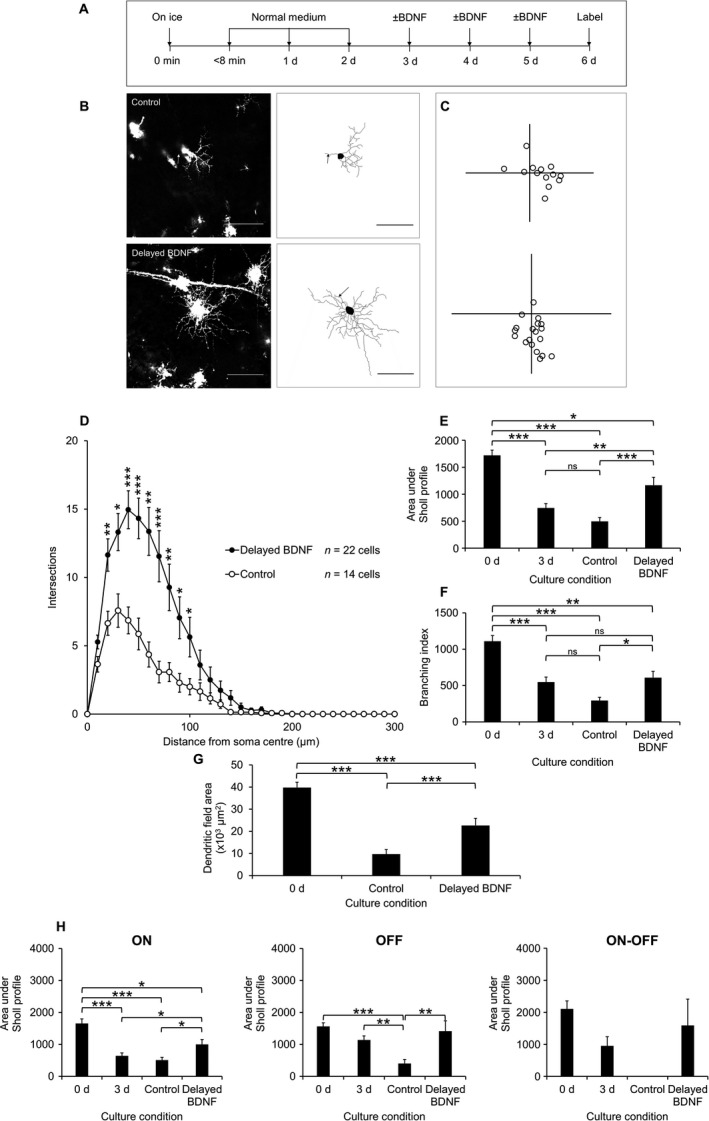
We used cultured adult mouse retinae as a model system to follow and quantify the retraction of dendrites using diolistic labelling of retinal ganglion cells (RGCs) following explantation. Cell death was monitored in parallel by nuclear staining as 'labelling' with RGC and apoptotic markers was inconsistent and exceedingly difficult to quantify reliably. Nuclear staining allowed us to delineate a lengthy time window during which dendrite retraction can be monitored in the absence of RGC death. The addition of brain-derived neurotrophic factor (BDNF) produced a marked reduction in dendritic degeneration, even when application was delayed for 3 days after retinal explantation. These results suggest that the delayed addition of trophic factors may be functionally beneficial before the loss of cell bodies in the course of conditions such as glaucoma.

Keywords: Sholl analysis; neurodegeneration; neuron labelling; neuroprotection.


Figures

Figure 1
Figure 1
Nuclear stained frozen sections of explants cultured for up to 14 d. (A) Representative 8‐bit images of TOPRO‐3 labelled sections; scale bars 100 μm. (B) Linear cell counts of GCL show cell loss after 14 d. **< 0.005, ns, not significant, anova with Tukey post hoc. (C) INL thickness measured after each culture period show layer thinning after 3 d. ***< 0.001, anova with Tukey post hoc. (D) ONL thickness measured after each culture period show layer thinning after 3 d. ***< 0.001, Mann–Whitney with Bonferroni correction. = 5 retinas, 3 animals (0 d), = 6 retinas, 5 animals (3 d), = 3 retinas, 3 animals (7 d), = 4 retinas, 4 animals (14 d). At least three sections from each retina were analysed. Error bars ± SEM. d, days.
Figure 2
Figure 2
Immunofluorescence shows maintenance of neuronal markers over 14 d culture of retinal explants. (A) Staining for neuronal marker NeuN (green) counter‐stained with TOPRO‐3 nuclear stain (blue) in frozen sections of explants cultured for up to 14 d. = 3 retinas, 3 animals (0 d), = 3 retinas, 3 animals (3 d), = 3 retinas, 3 animals (7 d), = 3 retinas, 3 animals (14 d). (B) Staining for neuronal marker TUJ1 (green) counter‐stained with TOPRO‐3 nuclear stain (blue) in frozen sections of explants cultured for up to 14 d. = 3 retinas, 3 animals (0 d), = 3 retinas, 3 animals (3 d), = 3 retinas, 3 animals (7 d), = 3 retinas, 3 animals (14 d). (C) Staining for RGC marker Thy1.2 (green) counter‐stained with TOPRO‐3 nuclear stain (blue) in frozen sections of explants cultured for up to 14 d. = 3 retinas, 2 animals (0 d), = 3 retinas, 3 animals (3 d), = 3 retinas, 3 animals (7 d), = 5 retinas, 5 animals (14 d). (D) Quantification of NeuN‐positive cells in the GCL, shown with nuclear stained‐only cells for comparison. ***< 0.001, anova with Tukey post hoc. (E) Quantification of TUJ1‐positive cells in the GCL, shown with nuclear stained‐only cells for comparison. ***< 0.001, anova with Tukey post hoc. (F) Thy1.2 staining in each retinal layer quantified as mean green channel intensity, normalized for background fluorescence, as described in the text. **< 0.005, ***< 0.001, anova with Tukey post hoc. Positive controls: brain. Scale bars: 100 μm. At least three sections from each retina were analysed. Error bars ± SEM. d, days.
Figure 3
Figure 3
Fluorescent staining of apoptotic markers, active caspase‐3 and TUNEL in frozen sections of explants cultured for up to 14 d. (A) Active caspase‐3 staining (green) with TOPRO‐3 nuclear stain (blue) over 14 d at 20× magnification (top) and higher magnification of areas highlighted with dashed boxes to show individual cells (bottom). Active caspase‐3 staining tended to increase with time. Arrows indicate active caspase‐3 positive cells. Positive control: spleen. Scale bars: 100 μm (top), 10 μm (bottom). = 5 retinas, 3 animals (0 d); = 3 retinas, 3 animals (3 d); = 3 retinas, 3 animals (7 d); = 5 retinas, 5 animals (14 d). (B) TUNEL labelling (green) with TOPRO‐3 nuclear stain (blue) over 14 d at 20× magnification (top) and higher magnification of areas highlighted with dashed boxes to show individual cells (bottom). TUNEL labelling increased over time. Arrows indicate TUNEL‐positive cells. Positive control: proteinase‐k‐digested retinal sections. Scale bars: 100 μm (top), 10 μm (bottom). = 4 retinas, 3 animals (0 d); = 4 retinas, 4 animals (3 d); = 3 retinas, 3 animals (7 d); = 3 retinas, 3 animals (14 d). (C) Number of active caspase‐3‐positive cells in GCL quantified per mm. > 0.05, Mann–Whitney with Bonferroni correction. (D) Number of active caspase‐3‐positive cells in GCL quantified as % of cells in GCL. > 0.05, Mann–Whitney with Bonferroni correction. (E) Number of active caspase‐3‐positive cells in INL quantified per mm. > 0.05, Mann–Whitney with Bonferroni correction. (F) Number of active caspase‐3‐positive cells in ONL quantified per mm. *< 0.05, Mann–Whitney with Bonferroni correction. (G) TUNEL staining in GCL quantified as mean green channel fluorescence, normalized for background fluorescence. ***< 0.001, Mann–Whitney with Bonferroni correction. (H) TUNEL staining in INL quantified as mean green channel fluorescence, normalized for background fluorescence. *< 0.05, **< 0.005, Mann–Whitney with Bonferroni correction. (I) TUNEL staining in ONL quantified as mean green channel fluorescence, normalized for background fluorescence. *< 0.05, ***< 0.001, Mann–Whitney with Bonferroni correction. At least three sections from each retina were analysed. Error bars ± SEM. d, days.
Figure 4
Figure 4
Diolistically labelled RGCs from explants cultured for up to 3 d show dendrite loss over time. (A) Representative 512 × 512 pixel (0 d) or 1024 × 1024 pixel (rest) images of RGCs at each time point; scale bars 100 μm; arrow indicates axon. (B) Locations of all labelled RGCs plotted relative to the optic nerve head (origin). (C) Diagram of prepared explant with optic nerve head indicated. D, dorsal; T, temporal; scale bar 1 mm. (D) Sholl plots for RGCs at each time point. (E) Area under Sholl profiles at each time point. *< 0.05, ***< 0.001, Mann–Whitney with Bonferroni correction. (F) Branching index of RGCs. **< 0.005, ***< 0.001, anova with Tukey post hoc. (G) Sholl AUC for each culture period split by RGC sub‐type. ON (left): n = 28 cells (0 d), n = 14 cells (6 h), n = 13 cells (1 d), n = 26 cells (2 d), n = 28 cells (3 d). OFF (middle): n = 12 cells (0 d), n = 4 cells (6 h), n = 8 cells (1 d), n = 8 cells (2 d), n = 5 cells (3 d). ONOFF (right): n = 11 cells (0 d), n = 6 cells (6 h), n = 11 cells (1 d), n = 7 cells (2 d), n = 4 cells (3 d). *< 0.05, **< 0.005, ***< 0.001, Mann–Whitney with Bonferroni correction. The numbers of cells analysed (D) are indicated. Error bars ± SEM. d, days.
Figure 5
Figure 5
Diolistically labelled RGCs from explants cultured with 100 ng/mL BDNF, or vehicle (PBS, 0.1% BSA) as control, over 3 d showing retardation of dendritic atrophy in the presence of BDNF. (A) Time course of experiment. (B) Representative 1024 × 1024 pixel images of RGCs from control (top) and BDNF (bottom) with 8‐bit tracing images for each cell (right); scale bars 100 μm; arrow indicates axon. (C) Locations of RGCs from control (top) and BDNF‐treated (bottom) explants plotted relative to the optic nerve head (origin). (D) Sholl profiles for RGCs in each group. *< 0.05, **< 0.005, ***< 0.001, Kruskal–Wallis. (E) Area under Sholl profiles in each group, shown with the 0 d value for comparison. **< 0.005, ***< 0.001, ns, not significant, anova with Tukey post hoc. (F) Branching index. ***< 0.001, ns, not significant, anova with Tukey post hoc. (G) Dendritic field area of RGCs, shown with the 0 d value for comparison. *< 0.05, **< 0.005, ***< 0.001, anova with Tukey post hoc. (H) Example of dendritic field area measurement using 8‐bit tracing. Scale bar 100 μm, arrow indicates axon (not included in measurement). (I) Sholl AUCs split according to RGC stratification depth. ON (left): n = 28 cells (0 d), n = 8 cells (control), n = 26 cells (BDNF). OFF (middle): n = 20 cells (0 d), n = 7 cells (control), n = 10 cells (BDNF). ONOFF (right): n = 13 cells (0 d), n = 3 cells (control), n = 3 cells (BDNF). *< 0.05, **< 0.005, ***< 0.001, anova with Tukey post hoc. The number of cells analysed (D) are indicated. Error bars ± SEM. d, days.
Figure 6
Figure 6
Diolistically labelled RGCs from explants cultured with 100 μm pan‐caspase inhibitor, Q‐VD, or vehicle (DMSO) as control over 2 d showing modest protective effect of Q‐VD on dendritic atrophy of RGCs. (A) Time course of experiment. (B) 1024 × 1024 pixel images of fluorescently labelled RGCs from control (top) and Q‐VD‐treated (bottom) explants with 8‐bit tracing images for each cell (right). Scale bars 100 μm. Arrow indicates axon. (C) Locations of every labelled RGC from control (top) and Q‐VD‐treated (bottom) explants plotted relative to the optic nerve head (origin). (D) Sholl profiles of labelled RGCs. *< 0.05, anova. (E) Area under Sholl profiles shown with the value for 0 d for comparison. ***< 0.001, anova with Tukey post hoc. (F) Branching index of RGCs. ***< 0.001, anova with Tukey post hoc. (G) Dendritic field area of RGCs in each group shown with the value for 0 d as comparison. ***< 0.001, anova with Tukey post hoc. (H) Sholl AUCs split by RGC sub‐type. ON (left): n = 28 cells (0 d), n = 2 cells (control), n = 10 cells (Q‐VD). OFF (middle): n = 12 cells (0 d), n = 9 cells (control), n = 13 cells (Q‐VD). ONOFF (right): n = 11 cells (0 d), n = 0 cells (control), n = 1 cell (Q‐VD). *< 0.05, **< 0.005, ***< 0.001, anova with Tukey post hoc. The numbers of cells analysed (D) are indicated. Error bars ± SEM. d, days.
Figure 7
Figure 7
Diolistically labelled RGCs from explants cultured with 100 ng/mL BDNF or vehicle (PBS, 0.1% BSA) as control over 3 d from day 3 showing that delayed BDNF treatment is capable of retarding dendritic retraction of RGCs. (A) Time course of experiment. (B) Representative 1024 × 1024 pixel images of RGCs from control (top) and delayed BDNF‐treated (bottom) explants with 8‐bit tracing images for each cell (right); scale bars 100 μm; arrow indicates axon. (C) Locations of RGCs from control (top) and delayed BDNF‐treated (bottom) explants plotted relative to the optic nerve head (origin). (D) Sholl profiles for RGCs. *< 0.05, **< 0.005, ***< 0.001, Kruskal–Wallis. (E) Area under Sholl profiles in each group, shown with the values for 0 and 3 d for comparison. *< 0.05, **< 0.005, ***< 0.001, ns, not significant, anova with Tukey post hoc. (F) Branching index of RGCs. *< 0.05, **< 0.005, ***< 0.001, ns, not significant, anova with Tukey post hoc. (G) Dendritic field area of RGCs shown with value for 0 d as comparison. **< 0.005, anova with Tukey post hoc. (H) Sholl AUCs split according to RGC sub‐type. ON (left): n = 28 cells (0 d), n = 12 cells (control), n = 14 cells (delayed BDNF). OFF (middle): n = 12 cells (0 d), n = 2 cells (control), n = 6 cells (delayed BDNF). ONOFF (right): n = 11 cells (0 d), n = 0 cells (control), n = 2 cells (delayed BDNF). *< 0.05, **< 0.005, ***< 0.001, ns, not significant, anova with Tukey post hoc. The number of cells analysed (D) are indicated. Error bars ± SEM. d, days.

Similar articles

Cited by

References

    1. Astafurov, K. , Dong, C.Q. , Panagis, L. , Kamthan, G. , Ren, L. , Rozenboym, A. , Perera, T.D. , Coplan, J.D. et al (2014) Complement expression in the retina is not influenced by short‐term pressure elevation. Mol. Vis., 20, 140–152. - PMC - PubMed
    1. Baquet, Z.C. , Gorski, J.A. & Jones, K.R. (2004) Early striatal dendrite deficits followed by neuron loss with advanced age in the absence of anterograde cortical brain‐derived neurotrophic factor. J. Neurosci., 24, 4250–4258. - PMC - PubMed
    1. Bosco, A. & Linden, R. (1999) BDNF and NT‐4 differentially modulate neurite outgrowth in developing retinal ganglion cells. J. Neurosci. Res., 57, 759–769. - PubMed
    1. Bull, N.D. , Johnson, T.V. , Welsapar, G. , DeKorver, N.W. , Tomarev, S.I. & Martin, K.R. (2011) Use of an adult rat retinal explant model for screening of potential retinal ganglion cell neuroprotective therapies. Invest. Ophth. Vis. Sci., 52, 3309–3320. - PMC - PubMed
    1. Caserta, T.M. , Smith, A.N. , Gultice, A.D. , Reedy, M.A. & Brown, T.L. (2003) Q‐VD‐OPh, a broad spectrum caspase inhibitor with potent antiapoptotic properties. Apoptosis, 8, 345–352. - PubMed

Publication types

Substances

LinkOut - more resources