. 2016 Aug 9;7(32):51375-51392.
doi: 10.18632/oncotarget.9837.

TMPRSS2-ERG fusion protein regulates insulin-like growth factor-1 receptor (IGF1R) gene expression in prostate cancer: involvement of transcription factor Sp1

Affiliations

TMPRSS2-ERG fusion protein regulates insulin-like growth factor-1 receptor (IGF1R) gene expression in prostate cancer: involvement of transcription factor Sp1

Shilhav Meisel Sharon et al. Oncotarget. .

Abstract

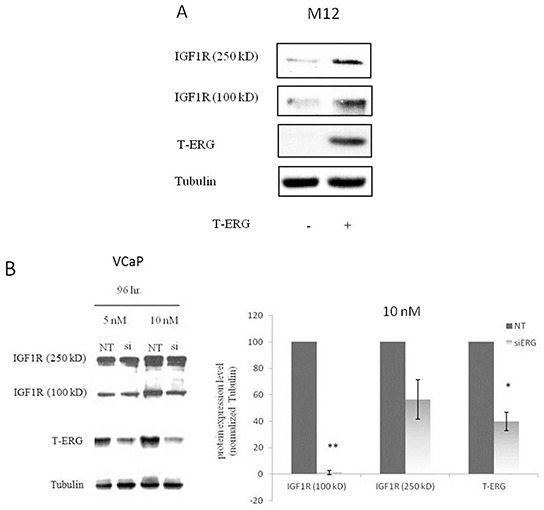
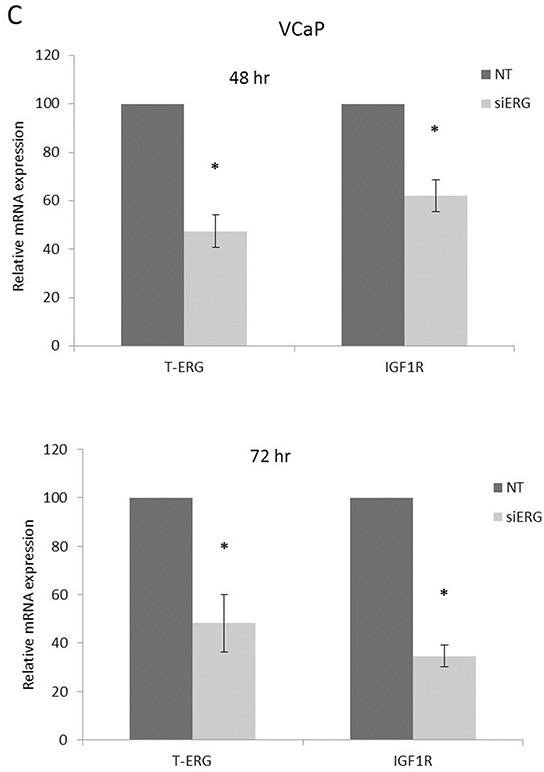
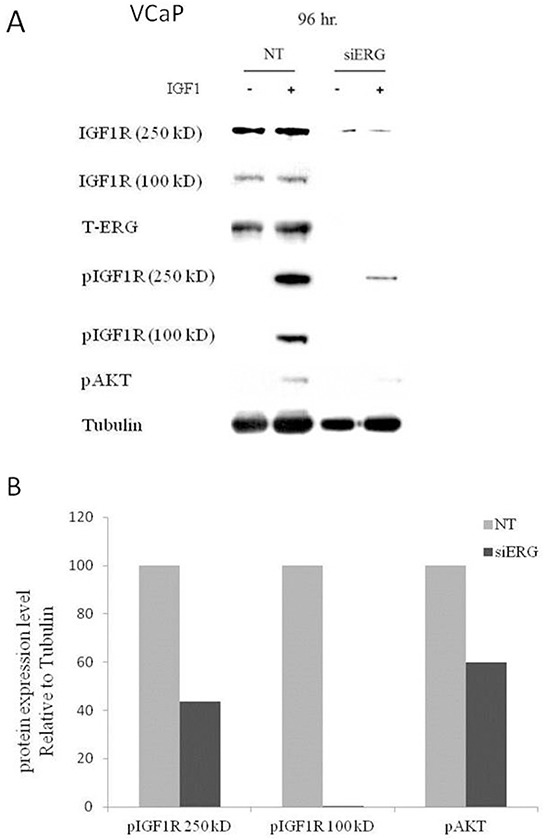
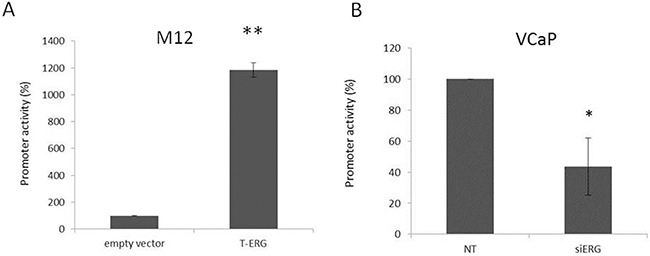
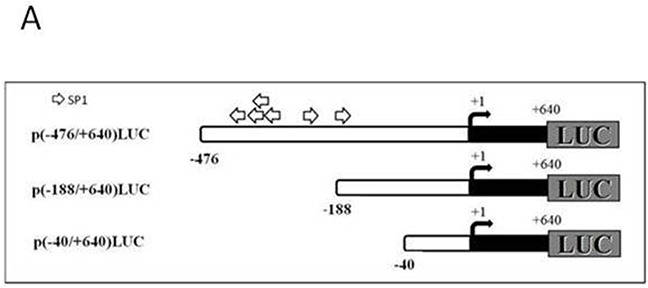
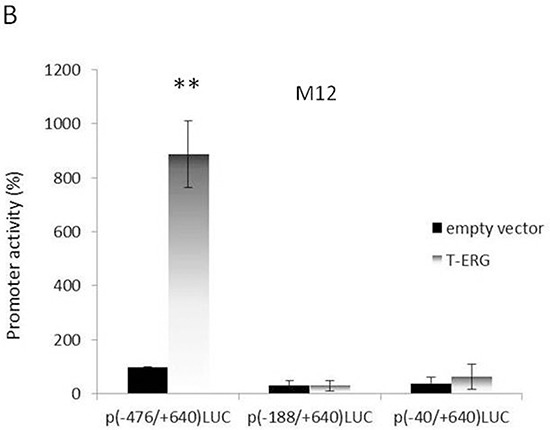
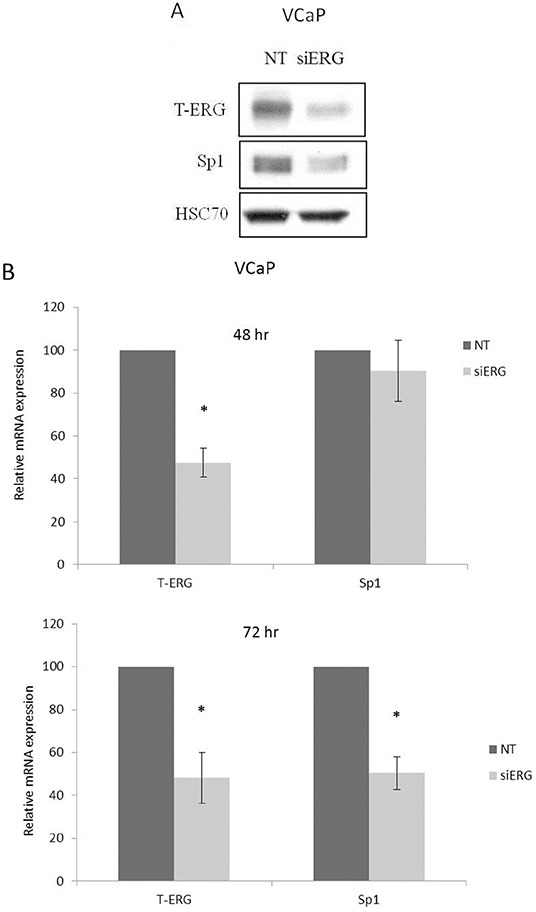
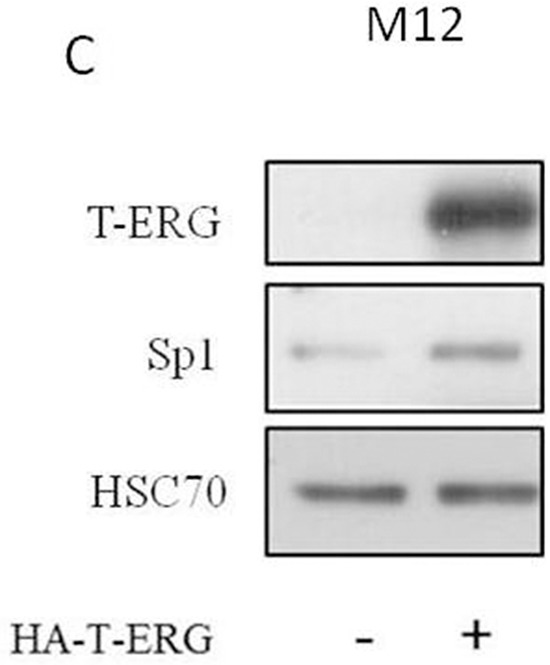
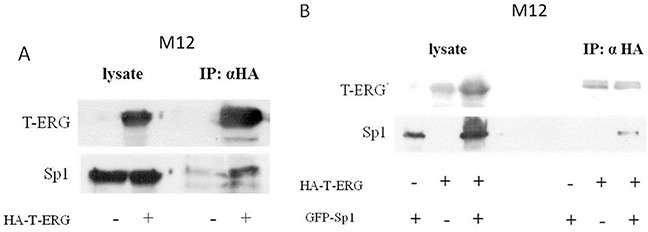
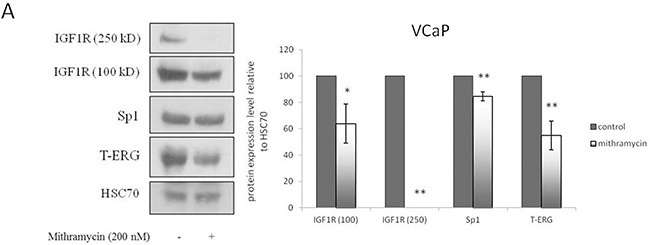
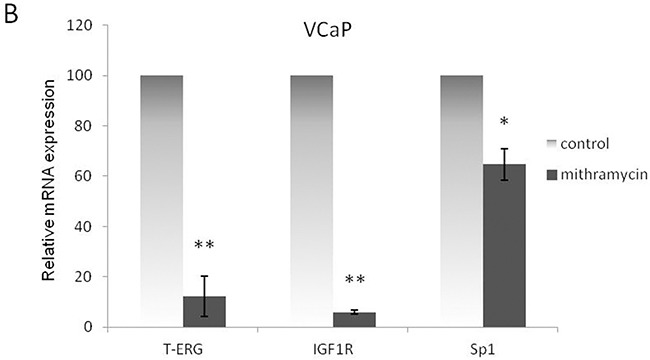
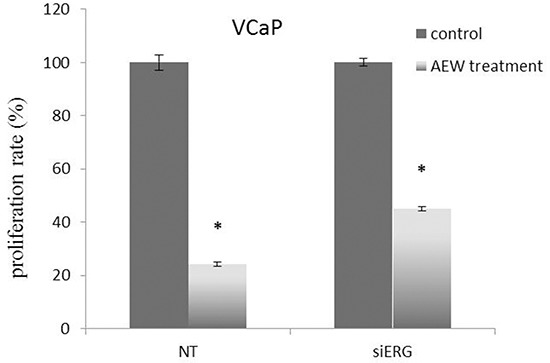
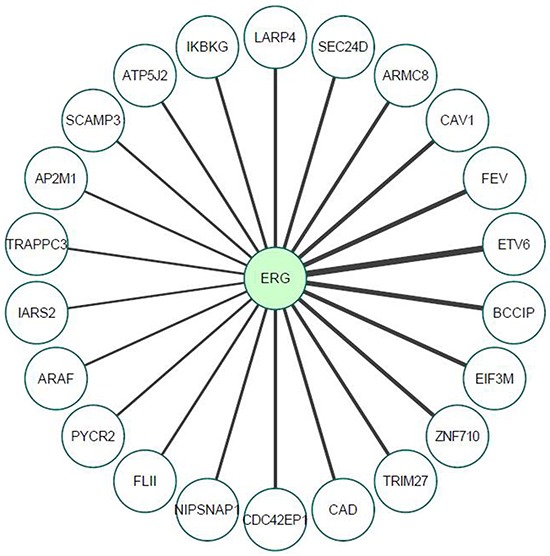
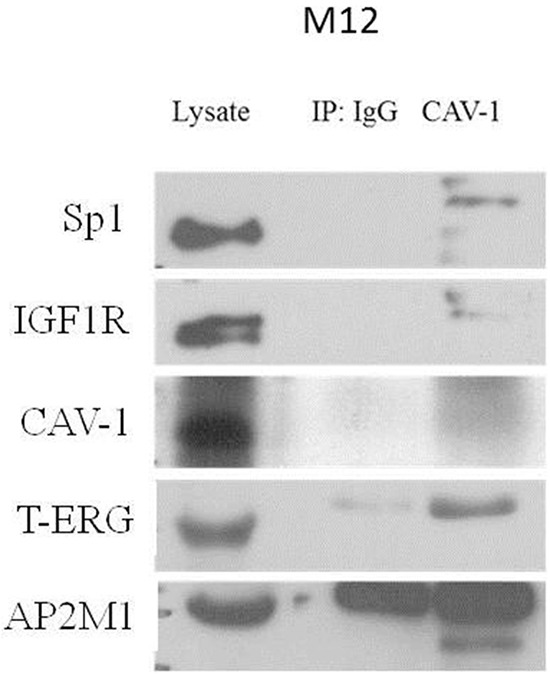
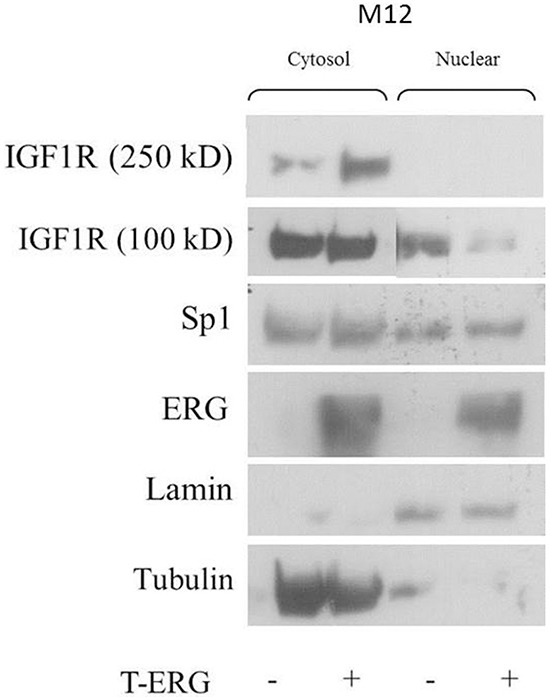
Prostate cancer is a major health issue in the Western world. The most common gene rearrangement in prostate cancer is the TMPRSS2-ERG fusion, which results in aberrant expression of the transcription factor ERG. The insulin-like growth factor-1 receptor (IGF1R) plays a key role in cell growth and tumorigenesis, and is overexpressed in most malignancies, including prostate cancer. In this study we show that TMPRSS2-ERG mediates its tumorigenic effects through regulation of IGF1R gene expression. Silencing of T-ERG in VCaP cells resulted in downregulation of both IGF1R and Sp1, a critical IGF1R regulator. Co-immunoprecipitation assays revealed a physical interaction between transcription factors ERG and Sp1, with potential relevance in IGF1R gene regulation. In addition, transactivation of the IGF1R gene by ERG was mediated at the level of transcription, as indicated by results of promoter assays. To identify new co-activators of the TMPRSS2-ERG fusion protein we performed mass spectrometry-based proteomic analyses. Among other interactors, we identified AP-2 complex subunit mu (AP2M1) and caveolin-1 (CAV1) in association with ERG in cell nuclei. These proteins play a mechanistic role in IGF1R internalization. Our analyses are consistent with a potential novel function of TMPRSS2-ERG as a major regulator of IGF1R gene expression. Results may impinge upon ongoing efforts to target the IGF1R in the clinics.

Keywords: IGF1 receptor; TMPRSS2-ERG; fusion proteins; insulin-like growth factor-1 (IGF1); prostate cancer.


Conflict of interest statement

The authors declare no Conflicts of Interest.

Figures

Figure 1
Figure 1. Effect of TMPRSS2-ERG on IGF1R protein and mRNA levels in prostate cancer cells
A. M12 cells were infected with a T-ERG-encoding viral vector. Cells were lysed, electrophoresed through SDS-PAGE, followed by transfer and incubation with an IGF1Rβ subunit antibody. Both the mature (100-kDa) and precursor (250-kDa) forms of the IGF1R are displayed. B. VCaP cells were transfected with an siRNA directed against the fusion protein (siERG) at doses of 5 or 10 nM, or control non-targeting (NT) siRNA. Cells were harvested after 96 hr, and levels of T-ERG and IGF1R were measured by Western blots; *, p < 0.05 versus control; **, p < 0.01 versus control. C. VCaP cells were transfected with siERG (or NT) for 48 or 72 hr. Total RNA was then extracted and quantitative RT-PCR was performed using specific primers. Hsc70 primers were used to measure housekeeping gene hsc70 mRNA levels. *, p < 0.05 versus control (n=3 independent experiments).
Figure 2
Figure 2. Effect of T-ERG expression on IGF1R downstream mediators
A. VCaP cells were transfected with siERG (or NT, for control purposes) for 96 hr, followed by IGF1 treatment (50 ng/ml) during the last 10 min of the incubation period. Whole-cell lysates (100 μg) were resolved on SDS-PAGE and immunoblotted with antibodies against pIGF1R, T-IGF1R, T-ERG, pAkt, and tubulin. -, no IGF1 treatment; +, with IGF1 treatment. B. Scanning densitometry analysis of phospho-IGF1R and phospho-Akt. Bars represent phospho-protein levels of IGF1-treated cells normalized to tubulin values. Results of a representative experiment repeated three times with similar results are shown.
Figure 3
Figure 3. Effect of T-ERG on IGF1R promoter activity
M12 A. and VCaP B. cells were cotransfected with 1 μg of p(−476/+640)LUC promoter reporter plasmid, along with 1 μg of T-ERG expression vector (or empty phCMV2) and 0.3 μg of pCMV β using the JetPEI transfection reagent. Luciferase and β-galactosidase activities were measured after 48 hr. Promoter activities are expressed as luciferase values normalized for β-galactosidase. Results are mean ± S.E.M. of 3 independent experiments, performed in duplicate dishes; *, p < 0.05 versus control; **, p < 0.01 versus control.
Figure 4
Figure 4. Deletion analysis of T-ERG effect on IGF1R promoter activity
A. Schematic diagram of IGF1R promoter fragments used in transient transfection assays. Plasmids p(−476/+640)LUC, p(−188/+640)LUC, and p(−40/+640)LUC contain, respectively, 476, 188, and 40 bp of 5′-flanking region (open bar) and 640 bp of 5′-untranslated region (closed bar) of the IGF1R gene, fused to a luciferase cDNA (LUC). An arrow denotes the transcription ‘initiator’ element. The luciferase cDNA is not shown to scale. Open arrows denote a cluster of Sp1 sites. B. M12 cells were cotransfected with 1 μg of the indicated reporter plasmids, along with 1 μg of the T-ERG expression vector (or empty phCMV2) and 0.3 μg of pCMVβ using the JetPEI reagent. Luciferase and β-galactosidase activities were measured after 48 hr. Promoter activities are expressed as luciferase values normalized for β-galactosidase. Results are mean ± S.E.M. of 3 independent experiments, performed in duplicate dishes. **, p<0.01 versus control.
Figure 5
Figure 5. Effect of T-ERG expression on transcription factor Sp1
A. VCaP cells were transfected with siERG (or NT) for 96 hr. Whole-cell lysates (100 μg) were resolved on SDS-PAGE and immunoblotted with an anti-Sp1 antibody. Levels of hsc70 were used as a loading control. B. Total RNA was extracted from siERG-transfected VCaP cells at 48 and 72 hr and Sp1 mRNA levels were measured by quantitative RT-PCR. Hsc70 mRNA levels were measured for control purposes; *, p < 0.05 versus control (n=3). C. M12 cells were transfected with a T-ERG-expression vector (or empty phCMV2) and Sp1 levels were measured after 48 hr. Results of a representative experiment repeated three times with similar results are shown.
Figure 6
Figure 6. Co-immunoprecipitation assays of Sp1 and T-ERG
M12 cells were transfected with 5 μg of a T-ERG expression vector (or empty phCMV2) A. or co-transfected with T-ERG expression vector and 5 μg of an Sp1 expression vector (or empty GFP vector) B. Cell lysates were co-immunoprecipitated using anti-HA (panels A and B). Results of a representative experiment repeated twice with similar results are shown.
Figure 7
Figure 7. Mithramycin studies
VCaP cells were treated with mithramycin for 24 hr. Protein levels were measured by Western blots A. and mRNA levels were measured by quantitative PCR. VCaP cells were treated with mithramycin for 24 hr. Protein levels were measured by Western blots B. Results are mean ± S.E.M. of 3 independent experiments, performed in duplicate dishes *, p < 0.05 versus control; **, p < 0.01 versus control.
Figure 8
Figure 8. Effect of TMPRSS2-ERG expression on IGF1R-directed targeted therapy
VCaP cells were transfected with 40 nM of siERG (or NT siRNA for control purposes). Forty-eight hours post-transfection cells were treated with the selective IGF1R inhibitor AEW541 for an additional 48 hr and proliferation rate was measured by XTT assays. Results are mean ± S.E.M. of 3 independent experiments. *, p < 0.05 versus control.
Figure 9
Figure 9. Proteomic analysis of TMPRSS2-ERG interactors, as determined by mass spectrometry
M12cellswere transfected with a T-ERG expression vector (or empty phCMV2). Cells were harvested and total cell lysates were co-immunoprecipitated using an anti-HA antibody (co-IP assays were performed in triplicates) followed by mass spectrometry analysis. Line thickness represents Welch difference (see also Table 1).
Figure 10
Figure 10. Co-immunoprecipitation assay of T-ERG with CAV1 and AP2M1
VCaP cells were harvested and lysates were co-immunoprecipitated using an anti-CAV1 antibody (or anti-IgG as control). Membranes were blotted with the indicated antibodies. Results of a representative experiment repeated twice with similar results are shown.
Figure 11
Figure 11. Effect of TMPRSS2-ERG on cellular localization of IGF1R
M12 cells were transfected with a T-ERG expression vector (or empty phCMV2) for 48 hr. Then, cells were harvested and fractionated into cytoplasmic and nuclear fractions, followed by Western blot analysis. Results of a representative experiment repeated three times with similar results are shown.

Similar articles

Cited by

References

    1. Samani AA, Yakar S, LeRoith D, Brodt P. The role of the IGF system in cancer growth and metastasis: overview and recent insights. Endocrine reviews. 2007;28:20–47. - PubMed
    1. Khandwala HM, McCutcheon IE, Flyvbjerg A, Friend KE. The effects of insulin-like growth factors on tumorigenesis and neoplastic growth. Endocrine reviews. 2000;21:215–244. - PubMed
    1. Werner H, Maor S. The insulin-like growth factor-I receptor gene: a downstream target for oncogene and tumor suppressor action. Trends in endocrinology and metabolism. 2006;17:236–242. - PubMed
    1. DiGiovanni J, Kiguchi K, Frijhoff A, Wilker E, Bol DK, Beltran L, Moats S, Ramirez A, Jorcano J, Conti C. Deregulated expression of insulin-like growth factor I in prostate epithelium leads to neoplasia in transgenic mice. Proceedings of the national academy of sciences USA. 2000;97:3455–3460. - PMC - PubMed
    1. Chan JM, Stampfer MJ, Giovannucci E, Gann PH, Ma J, Wilkinson P, Hennekens CH, Pollak M. Plasma insulin-like growth factor-I and prostate cancer risk: a prospective study. Science. 1998;279:563–566. - PubMed

MeSH terms