. 2016 Jun 10;12(6):e1004967.
doi: 10.1371/journal.pcbi.1004967. eCollection 2016 Jun.

Reservoir Computing Properties of Neural Dynamics in Prefrontal Cortex

Affiliations

Reservoir Computing Properties of Neural Dynamics in Prefrontal Cortex

Pierre Enel et al. PLoS Comput Biol. .

Abstract

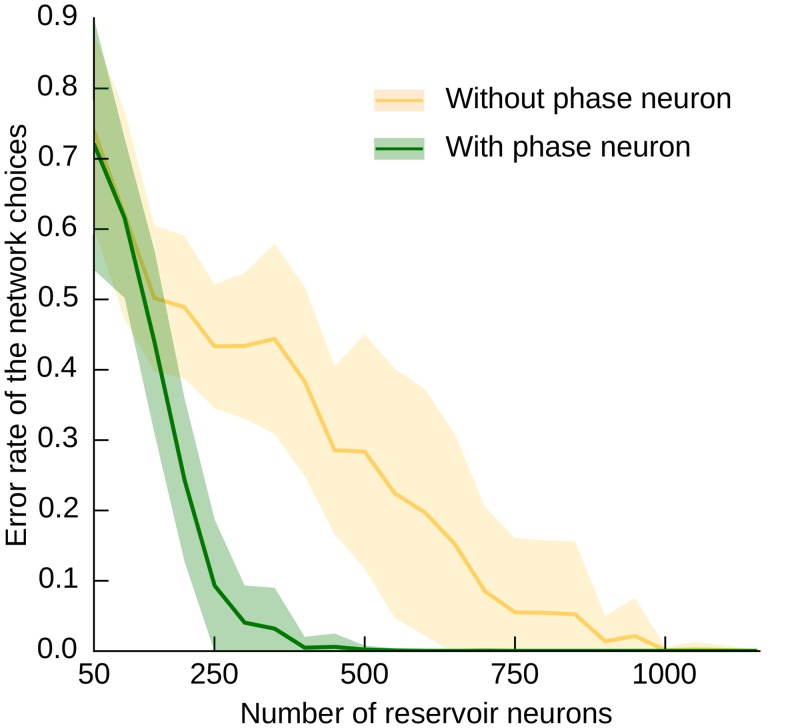
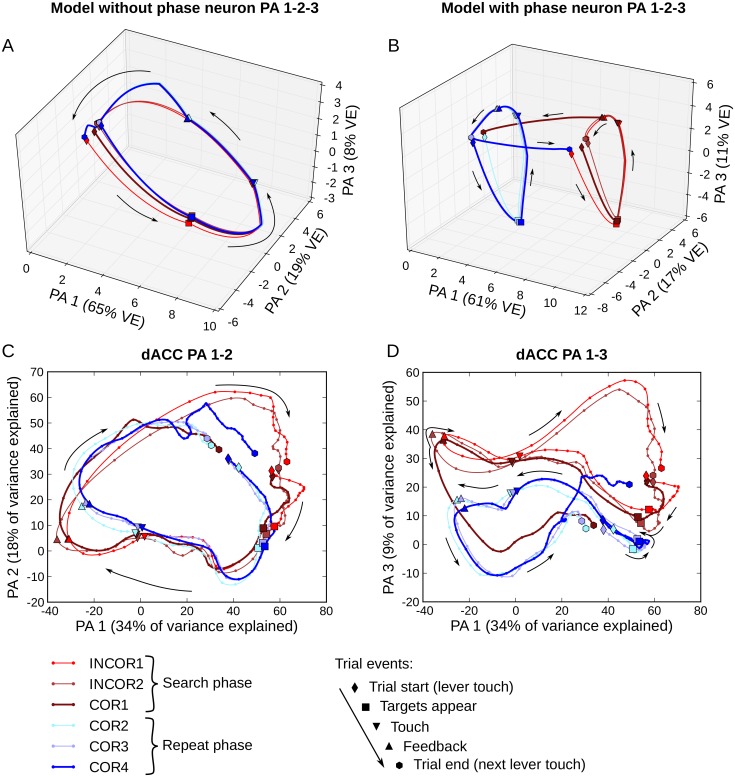
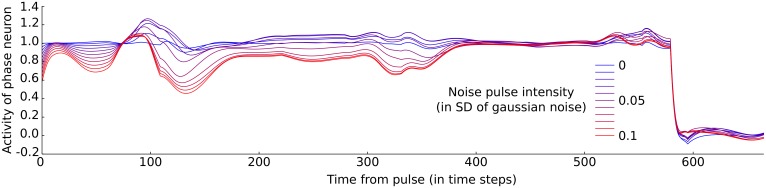
Primates display a remarkable ability to adapt to novel situations. Determining what is most pertinent in these situations is not always possible based only on the current sensory inputs, and often also depends on recent inputs and behavioral outputs that contribute to internal states. Thus, one can ask how cortical dynamics generate representations of these complex situations. It has been observed that mixed selectivity in cortical neurons contributes to represent diverse situations defined by a combination of the current stimuli, and that mixed selectivity is readily obtained in randomly connected recurrent networks. In this context, these reservoir networks reproduce the highly recurrent nature of local cortical connectivity. Recombining present and past inputs, random recurrent networks from the reservoir computing framework generate mixed selectivity which provides pre-coded representations of an essentially universal set of contexts. These representations can then be selectively amplified through learning to solve the task at hand. We thus explored their representational power and dynamical properties after training a reservoir to perform a complex cognitive task initially developed for monkeys. The reservoir model inherently displayed a dynamic form of mixed selectivity, key to the representation of the behavioral context over time. The pre-coded representation of context was amplified by training a feedback neuron to explicitly represent this context, thereby reproducing the effect of learning and allowing the model to perform more robustly. This second version of the model demonstrates how a hybrid dynamical regime combining spatio-temporal processing of reservoirs, and input driven attracting dynamics generated by the feedback neuron, can be used to solve a complex cognitive task. We compared reservoir activity to neural activity of dorsal anterior cingulate cortex of monkeys which revealed similar network dynamics. We argue that reservoir computing is a pertinent framework to model local cortical dynamics and their contribution to higher cognitive function.


Conflict of interest statement

The authors have declared that no competing interests exist.

Figures

Fig 1
Fig 1. Problem solving task.
A. An example problem. Monkeys searched through the targets by trial and error to find which target was rewarded. Incorrect trials (INC) and first rewarded trial (COR1) constitute the search phase. In this example, the upper left target is rewarded. The set of subsequent rewarded trials is defined as the repeat phase, made up of correct (COR) trials. At the end of the repeat phase a problem changing cue indicated to the monkey that a new problem was starting, thus a new target was rewarded. B. Single trial events. Trials started with hand on lever and fixation of a central point. A 1.5s delay ensued before targets appeared and fixation point disappeared, providing the GO signal. The monkey made a saccade to the chosen target and fixated it for 0.5s. The GO signal for hand movement was given by lever removal and the monkey touched the fixated target. All targets go blank at the time of touch and disappeared at feedback. Feedback was preceded by a 0.6s delay and followed by a 2s inter-trial interval.
Fig 2
Fig 2. Model architecture, modeled task and test-activity example.
A. Model architecture. A recurrent network of 1000 randomly connected neurons (the reservoir) received input from 5 units representing the presence of the fixation point, the lever, the targets, the reward and the signal to change. Output choice of the network was represented in two sets of 4 readout neurons corresponding to target fixation and arm touch respectively. Connections between the reservoir and readout (dashed arrows) were modified, through learning, to reproduce the behavior given by sequence of correct input/output examples. A contextual memory version of the model included a trained context neuron (in brown) that represented phase information (search or repeat). B. Time course of a modeled trial. A trial started with the activation of the lever and fixation point. Fixation point neuron deactivated concomitantly with targets appearance which was the GO signal for saccade to a target after a reaction time. Fixation of the target followed and was represented in the activation of one readout neuron among the four dedicated to target fixation. The lever input deactivation was the GO signal for arm touch that was represented in the activation of the readout neuron, after a reaction time, that represented the target chosen with the saccade in the second set of four readout neurons. Touch event occurred at the middle of arm choice and was the start of a 0.6 second delay to feedback. Feedback was simulated as the activation of the reward input for correct trials and the absence of activation in incorrect trials. A 2.15 seconds inter-trial interval started at the onset of feedback and ended at the onset of the next trial except for the last trial of problem (COR4: fourth correct trial) in which the inter-trial interval was extended to 4.25 seconds and the signal to change activated for 1.2 seconds. (Rwd: reward) C. Example of the network performing the task after learning to explore the targets with a circular search. Upper panel: A sequence of stimuli neurons activation. Middle panel: Activity of 4 example reservoir neurons. Lower panel: Readout of the network showing the successive choices of the model. The example shows the end of a repetition period where red target was rewarded. After signal to change input was activated (grey block), a new search for the rewarded target began with the exploration of blue target, then yellow and finally purple which was rewarded and then repeated.
Fig 3
Fig 3. Activities of reservoir model neurons displayed single variable selectivity, mixed selectivity and dynamic mixed selectivity.
Each histogram shows an example reservoir unit activity averaged over all trials of each given condition (error bars represent SEM). All statistical tests displayed on this figure correspond to two-sided pair-wise t-test with false discovery rate correction (p-value < 0.05). A. and B. represent the activity of two single units, respectively selective for phase at epoch late fixation and choice at epoch after feedback. C. Mixed selectivity pattern with significant phase-choice interaction (ANOVA, Phase x Choice interaction, p-value < 10−15) showing statistically higher activities for repeat phase when UL, UR and LR are chosen and the opposite pattern for LL target. D. Reservoir unit selectivity for phase depends on epoch (ANOVA, Epoch x Phase interaction, p-value < 10−15). E. Reservoir unit activity for all conditions of phase and choice at epochs early fixation and after feedback showing two different patterns of mixed selectivity (ANOVA, Epoch x Phase x Choice interaction, p-value < 10−15). Reservoir activity for phase depends on choice (left), and this dependence varies depending on epoch (right).
Fig 4
Fig 4. Similar to Fig 3 for dACC example neurons.
A. and B., single task variable selectivity. C. A dACC neuron activity significant for phase choice interaction (ANOVA, Phase x Choice interaction, p-value < 10−5) that is selective for phase only when lower left and lower right targets are chosen. D. dACC unit selectivity for phase depends on epoch (ANOVA, Epoch x Phase interaction, p-value < 10−15). E. Pattern of phase-choice mixed selectivity that changed depending on the epoch (ANOVA, Epoch x Phase x Choice interaction, p-value < 10−3).
Fig 5
Fig 5. Mixed selectivity and performance of the model as a function of noise.
Each curve represents the average ratio of model units that are significant for one of the tests. Tests include selectivity for factors Choice, Phase, and the interactions Phase-Choice, Epoch-Phase, Epoch-Choice, Epoch-Phase-Choice (3-way ANOVA, Epoch x Phase x Choice, shaded areas correspond to standard error). For comparison purposes, the dACC ratios are plotted as dashed lines with the same color code (see legend). On a similar scale is represented the performance of the model (black line) as the ratio of trials with a correct answer over the total number of trials. All selectivity ratios decreased with increasing noise, more complex selectivities decreasing faster. As dynamic mixed selectivity dropped with the slightest noise, so did the performance.
Fig 6
Fig 6. Example activities of reservoir and dACC neurons showing higher activity for feedback in COR1 trials.
Single neurons activities are averaged over incorrect (INC), first correct (COR1) and other correct (COR) trials and centered on the feedback (shaded areas correspond to SEM). A. Average activity of a dACC neuron showing a strong increase in activity after feedback for COR1 trials only (pairwise t-test with false discovery rate correction, COR1 > COR corrected p-value < 10−3, COR1 > INC corrected p-value < 10−5, Gaussian smoothing of firing rate with 35 ms standard deviation). B. Reservoir neuron from the model showing a significantly higher activity after feedback for COR1 trials (pairwise t-test with false discovery rate correction, COR1 > COR corrected p-value < 10−6, COR1 > INC corrected p-value < 10−15). C. Model readout neuron trained to activate specifically for the first reward, demonstrating the presence of the COR1 information in the reservoir.
Fig 7
Fig 7. Autocorrelation of the model (A) and the (B) dACC population activities.
Each point in this graph represents the correlation coefficient between the population activities at two different time points, except along the diagonal where each point is the correlation of the activity with itself. Both model and dACC populations show a dynamic pattern of activity that is closely following the sequence of the main events in the task.
Fig 8
Fig 8. Continuous phase readout from reservoir and dACC activity.
A. Example stimuli sequence, corresponding reservoir activity and model output during test showing the stability of phase readout. Upper panel shows a selection within the stimuli input sequence fed to the reservoir during test. Colored blocks represent activity of the reservoir input neurons simulating the different features of the task. Middle graph shows the activity of 20 randomly picked reservoir neurons illustrating the dynamic nature of activity in the reservoir. Lower graph shows the evolution of the readout neurons that represent target fixation (dashed lines) and hand touch (solid lines) along with the activity of a unit reading out the task phase (brown line). This special readout unit was not connected back to the reservoir and could not rely on the attractors created with a feedback connection. This portion of stimuli sequence starts with the last trial of a problem. After the signal to change is given to the model (grey block) the phase readout unit activates and fires steadily during the following three trials corresponding to the search phase showing the stable output that can be obtained from the dynamic reservoir activity. The third target exploration is rewarded (COR1 trial) and ends the search phase. At COR1 trial, when the reward neuron activates, the phase readout unit shuts off thereby signaling the start of the repeat phase. The rewarded target choice (red lines) is then repeated in subsequent trials. B. Upper graph illustrates the average readout output across all COR4 trials. Shaded area corresponds to the standard deviation. Correct readout is inferior to 0.5 for time bins before the signal to change, and the opposite for the following time bins. Lower graph is the average decoding accuracy and 95% confidence interval as computed from a 10,000 permutation test. C. Same as B for COR1 trials. Correct readout is superior to 0.5 for time bins before the first correct feedback, and the opposite for the following time bins. Transition from repetition to search was slower than the transition from search to repetition.
Fig 9
Fig 9. Error rates of the model as a function of the number of neurons in the reservoir (30 simulations, shaded area correspond to standard error).
The model required less neurons to perform well when phase information was explicitly represented in the trained context neuron. Error rates were computed as the ratio between the number of suboptimal trials (choices that likely postpone the reward) over the total number of trials. The reservoir required ~400 neurons to perform the task optimally with phase information explicitly encoded in a readout neuron, vs. ~1000 neurons that were required without the context neuron.
Fig 10
Fig 10. Reservoir and dACC population PCA-projected trajectories of successive trials in a problem show attractor-like dynamics.
Trajectory colors represent trials of each phase, reddish colors for search and blueish colors for repetition. A. Model population trajectories of average activity without context neuron (dimensions 1, 2 and 3; 93% of variance explained). All trajectories show a similar cyclic shape showing the successive events of a trial. Search and repeat trajectories are only separated after feedback and seem to collapse into a single trajectory at the middle of the next trial. B. Same as A with context neuron version of the model (89% of variance explained). Search and repeat trajectories form two well separated cyclic trajectories resembling two distinct attractors. COR1 and COR4 trials were the transition trials between the two sets of trajectories. C. dACC neural population trajectories of average activity for successive trials of a problem on dimension 1 and 2 of the PCA (51% of variance explained with both dimensions). Points represent successive 100ms of averaged activity. Trajectories show a cyclic pattern representing the path of activity in a trial. Search and repeat trajectories seem to overlap mostly between target appearance and touch events. D. Same as C with dimension 1 and 3 instead (42% of variance explained). Search and repeat trajectories are well separated suggesting an attractor like encoding of phase at the population level. (PA: principal axis, VE: variance explained)
Fig 11
Fig 11. Activity of phase neuron in response to perturbation.
Noise pulses were sent to the network at the beginning of the same INC1 trial. Gaussian noise was injected directly in the neurons (in the membrane potential) and not in the input (as was the case for the mixed selectivity noise simulations). Simulation after the noise pulse lasted 3 trials. Noise pulses ranged from 0 SD (no pulse) to 0.1 SD with increments of 0.01 SD using the same seed so that every pulse are scaled versions of a unique pulse. Each line represents the activity of the phase neuron for one level of noise, color coded from blue (0 perturbation) to red (maximum perturbation).

References

    1. Miller E.K. and Cohen J.D., An integrative theory of prefrontal cortex function. Annual review of neuroscience, 2001. 24(1): p. 167–202. - PubMed
    1. Rigotti M., et al., Internal representation of task rules by recurrent dynamics: the importance of the diversity of neural responses. Frontiers in computational neuroscience, 2010. 4. - PMC - PubMed
    1. Asaad W.F., Rainer G., and Miller E.K., Neural activity in the primate prefrontal cortex during associative learning. Neuron, 1998. 21(6): p. 1399–1407. - PubMed
    1. Barone P. and Joseph J.P., Prefrontal cortex and spatial sequencing in macaque monkey. Exp Brain Res, 1989. 78(3): p. 447–64. - PubMed
    1. Sakagami M. and Niki H., Encoding of behavioral significance of visual stimuli by primate prefrontal neurons: relation to relevant task conditions. Experimental Brain Research, 1994. 97(3): p. 423–436. - PubMed

Publication types