. 2016 Jul;17(1):122-9.
doi: 10.1016/j.scr.2016.05.012. Epub 2016 May 22.

Large-scale time-lapse microscopy of Oct4 expression in human embryonic stem cell colonies

Affiliations

Large-scale time-lapse microscopy of Oct4 expression in human embryonic stem cell colonies

Kiran Bhadriraju et al. Stem Cell Res. 2016 Jul.

Abstract

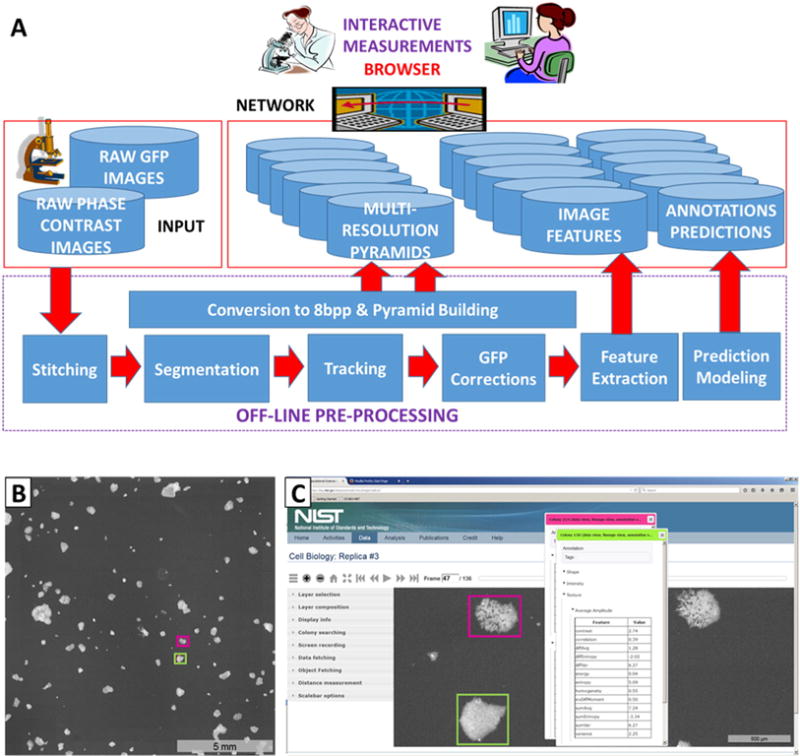
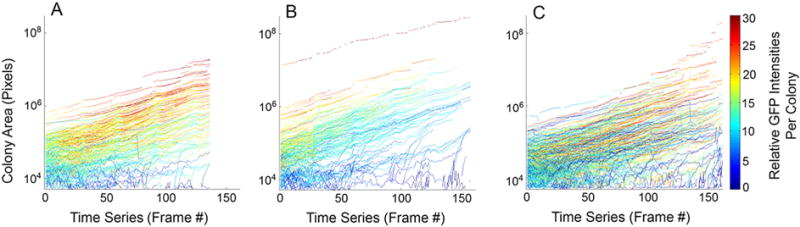
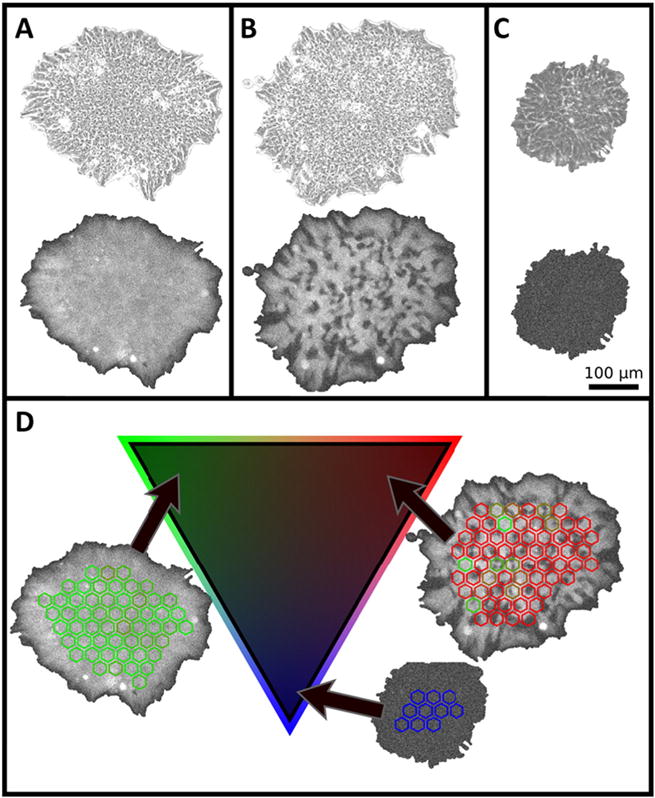
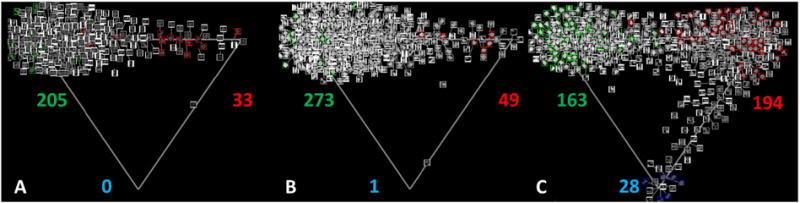
Identification and quantification of the characteristics of stem cell preparations is critical for understanding stem cell biology and for the development and manufacturing of stem cell based therapies. We have developed image analysis and visualization software that allows effective use of time-lapse microscopy to provide spatial and dynamic information from large numbers of human embryonic stem cell colonies. To achieve statistically relevant sampling, we examined >680 colonies from 3 different preparations of cells over 5days each, generating a total experimental dataset of 0.9 terabyte (TB). The 0.5 Giga-pixel images at each time point were represented by multi-resolution pyramids and visualized using the Deep Zoom Javascript library extended to support viewing Giga-pixel images over time and extracting data on individual colonies. We present a methodology that enables quantification of variations in nominally-identical preparations and between colonies, correlation of colony characteristics with Oct4 expression, and identification of rare events.

Keywords: Cell therapy; Fluorescence microscopy; Live cell imaging; Pluripotency; Stem cells.


Figures

Fig. 1
Fig. 1
(A) Schematic of all computational steps applied to the experimental replicas. ‘GFP Corrections’ operations are to correct for uneven illumination and detection, dark current, and background fluorescence, and are performed on the stitched composite image of 360 or 396 - FOV. A multi-resolution pyramid representation of each corrected and stitched 2D image was created. Then a set of temporal gigapixel images (which is a terabyte-sized data cube) is stored as a set of pyramids on a server to allow for efficient transmission and viewing of images. (B) Composite image of Oct4-GFP fluorescence of preparation 3 at one time point created by stitching 396 - FOV together into a single composite image. This 16-bit image for this one time point in the fluorescence channel is approximately 1 GB in size. Two colonies are enclosed in boxes and visualized in greater detail in (C). (C) A view of the colonies indicated in the composite image in greater detail using the Deep Zoom tool. Any colony from any image can be viewed in detail via a mouse-click, which produces the colony identification number and data for that colony including coordinates, and features such as average GFP intensity, area, circumference, etc. The full composite image or any subset of it can be panned, visualized in time-lapse mode, and recorded for saving as one or a series of TIFF or PNG files. A video demonstration of the operation of the Deep Zoom visualization tool is provided in Supplemental Movie 1.
Fig. 2
Fig. 2
Analysis of colony area and intensity over time. (A–C) Each trajectory represents the change in area of an individual colony over time for colonies from preparations 1–3, respectively. The colors of the lines indicate average intensity of GFP fluorescence as indicated by the color bar scale. Trajectories reflect the change in the area of a colony and the average intensity of those colonies during sequential frames between colony merger events. Each pixel area = 0.394 μm2 and each frame in the time series was acquired at 45 min intervals.
Fig. 3
Fig. 3
Quantifying apparent heterogeneity in Oct4 expression. (A–C) Representative colonies from preparation 3 showing phase contrast (top images) and fluorescence images of (A) a colony that is apparently homogeneous in Oct4 expression, (B) a colony that is heterogeneous in Oct4 expression, and (C) a colony that is not expressing Oct4. (D) Quantitation of heterogeneity was performed by texture analysis of 900 μm2 hexagons within colonies as depicted in the representative colony images; using a simplex algorithm, each colony in the preparation is assigned to a position on the triangle (2-simplex) according to its heterogeneity score: representative colonies that are either homogeneously bright (green), heterogeneous in GFP expression (red) or expressing little to no GFP (blue) are shown with their respective locations on the triangle.
Fig. 4
Fig. 4
Relative abundance of the different colony types for the 3 preparations. Representation of colonies in (A) preparation 1, (B) preparation 2 and (C) preparation 3, respectively, projected on a triangle (2-simplex) with each vertex corresponding to one of the three pure colony types. In each triangle, the upper left vertex corresponds to ‘homogeneous’ colonies, the upper right vertex corresponds to ‘heterogeneous’ colonies, and the lower vertex corresponds to ‘non-expressing’ colonies. Colonies from time frames 18, 52, and 85 were used in this analysis. The location of each colony within the triangle was determined by the automated classifier. The number of each colony type in each triangle is indicated with the color coded number: # of ‘homogeneous’ colonies in green, # of ‘heterogeneous’ colonies in red, and # of ‘non-expressing’ colonies in blue. The red and green framed colonies are examples of manually annotated colonies that were used to train the automated classifier. Access to the full size colony images and an interactive visualization of the automated classification of hexagonal sub-regions is available at https://isg.nist.gov/deepzoomweb/analysis.
Fig. 5
Fig. 5
(A–C) Simplex triangles for preparation 1, 2 and 3 respectively. The mean ‘homogeneous’, ‘heterogeneous’, and ‘non-expressing’ intensity and textural character of a colony over time is indicated by its location in the triangle. The upper left vertex corresponds to ‘homogeneous’; colonies, the upper right vertex corresponds to ‘heterogeneous’ colonies, and the lower vertex corresponds to ‘non-expressing’ colonies. The color of the marker relates to the scale bar on the right and indicates the magnitude of the temporal fluctuations of Oct4 character exhibited by the colony. The size of the marker indicates the colony area (i.e., the average number of hexagons associated with the colony over its lifetime) as shown in the scale in the lower right hand corner of (A). The minimum temporal fluctuation scores for homogeneous and heterogeneous colonies that appear stable are 0.05 and 0.1, respectively (as determined from Supplemental Movies 2–4 and 5–7).

References

    1. Ambrosetti DC, Schöler HR, Dailey L, Basilico C. Modulation of the activity of multiple transcriptional activation domains by the DNA binding domains mediates the synergistic action of Sox2 and Oct-3 on the fibroblast growth factor-4 enhancer. J Biol Chem. 2000;275:23387–23397. - PubMed
    1. Bajcsy P, et al. Interactive measurements of terabyte-sized 3D images. IEEE Computer. 2016 Jul; in press.
    1. Baker M. Reprogramming: faithful reporters. Nat Methods. 2012;9:231–234.
    1. Barbaric I, et al. Time-lapse analysis of human embryonic stem cells reveals multiple bottlenecks restricting colony formation and their relief upon culture adaptation. Stem cell reports. 2014;3:142–155. - PMC - PubMed
    1. Boyer LA, Mathur D, Jaenisch R. Molecular control of pluripotency. Current Opinion in Genetics & Development. 2006;16:455–462. - PubMed

Publication types

Substances

LinkOut - more resources