

Multiscale Modeling of Antibody-Drug Conjugates: Connecting Tissue and Cellular Distribution to Whole Animal Pharmacokinetics and Potential Implications for Efficacy
- PMID: 27287046
- PMCID: PMC4996726
- DOI: 10.1208/s12248-016-9940-z
Multiscale Modeling of Antibody-Drug Conjugates: Connecting Tissue and Cellular Distribution to Whole Animal Pharmacokinetics and Potential Implications for Efficacy
Abstract
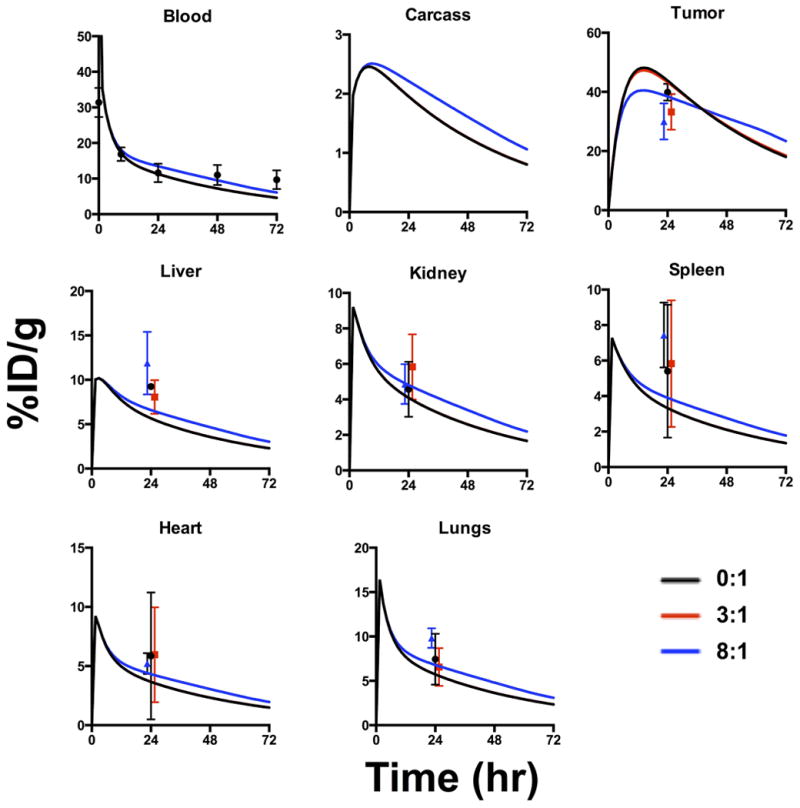
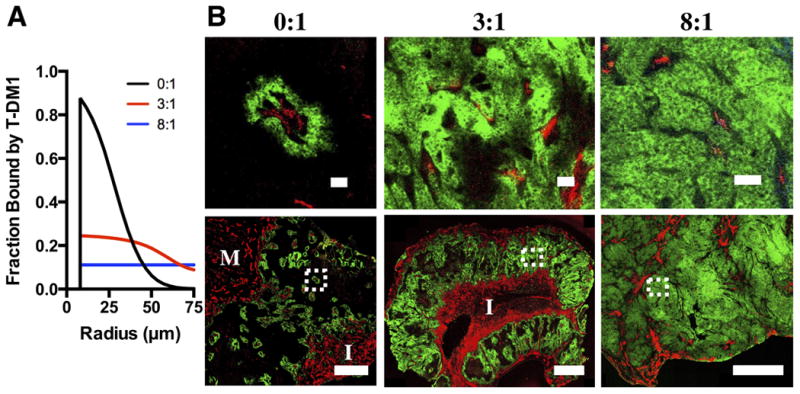
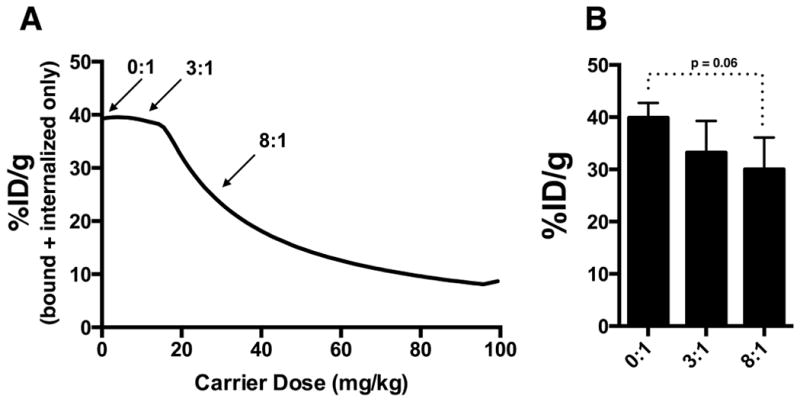
Antibody-drug conjugates exhibit complex pharmacokinetics due to their combination of macromolecular and small molecule properties. These issues range from systemic concerns, such as deconjugation of the small molecule drug during the long antibody circulation time or rapid clearance from nonspecific interactions, to local tumor tissue heterogeneity, cell bystander effects, and endosomal escape. Mathematical models can be used to study the impact of these processes on overall distribution in an efficient manner, and several types of models have been used to analyze varying aspects of antibody distribution including physiologically based pharmacokinetic (PBPK) models and tissue-level simulations. However, these processes are quantitative in nature and cannot be handled qualitatively in isolation. For example, free antibody from deconjugation of the small molecule will impact the distribution of conjugated antibodies within the tumor. To incorporate these effects into a unified framework, we have coupled the systemic and organ-level distribution of a PBPK model with the tissue-level detail of a distributed parameter tumor model. We used this mathematical model to analyze new experimental results on the distribution of the clinical antibody-drug conjugate Kadcyla in HER2-positive mouse xenografts. This model is able to capture the impact of the drug-antibody ratio (DAR) on tumor penetration, the net result of drug deconjugation, and the effect of using unconjugated antibody to drive ADC penetration deeper into the tumor tissue. This modeling approach will provide quantitative and mechanistic support to experimental studies trying to parse the impact of multiple mechanisms of action for these complex drugs.
Keywords: Herceptin; Kadcyla; Krogh cylinder; ado-trastuzumab emtansine; antibody tissue penetration; drug-antibody ratio (DAR).
Figures


Similar articles
-
A mechanistic pharmacokinetic model elucidating the disposition of trastuzumab emtansine (T-DM1), an antibody-drug conjugate (ADC) for treatment of metastatic breast cancer.AAPS J. 2014 Sep;16(5):994-1008. doi: 10.1208/s12248-014-9618-3. Epub 2014 Jun 11. AAPS J. 2014. PMID: 24917179 Free PMC article.
-
Modeling the efficacy of trastuzumab-DM1, an antibody drug conjugate, in mice.J Pharmacokinet Pharmacodyn. 2010 Jun;37(3):221-42. doi: 10.1007/s10928-010-9156-2. Epub 2010 Apr 28. J Pharmacokinet Pharmacodyn. 2010. PMID: 20424896
-
Improved Tumor Penetration and Single-Cell Targeting of Antibody-Drug Conjugates Increases Anticancer Efficacy and Host Survival.Cancer Res. 2018 Feb 1;78(3):758-768. doi: 10.1158/0008-5472.CAN-17-1638. Epub 2017 Dec 7. Cancer Res. 2018. PMID: 29217763 Free PMC article.
-
Ado-trastuzumab emtansine: a HER2-positive targeted antibody-drug conjugate.Ann Pharmacother. 2014 Nov;48(11):1484-93. doi: 10.1177/1060028014545354. Epub 2014 Jul 31. Ann Pharmacother. 2014. PMID: 25082874 Review.
-
ADME of antibody-maytansinoid conjugates.AAPS J. 2012 Dec;14(4):799-805. doi: 10.1208/s12248-012-9386-x. Epub 2012 Aug 9. AAPS J. 2012. PMID: 22875610 Free PMC article. Review.
Cited by
-
The promise and challenges of combination therapies with antibody-drug conjugates in solid tumors.J Hematol Oncol. 2024 Jan 4;17(1):1. doi: 10.1186/s13045-023-01509-2. J Hematol Oncol. 2024. PMID: 38178200 Free PMC article. Review.
-
An Agent-Based Systems Pharmacology Model of the Antibody-Drug Conjugate Kadcyla to Predict Efficacy of Different Dosing Regimens.AAPS J. 2020 Jan 15;22(2):29. doi: 10.1208/s12248-019-0391-1. AAPS J. 2020. PMID: 31942650 Free PMC article.
-
Antibody-Drug Conjugates: Pharmacokinetic/Pharmacodynamic Modeling, Preclinical Characterization, Clinical Studies, and Lessons Learned.Clin Pharmacokinet. 2018 Jun;57(6):687-703. doi: 10.1007/s40262-017-0619-0. Clin Pharmacokinet. 2018. PMID: 29188435 Free PMC article. Review.
-
QSP modeling of a transiently inactivating antibody-drug conjugate highlights benefit of short antibody half life.J Pharmacokinet Pharmacodyn. 2024 Dec 17;52(1):7. doi: 10.1007/s10928-024-09956-1. J Pharmacokinet Pharmacodyn. 2024. PMID: 39690276 Free PMC article.
-
Pharmacokinetic Characterization and Tissue Distribution of Fusion Protein Therapeutics by Orthogonal Bioanalytical Assays and Minimal PBPK Modeling.Molecules. 2020 Jan 26;25(3):535. doi: 10.3390/molecules25030535. Molecules. 2020. PMID: 31991858 Free PMC article.
References
-
- Shen BQ, Xu K, Liu L, Raab H, Bhakta S, Kenrick M, et al. Conjugation site modulates the in vivo stability and therapeutic activity of antibody-drug conjugates. Nat Biotechnol. 2012 Feb;30(2):184–9. - PubMed
-
- Lyon RP, Setter JR, Bovee TD, Doronina SO, Hunter JH, Anderson ME, et al. Self-hydrolyzing maleimides improve the stability and pharmacological properties of antibody-drug conjugates. Nat Biotechnol. 2014 Oct;32(10):1059–62. - PubMed
-
- Erickson HK, Park PU, Widdison WC, Kovtun YV, Garrett LM, Hoffman K, et al. Antibody-maytansinoid conjugates are activated in targeted cancer cells by lysosomal degradation and linker-dependent intracellular processing. Cancer Res. 2006 Apr 15;66(8):4426–33. - PubMed
-
- Wu AM, Senter PD. Arming antibodies: prospects and challenges for immunoconjugates. Nature Biotechnology. 2005 Sep;23(9):1137–46. - PubMed
Publication types
MeSH terms
Substances
Grants and funding
LinkOut - more resources
Full Text Sources
Other Literature Sources
Research Materials
Miscellaneous
