. 2016 Jun 10;11(1):44.
doi: 10.1186/s13024-016-0110-7.

Synaptophysin depletion and intraneuronal Aβ in organotypic hippocampal slice cultures from huAPP transgenic mice

Affiliations

Synaptophysin depletion and intraneuronal Aβ in organotypic hippocampal slice cultures from huAPP transgenic mice

Claire S Harwell et al. Mol Neurodegener. .

Abstract

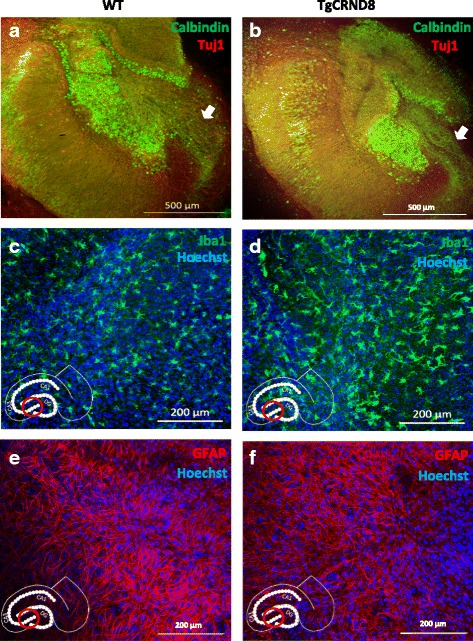
Background: To date, there are no effective disease-modifying treatments for Alzheimer's disease (AD). In order to develop new therapeutics for stages where they are most likely to be effective, it is important to identify the first pathological alterations in the disease cascade. Changes in Aβ concentration have long been reported as one of the first steps, but understanding the source, and earliest consequences, of pathology requires a model system that represents all major CNS cell types, is amenable to repeated observation and sampling, and can be readily manipulated. In this regard, long term organotypic hippocampal slice cultures (OHSCs) from neonatal amyloid mice offer an excellent compromise between in vivo and primary culture studies, largely retaining the cellular composition and neuronal architecture of the in vivo hippocampus, but with the in vitro advantages of accessibility to live imaging, sampling and intervention.

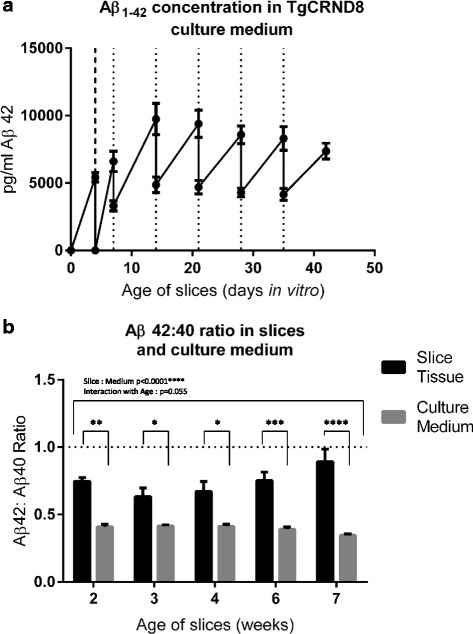
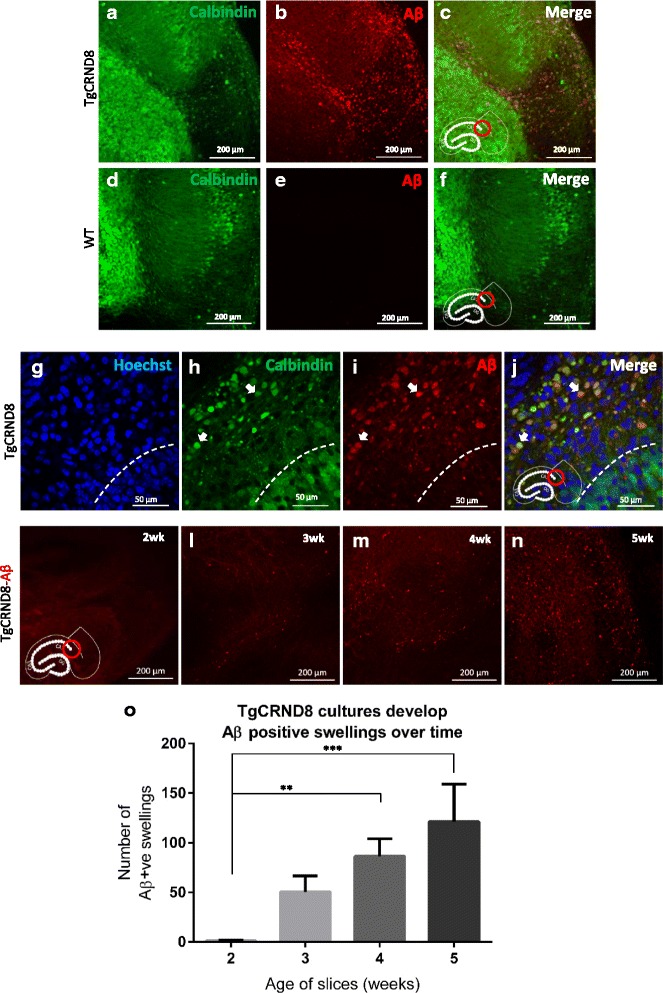
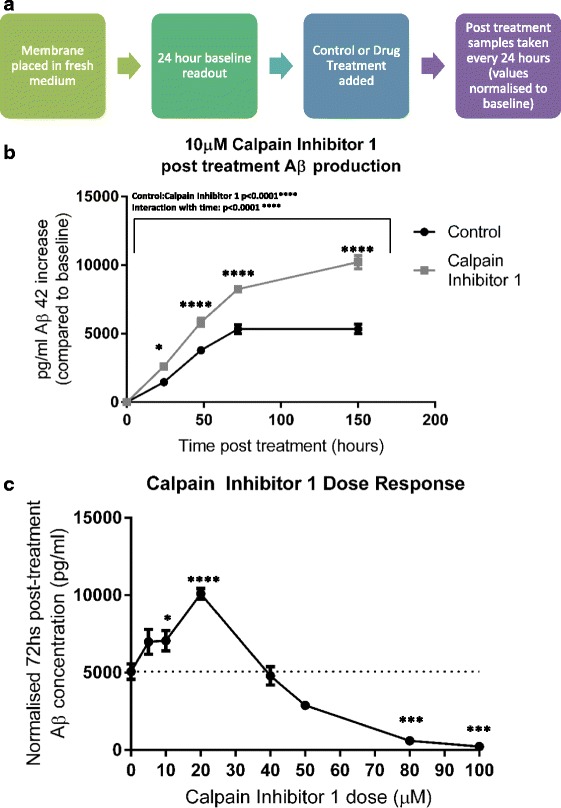
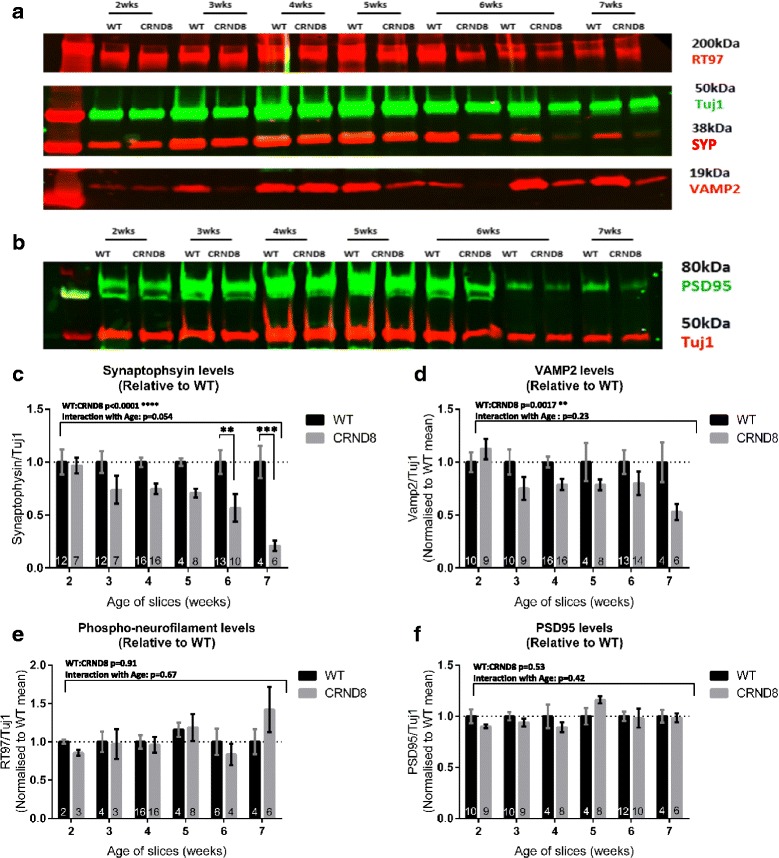
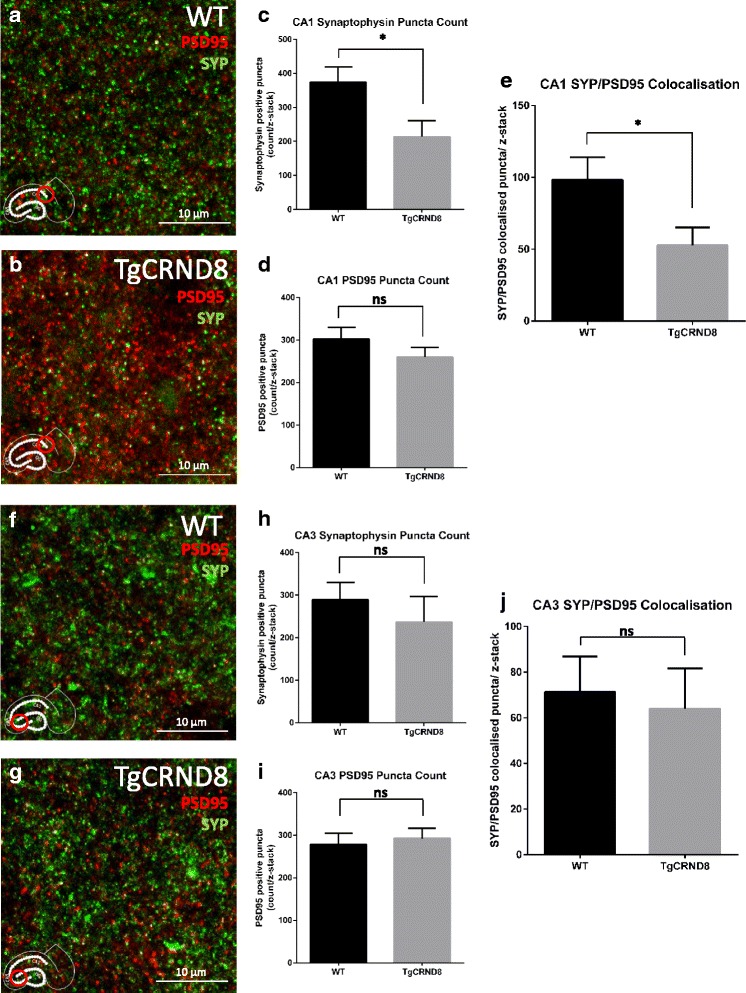
Results: Here, we report the development and characterisation of progressive pathological changes in an organotypic model from TgCRND8 mice. Aβ1-40 and Aβ1-42 rise progressively in transgenic slice culture medium and stabilise when regular feeding balances continued production. In contrast, intraneuronal Aβ continues to accumulate in close correlation with a specific decline in presynaptic proteins and puncta. Plaque pathology is not evident even when Aβ1-42 is increased by pharmacological manipulation (using calpain inhibitor 1), indicating that soluble Aβ species, or other APP processing products, are sufficient to cause the initial synaptic changes.

Conclusions: Organotypic brain slices from TgCRND8 mice represent an important new system for understanding mechanisms of Aβ generation, release and progressive toxicity. The pathology observed in these cultures will allow for rapid assessment of disease modifying compounds in a system amenable to manipulation and observation.

Keywords: Alzheimer’s disease; Amyloid; Intraneuronal Aβ; Organotypic brain slice; Synapses; TgCRND8.


Figures

Fig. 1
Fig. 1
OHSCs maintain hippocampal architecture and express a full complement of different cell types. a, b 7-week old WT (a) and TgCRND8 (b) slices stained for Calbindin (green Alexa-488) and Tuj1 (red Alexa-568). Arrowheads show axons projecting from the dentate gyrus c, d 5-week old WT (c) and TgCRND8 (d) slices showing microglia (Iba1- green Alexa 488) and nuclei (Hoechst- blue) e, f 7-week old WT (e) and TgCRND8 (f) slices showing astrocytes (GFAP-red Alexa568) and nuclei (Hoechst-blue). Image locations, where appropriate, are denoted by the red ring on the hippocampus diagram inset in each panel
Fig. 2
Fig. 2
Measurement of Aβ in TgCRND8 slice culture medium and slice tissue. a1-42 concentration in the culture medium was measured over time in vitro. Samples were first taken 4 days after plating, when medium was completely replaced (thick dashed line). At 7 div a further sample was taken before a 50 % feed (thin dashed line). Samples were then taken at weekly intervals, shortly before each 50 % medium exchange. There is a rapid rise in Aβ1-42 in the first 2 weeks in culture (shown by the gradient of the line between feeds), which slows after this point. Between 14 and 42 div production rate and removal are fairly well balanced, such that concentration lies between 5, 000 and 10,000 pg/ml between feeds. This corresponds to 1.1-2.2nM Aβ1-42. (n = 5 membranes, each from a different mouse (biological replicates)) (b) Comparison of Aβ1-40 and Aβ1-42 in the culture medium and slices homogenised in 5 M guanidine. Whilst Aβ1-40 is the predominant species in both sample types, Aβ1-42: Aβ1-40 ratio is significantly higher in slice tissue than in the medium throughout the culture period (2 way ANOVA p < 0.0001) indicating a greater proportion of Aβ1-42 is retained within the slice. There is a trend to this ratio difference increasing with age (2 way ANOVA p = 0.055). Star values comparing slice tissue and culture medium represent multiple comparisons from the ANOVA analysis. (n = 4 membranes per timepoint/sample type. Membranes in each timepoint were from different mice)
Fig. 3
Fig. 3
Intraneuronal Aβ accumulation in axons projecting from CA1. Where appropriate, image locations are denoted by the red ring on the hippocampus diagram inset in each panel. a-c Accumulation of Aβ in the CA1 region of a 5-week old TgCRND8 slice (d-f) no such Aβ staining is apparent in the same region in WT slices. g-j High magnification imaging of the Aβ containing region in a 6-week old old TgCRND8 slice. The cell bodies of CA1 (stained with calbindin) lie below the dashed line in these images. There is no strong colocalisation of Aβ with calbindin in this region, and no colocalisation with Hoechst, demonstrating lack of Aβ within the cell bodies of CA1. Above the dashed line lies the alveus, an axonal tract containing calbindin positive axons derived from CA1 (h). Many of these axons have large swellings, which do not colocalise with Hoechst (demonstrating these swellings are not cell bodies). There is however extensive colocalisation of these axonal swellings with Aβ (i) as indicated by the arrow heads. k-n 2,3, 4 and 5-week old TgCRND8 slices stained with MOAB reveal a progressive accumulation of Aβ positive swellings. o Quantification of Aβ positive swellings (total count) in 2-5-week old old slices. There is a significant increase in these structures over time (1 way ANOVA p < 0.05, n = 12 slices per timepoint (3 slices per mouse))
Fig. 4
Fig. 4
Treatment with Calpain Inhibitor 1 increases Aβ accumulation in TgCRND8 slice culture medium (a) Protocol for testing the effect of drug treatments. The slice membrane is placed in fresh maintenance medium and left for 24 hs. A 50 μL sample of medium is then taken to act as a “24 h baseline production” readout. Calpain Inhibitor 1 (or DMSO control) is then added to the culture, with treated medium allowed to soak through the slice from above. Timepoints are then taken at 24, 48, 72 and 150 hs post treatment and normalised to the 24 h baseline readout. (b) 10 μM Calpain Inhibitor 1 increases Aβ accumulation in slice culture medium to almost double that of control. (2 way ANOVA p < 0.0001(Large bar above) (stars on graph represent significance between treated and untreated at each timepoint via ANOVA multiple comparisons). Results are pooled from 3 independent experiments. n = 9 membranes per treatment (2 membranes arise from each mouse and are split between treated and control, so all samples within a condition are from different animals) (c) By changing dosage of Calpain Inhibitor 1 and sampling at 24 h baseline, then 72 h post treatment, a dose-response curve is revealed; 20 μM giving peak production, whilst concentrations above 40 μM reduce Aβ production to below that of control levels (1 Way ANOVA p < 0.05 (stars represent significant deviation from 0 μM treatment) n numbers: 0 μM = 11, 5 μM = 5, 10 μM = 12, 20 μM = 12, 40 μM = 5, 50 μM = 2, 80 μM = 3, 100 μM = 3. (Note n numbers are lower above 40 μM due to increased off-target toxicity in the culture system. All membranes used in each dose condition originated from different animals))
Fig. 5
Fig. 5
Quantification of synaptic protein levels using Western Blot. a, b Representative Western Blot of 2-7-week old WT and TgCRND8 slices probed for RT97 (phosphorylated neurofilament), Tuj1, Synaptophysin (SYP) and VAMP2 (a) or PSD95 and Tuj1 (b). c Synaptophysin levels (normalised to Tuj1) are decreased in TgCRND8 relative to WT (two way ANOVA p < 0.0001). There is a trend to this difference increasing with culture age (two way ANOVA p = 0.054), with 6 and 7-week old TgCRND8 cultures showing the greatest deficiency in synaptophysin (two way ANOVA multiple comparisons p < 0.05). d VAMP2 is also decreased in TgCRND8 cultures (two way ANOVA p = 0.0017) although the relationship with age is not clear (p = 0.23). There is no alteration in the levels of phosphorylated neurofilament (p = 0.91) (e) or PSD95 (p = 0.53) (f) demonstrating the losses seen are likely specific to presynaptic compartments. The large bar at the top of each graph displays tabular results from the two way ANOVA whilst individual bars on the graph show significant multiple comparisons. N numbers are written in the base of each bar, and represent the number of individual membranes (consisting of 3 slices extracted together and run in a single gel lane) from different mice
Fig. 6
Fig. 6
Region specific pre-synaptic puncta loss in TgCRND8 slices. a, b Representative maximal intensity projections of z-stacks taken from the CA1 field (same location as Aβ positive axonal swellings) in 5-week old WT (a) and TgCRND8 (b) slices. The presynaptic marker synaptophysin (SYP) is stained green, whilst the postsynaptic marker PSD95 is stained red. c, d, e Quantification of the z-stacks was performed using an image J plugin (available on request from: c.eroglu@cellbio.duke.edu). There was a reduction in synaptophysin positive puncta in TgCRND8 slices (p = 0.025) (c) whilst the number of PSD95 positive puncta was unchanged between genotypes (p = 0.25) (d). The number of colocalised puncta (Synaptophysin/ PSD95 positive) was also reduced (p = 0.038) (e). f, g Z-stacks taken from the CA3 field (largely unaffected by Aβ-positive swellings) in 5-week old WT (f) and TgCRND8 (g) slices revealed no such differences in synaptophysin positive puncta (p = 0.48) (h), PSD95 (p = 0.69) (i) or colocalised structures (p = 0.75) (j). Analysis for each region consisted of n = 8 individual membranes, 3 slices per membrane (slices on each membrane are from different mice). For each membrane value, data was averaged from 3 slices, with 5 z-stacks per slice) with P values calculated using a students t-test

Similar articles

Cited by

References

    1. Gómez-Isla T, Hollister R, West H, Mui S, Growdon JH, Petersen RC, et al. Neuronal loss correlates with but exceeds neurofibrillary tangles in Alzheimer’s disease. Ann Neurol. 1997;41:17–24. doi: 10.1002/ana.410410106. - DOI - PubMed
    1. Selkoe DJ. Alzheimer’s disease is a synaptic failure. Science. 2002;298:789–91. doi: 10.1126/science.1074069. - DOI - PubMed
    1. Lacor PN. Advances on the understanding of the origins of synaptic pathology in AD. Curr Genomics. 2007;8:486. doi: 10.2174/138920207783769530. - DOI - PMC - PubMed
    1. Serrano-Pozo A, Frosch MP, Masliah E, Hyman BT. Neuropathological alterations in Alzheimer Disease. Cold Spring Harb Perspect Med. 2011;1:a006189. doi: 10.1101/cshperspect.a006189. - DOI - PMC - PubMed
    1. Lue L-F, Kuo Y-M, Roher AE, Brachova L, Shen Y, Sue L, et al. Soluble amyloid β peptide concentration as a predictor of synaptic change in Alzheimer’s disease. Am J Pathol. 1999;155:853–62. doi: 10.1016/S0002-9440(10)65184-X. - DOI - PMC - PubMed

Publication types