. 2017 Jan;28(1):166-184.
doi: 10.1681/ASN.2015060672. Epub 2016 Jun 10.

Krüppel-Like Factor 15 Mediates Glucocorticoid-Induced Restoration of Podocyte Differentiation Markers

Affiliations

Krüppel-Like Factor 15 Mediates Glucocorticoid-Induced Restoration of Podocyte Differentiation Markers

Sandeep K Mallipattu et al. J Am Soc Nephrol. 2017 Jan.

Abstract

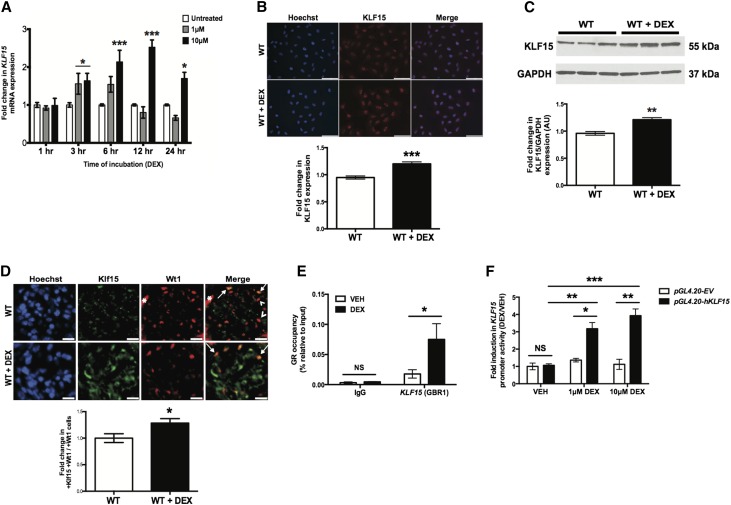
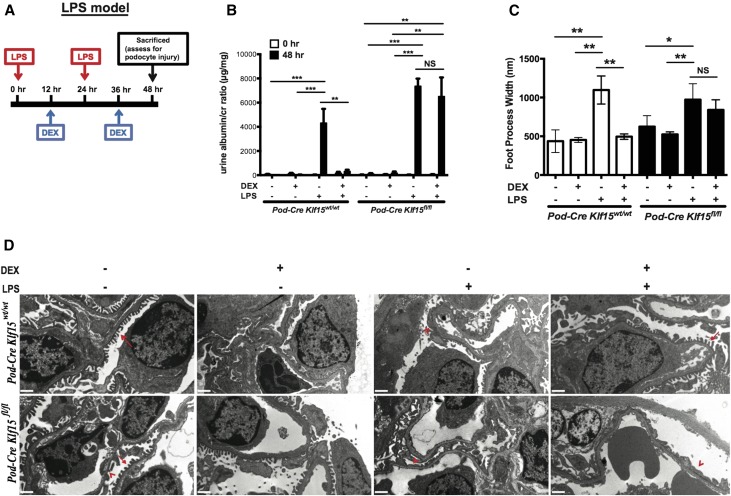
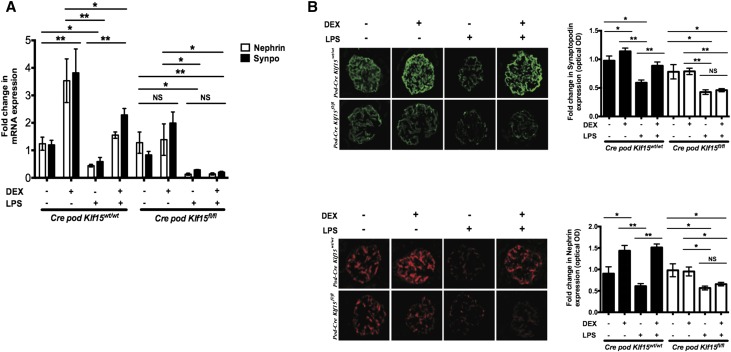
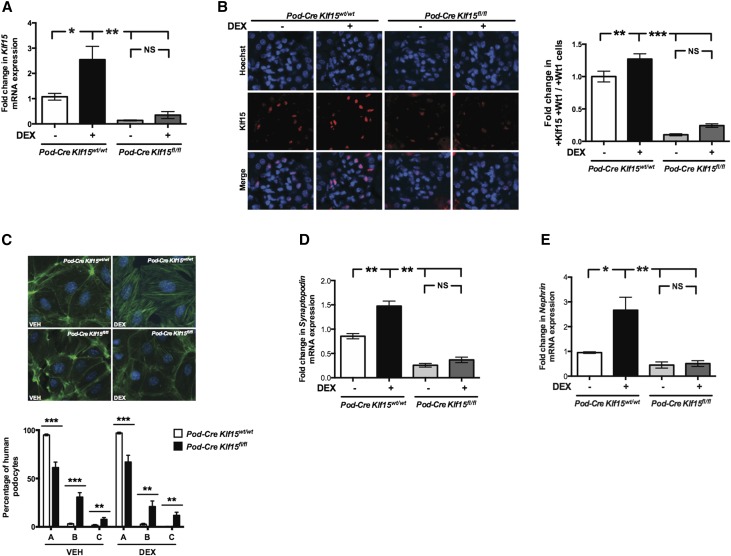
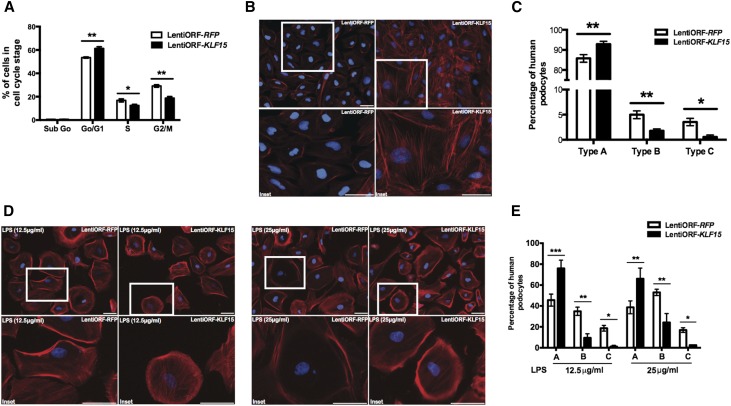
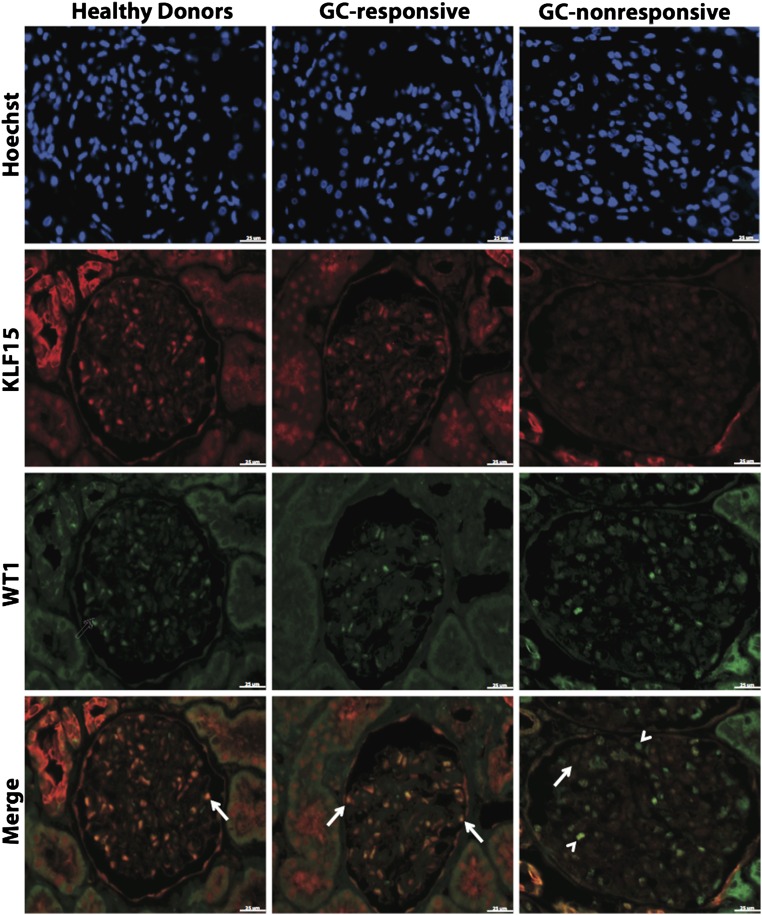
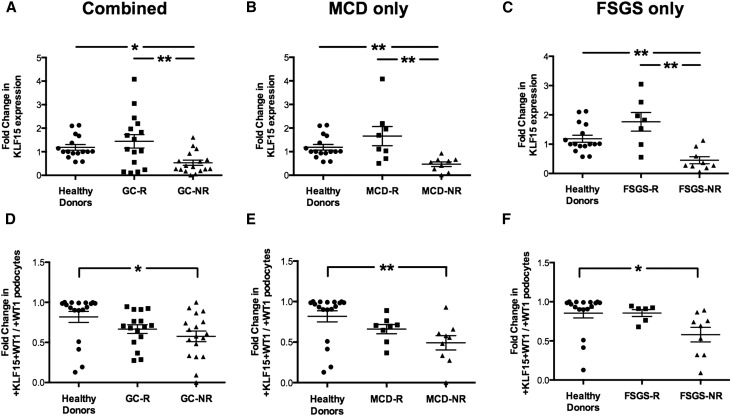
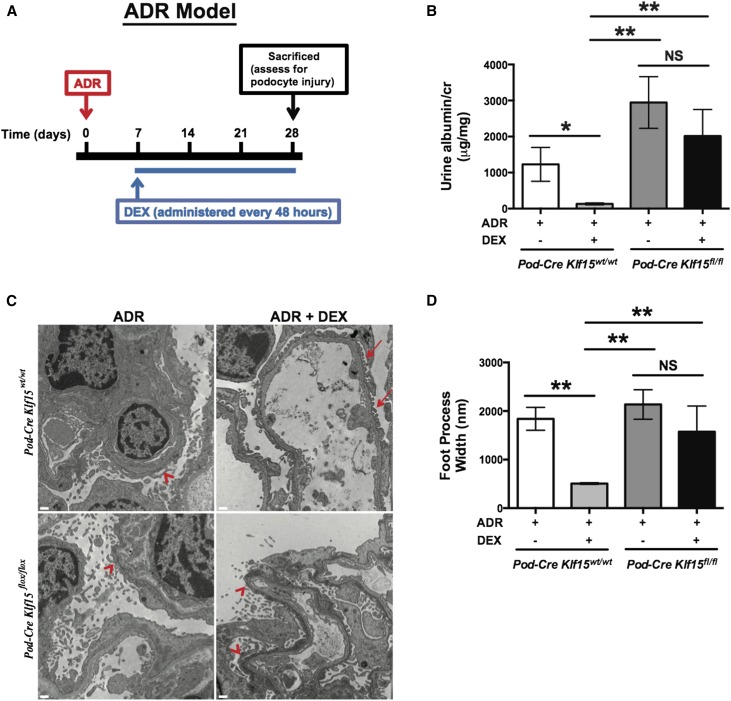
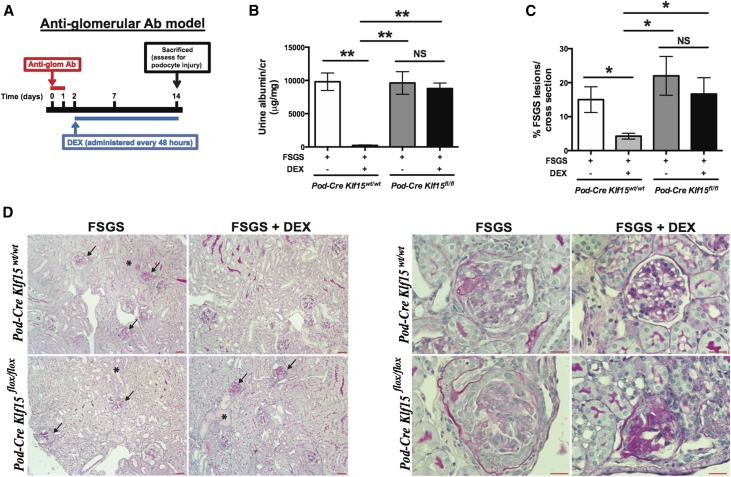
Podocyte injury is the inciting event in primary glomerulopathies, such as minimal change disease and primary FSGS, and glucocorticoids remain the initial and often, the primary treatment of choice for these glomerulopathies. Because inflammation is not readily apparent in these diseases, understanding the direct effects of glucocorticoids on the podocyte, independent of the immunomodulatory effects, may lead to the identification of targets downstream of glucocorticoids that minimize toxicity without compromising efficacy. Several studies showed that treatment with glucocorticoids restores podocyte differentiation markers and normal ultrastructure and improves cell survival in murine podocytes. We previously determined that Krüppel-like factor 15 (KLF15), a kidney-enriched zinc finger transcription factor, is required for restoring podocyte differentiation markers in mice and human podocytes under cell stress. Here, we show that in vitro treatment with dexamethasone induced a rapid increase of KLF15 expression in human and murine podocytes and enhanced the affinity of glucocorticoid receptor binding to the promoter region of KLF15 In three independent proteinuric murine models, podocyte-specific loss of Klf15 abrogated dexamethasone-induced podocyte recovery. Furthermore, knockdown of KLF15 reduced cell survival and destabilized the actin cytoskeleton in differentiated human podocytes. Conversely, overexpression of KLF15 stabilized the actin cytoskeleton under cell stress in human podocytes. Finally, the level of KLF15 expression in the podocytes and glomeruli from human biopsy specimens correlated with glucocorticoid responsiveness in 35 patients with minimal change disease or primary FSGS. Thus, these studies identify the critical role of KLF15 in mediating the salutary effects of glucocorticoids in the podocyte.

Keywords: focal segmental glomerulosclerosis; glucocorticoid; minimal change disease; podocyte.


Figures

Figure 1.
Figure 1.
KLF15 expression is increased with DEX treatment. Cultured human podocytes were initially differentiated for 14 days and subsequently treated with either DEX or vehicle (VEH) for 12 hours. RNA was extracted, and real-time PCR was performed. (A) KLF15 mRNA expression was compared between cultured human podocytes treated with and without DEX (n=6). *P<0.05; ***P<0.001 versus all groups (two–way ANOVA test with Tukey post-test). (B) Immunofluorescence staining for KLF15 with and without DEX for 12 hours is shown. The representative images of six independent experiments are shown in the upper panel. Magnification, ×20. In the lower panel, the intensity of KLF15 expression was quantified (n=6). ***P<0.001 (unpaired t test). (C) Protein was also extracted, and Western blot analysis for Klf15 was performed. The representative blot of three independent experiments is shown. The lower panel shows the quantification of Klf15 by densitometry (n=3). **P<0.01 (Mann–Whitney test). (D) This was confirmed by immunofluorescence using tissue from wild-type (WT) mice treated with and without DEX. The representative pictures of four mice in each group are shown in the upper panel. Arrows show colocalization of Klf15 and Wt1. Arrowheads show a lack of colocalization. Magnification, ×20. *Nonspecific Wt1 staining in the untreated WT mice. In the lower panel, in total, 30 glomeruli per mouse were selected, and quantification of Klf15 staining in the podocytes was determined by the ratio of Klf15+ and Wt1+ cells to Wt1+ cells (n=6). *P<0.05 (unpaired t test). (E) ChIP assay was performed to show the presence of GR binding in the promoter of KLF15 in differentiated human podocytes treated with DEX (10 μM) or VEH for 12 hours. IgG serves as control (n=6). *P<0.05 (Mann–Whitney test). (F) Human podocytes were transfected with reporter construct directed at the KLF15 promoter region (pGL4.20-hKLF15) or empty vector (pGL4.20-EV). Fold induction in KLF15 promoter activity is shown with DEX (1 or 10 μM) treatment compared with VEH-treated cells (n=6). *P<0.05; **P<0.01; ***P<0.001 (two–way ANOVA test with Tukey post-test).
Figure 2.
Figure 2.
LPS–treated Podocin-Cre Klf15flox/flox mice exhibit a lack of recovery in albuminuria and foot process effacement with DEX administration. Podocin-Cre Klf15flox/flox and Podocin-Cre Klf15+/+ mice were concurrently treated with either DEX or vehicle after LPS treatment. Urine was collected weekly, mice were euthanized, and renal cortex was fixed for histology 48 hours post-LPS treatment. (A) Schematic diagram of LPS and DEX treatment protocols. (B) Albuminuria (urine albumin-to-creatinine ratio) was measured (n=6). **P<0.01; ***P<0.001 (two–way ANOVA test with Tukey post-test). (C) Electron microscopy was performed to assess ultrastructural changes in podocyte morphology. Foot process width was quantified by counting the number of slits per length of glomerular basement membrane with ImageJ. *P<0.05; **P<0.01 (Kruskal–Wallis test with Dunn post-test). (D) The representative images from four mice in each group are shown. Red arrows show normal upright foot processes. Red arrowheads show foot process effacement. Magnification, ×10,000.
Figure 3.
Figure 3.
LPS–treated Podocin-Cre Klf15flox/flox mice exhibit a lack of restoration of podocyte differentiation markers with DEX administration. Podocin-Cre Klf15flox/flox and Podocin-Cre Klf15+/+ mice were concurrently treated with either DEX or vehicle after LPS treatment. All mice were euthanized, glomeruli were isolated, and RNA were extracted for real-time PCR. (A) Nephrin and Synaptopodin mRNA expression levels are shown relative to untreated mice (n=6). *P<0.05; **P<0.01 (two–way ANOVA test with Tukey post-test). (B) Immunostaining for Synaptopodin (upper panel) and Nephrin (lower panel) was performed in all groups of mice. Representative images from four mice in each group are shown. The glomerular region was selected, and OD was measured and quantified as a relative fold change to untreated mice for Synaptopodin (upper right panel; n=6) and Nephrin (lower right panel; n=6). Magnification, ×20. *P<0.05; **P<0.01 (Kruskal–Wallis test with Dunn post-test).
Figure 4.
Figure 4.
Podocyte-specific loss of Klf15 abrogates DEX-mediated increase in podocyte differentiation markers. Primary podocytes were isolated from 12-week-old Podocin-Cre Klf15flox/flox and Podocin-Cre Klf15+/+ mice and cultured at 37°C for 1 week. Cells were subsequently treated with DEX or vehicle (VEH) for 12 hours. RNA was extracted, and real-time PCR was performed for (A) Klf15 mRNA expression (n=6). *P<0.05; **P<0.01 (Kruskal–Wallis test with Dunn post-test). (B) Immunostaining for Klf15 was performed. Representative images from three mice in each group are shown (left panel). Quantification for Klf15 expression in podocytes was determined by the ratio of Klf15+ and Wt1+ cells to W11+ cells (n=3). Magnification, ×20. **P<0.01; ***P<0.001 (Kruskal–Wallis test with Dunn post-test). (C) Phalloidin and hoechst staining was performed in isolated primary podocytes. The representative images from three independent experiments are shown. In total, 100 cells were selected in each group, and the cells were classified into type A (>90% of cell area filled with thick cables), type B (no thick cables but some cables present), and type C (no cables visible in the central area of the cell; n=3). **P<0.01; ***P<0.001 (unpaired t test). (D) Nephrin mRNA expression (n=6) and (E) Synaptopodin mRNA expression (n=6). *P<0.05; **P<0.01 (Kruskal–Wallis test with Dunn post-test).
Figure 5.
Figure 5.
Overexpression of KLF15 increases the number of cells in G0/G1 phase and actin stress fiber formation. Human podocytes with overexpression for KLF15 (lentiORF-KLF15) and control vector (lentiORF-RFP) were generated. To identify the percentage of cells in G0/G1 phase, confluent lentiORF-KLF15 and lentiORF-RFP human podocytes under permissive conditions (33°C) were harvested for FACS, and cell cycle analysis was performed. (A) Percentages of human podocytes in sub-G0, G0/G1, S, and G2/M phases are shown (n=4). *P<0.05; **P<0.01 (Mann–Whitney test). (B) Phalloidin and hoechst staining was performed in lentiORF-KLF15 and lentiORF-RFP human podocytes under permissive conditions. The representative images from three independent experiments are shown. (C) In total, 150 cells were selected in each group, and the cells were classified into type A (>90% of cell area filled with thick cables), type B (no thick cables but some cables present), or type C (no cables visible in the central area of the cell; n=3). *P<0.05; **P<0.01 (unpaired t test). (D) Next, lentiORF-KLF15 and lentiORF-RFP human podocytes were differentiated at 37°C for 14 days and treated with LPS (12.5 and 25 μg/ml) for 24 hours. Phalloidin and hoechst staining was performed in LPS–treated lentiORF-KLF15 and lentiORF-RFP differentiated human podocytes. The representative images from three independent experiments are shown. (E) In total, 150 cells were selected in each group, and the cells were classified into type A, type B, or type C (n=3). *P<0.05; **P<0.01; ***P<0.001 (unpaired t test).
Figure 6.
Figure 6.
Reduced KLF15 expression in GC-NR MCD and primary FSGS. Immunofluorescence for Hoechst, KLF15, and WT1 was performed in kidney biopsy specimens from 16 healthy donor nephrectomies and 15 GC-R and 20 GC-NR patients. The representative images from each group are shown. Arrows show colocalization of KLF15 and WT1. Arrowheads show a lack of colocalization. Magnification, ×20.
Figure 7.
Figure 7.
Reduced podocyte and glomerular expression of KLF15 in GC-NR MCD and primary FSGS. Immunofluorescence for Hoechst, KLF15, and WT1 was performed in kidney biopsy specimens from 16 healthy donor nephrectomies and 15 GC-R and 20 GC-NR patients. Fifteen glomeruli per biopsy specimens were selected, and quantification of KLF15 staining in the glomerulus was performed. (A–C) ImageJ was used to quantify the intensity of KLF15 expression in the glomerulus in all three groups, MCD only, and FSGS only. The glomerular region was selected, and OD was measured and quantified as a relative fold change to healthy subjects. *P<0.05; **P<0.01 (Kruskal–Wallis test with Dunn post-test). (D–F) Quantification of KLF15 staining in the podocytes was determined by the ratio of KLF15+ and WT1+ cells to WT1+ cells. *P<0.05; **P<0.01 (Kruskal–Wallis test with Dunn post-test).
Figure 8.
Figure 8.
ADR–treated Podocin-Cre Klf15flox/flox mice exhibit a lack of recovery in albuminuria and foot process effacement after DEX administration. Podocin-Cre Klf15flox/flox and Podocin-Cre Klf15+/+ mice were initially treated with ADR (18 mg/kg) with subsequent administration of DEX (2 mg/kg every 48 hours) starting on day 7. Urine was collected weekly, mice were euthanized, and renal cortex was fixed for histology 4 weeks post-ADR treatment. (A) Schematic diagram of ADR and DEX treatment protocol. (B) Albuminuria (urine albumin-to-creatinine ratio) was measured (n=6). *P<0.05; **P<0.01 (Kruskal–Wallis test with Dunn post-test). (C) Electron microscopy was performed to assess ultrastructural changes in podocyte morphology. The representative images from four mice in each group are shown. Red arrows show normal upright foot processes. Red arrowheads show foot process effacement. Magnification, ×10,000. (D) Foot process width was quantified by counting the number of slits per length of glomerular basement membrane with ImageJ. **P<0.01 (Kruskal–Wallis test with Dunn post-test).
Figure 9.
Figure 9.
Antiglomerular antibody–treated Podocin-Cre Klf15flox/flox mice exhibit a lack of recovery in albuminuria and FSGS lesions after DEX administration. Podocin-Cre Klf15flox/flox and Podocin-Cre Klf15+/+ mice were initially treated with sheep antiglomerular antibody (5 mg/20 g body wt) with subsequent administration of DEX (2 mg/kg every 48 hours) starting on day 2. Urine was collected weekly, mice were euthanized, and renal cortex was fixed for histology 2 weeks after antiglomerular antibody treatment. (A) Schematic diagram of antiglomerular antibody and DEX treatment protocol. (B) Albuminuria (urine albumin-to-creatinine ratio) was measured (n=4). **P<0.01 (Kruskal–Wallis test with Dunn post-test). (C) All mice were euthanized, and renal cortex was fixed for histology. Periodic acid–Schiff was performed to evaluate for glomerular or tubulointerstitial changes. The percentage of FSGS lesions per cross-section was quantified in a blinded fashion. *P<0.05 (Kruskal–Wallis test with Dunn post-test). (D) The representative images from four mice in each group are shown. Arrows show FSGS lesions. Magnification, ×10 in left panel; ×40 in right panel. *Tubular dilation and proteinaceous casts.

References

    1. Wiggins RC: The spectrum of podocytopathies: A unifying view of glomerular diseases. Kidney Int 71: 1205–1214, 2007 - PubMed
    1. Meyrier A: Mechanisms of disease: Focal segmental glomerulosclerosis. Nat Clin Pract Nephrol 1: 44–54, 2005 - PubMed
    1. Barisoni L: Podocyte biology in segmental sclerosis and progressive glomerular injury. Adv Chronic Kidney Dis 19: 76–83, 2012 - PubMed
    1. Barnes PJ: Anti-inflammatory actions of glucocorticoids: Molecular mechanisms. Clin Sci (Lond) 94: 557–572, 1998 - PubMed
    1. Riccardi C, Bruscoli S, Migliorati G: Molecular mechanisms of immunomodulatory activity of glucocorticoids. Pharmacol Res 45: 361–368, 2002 - PubMed

MeSH terms