. 2016 Nov-Dec;16(6):995-1004.
doi: 10.1016/j.pan.2016.05.393. Epub 2016 Jun 1.

Pancreatic stellate cells regulate blood vessel density in the stroma of pancreatic ductal adenocarcinoma

Affiliations

Pancreatic stellate cells regulate blood vessel density in the stroma of pancreatic ductal adenocarcinoma

Francesco Di Maggio et al. Pancreatology. 2016 Nov-Dec.

Abstract

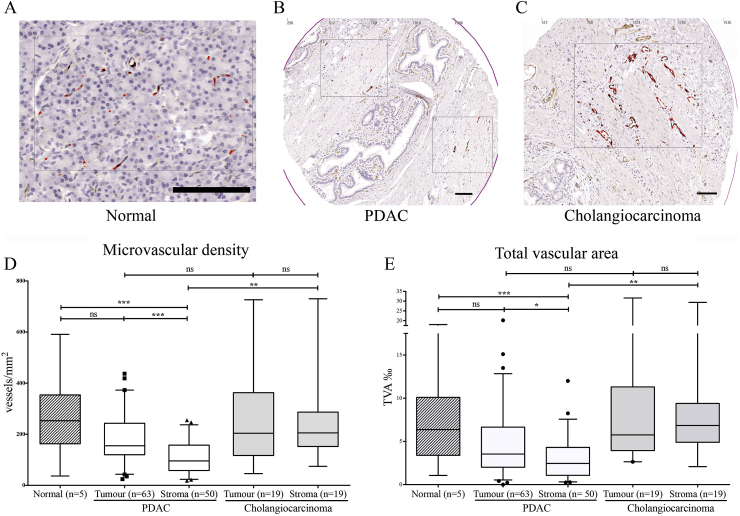
Background/objectives: The vascular heterogeneity of pancreatic ductal adenocarcinoma (PDAC) has never been characterised. We analysed the heterogeneous vascular density of human PDAC along with its prognostic correlation.

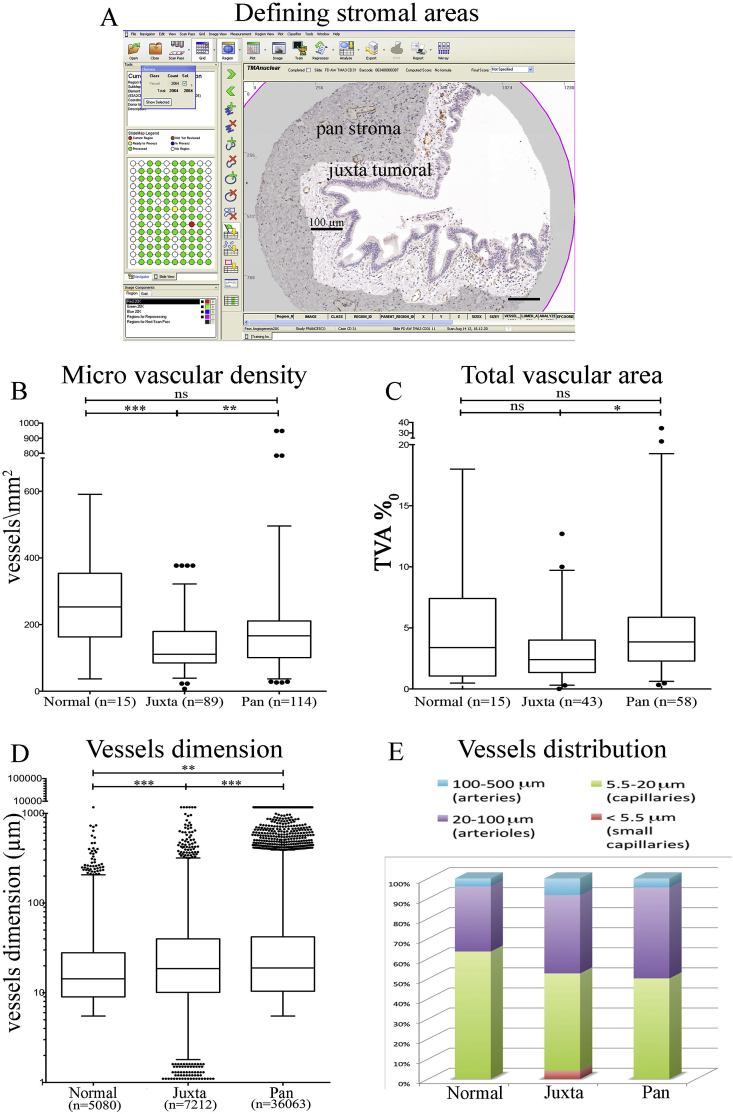
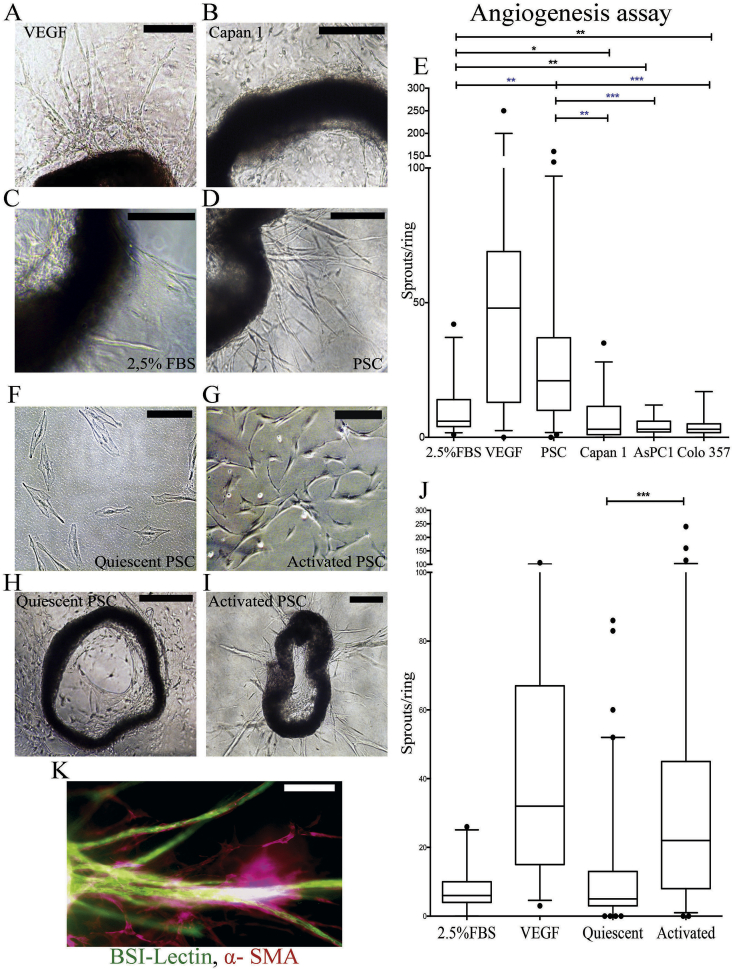
Methods: Tissue Microarrays of 87 patients with different pancreatico-biliary pathologies were analysed in an automated manner (Ariol™) after CD31 staining to assess vascular density in juxta-tumoral and panstromal compartments. In vitro and ex vivo assays were carried out to assess the role of PSC.

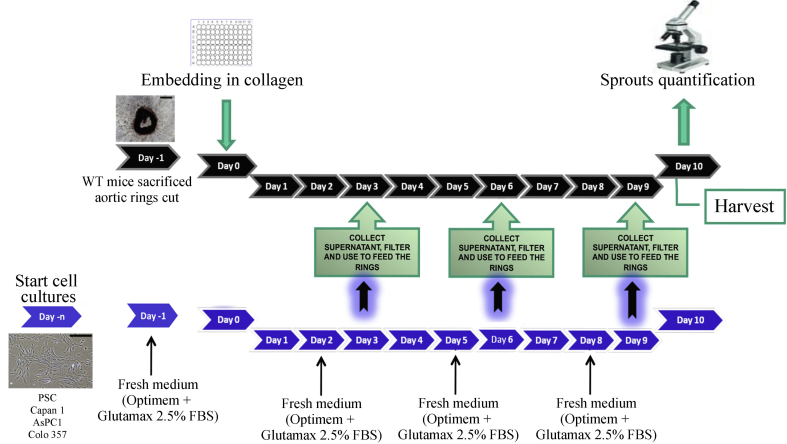
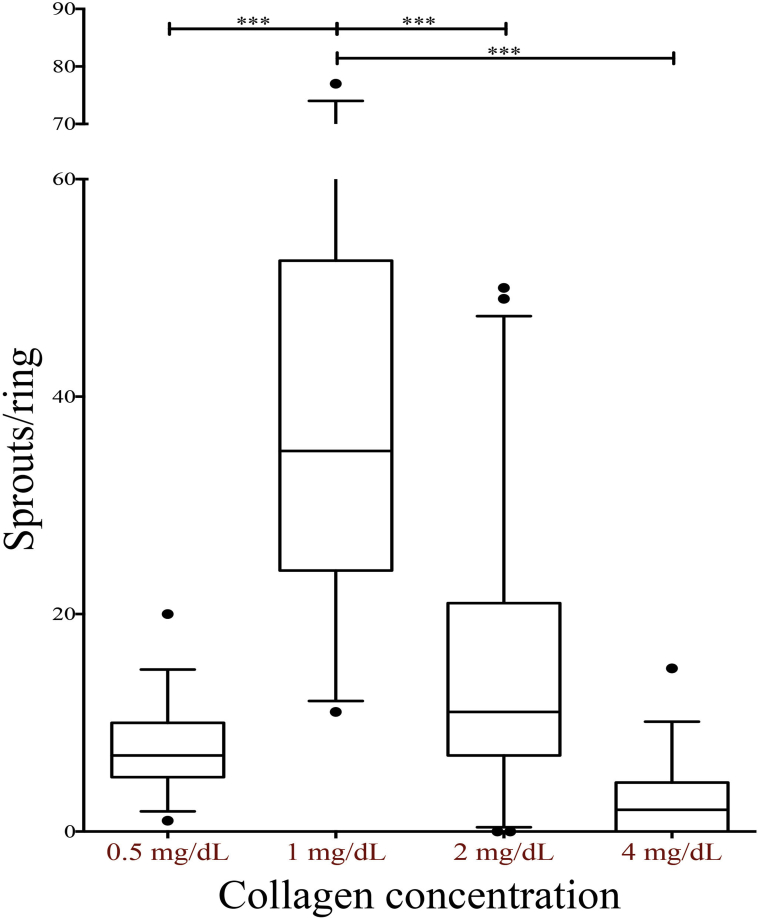
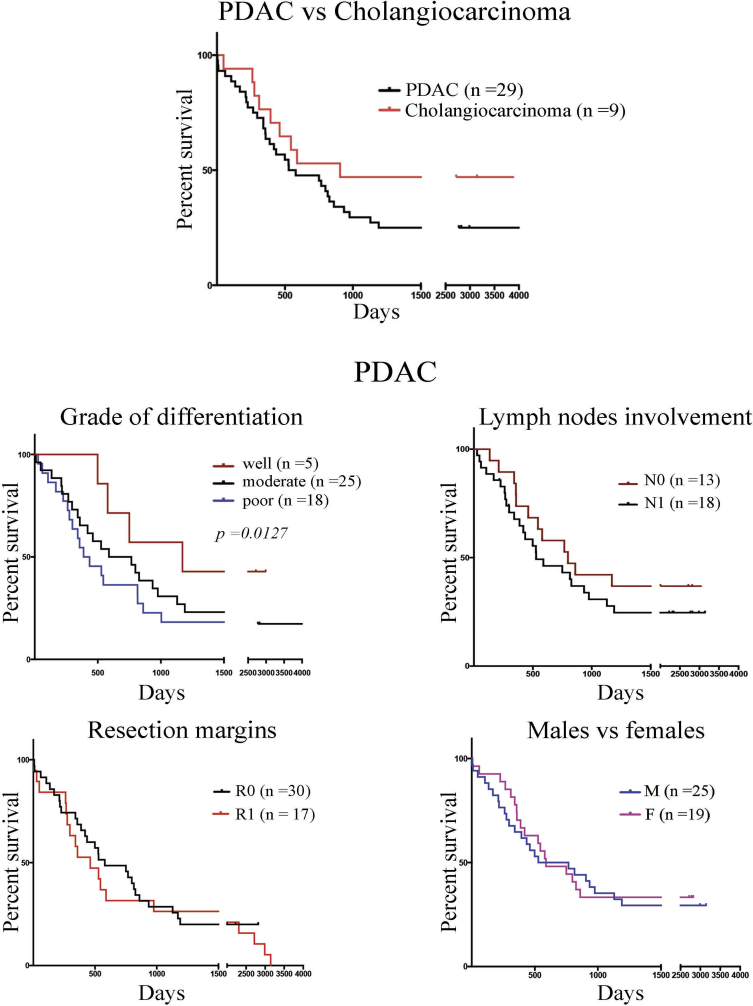
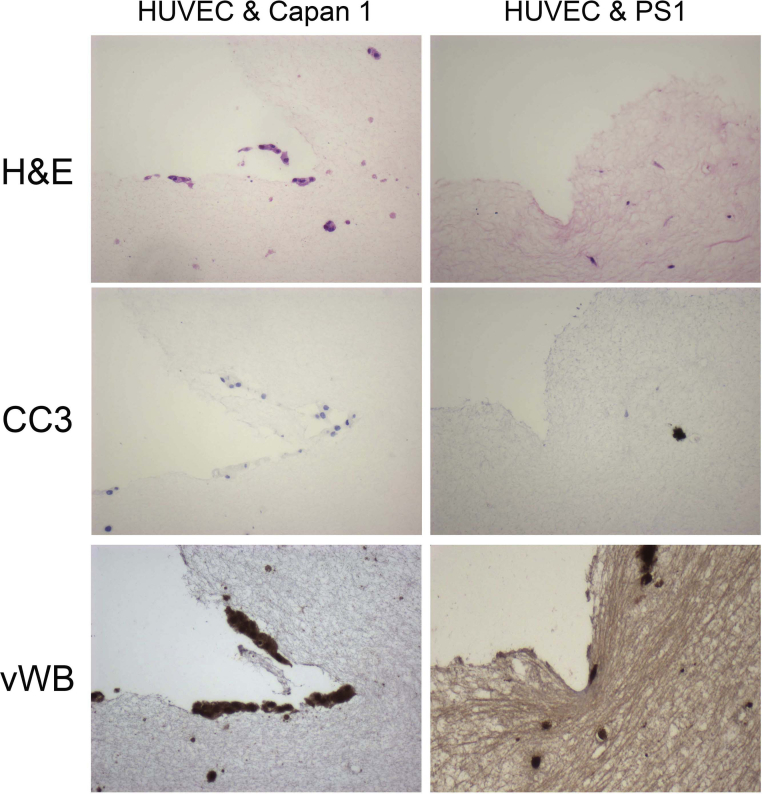
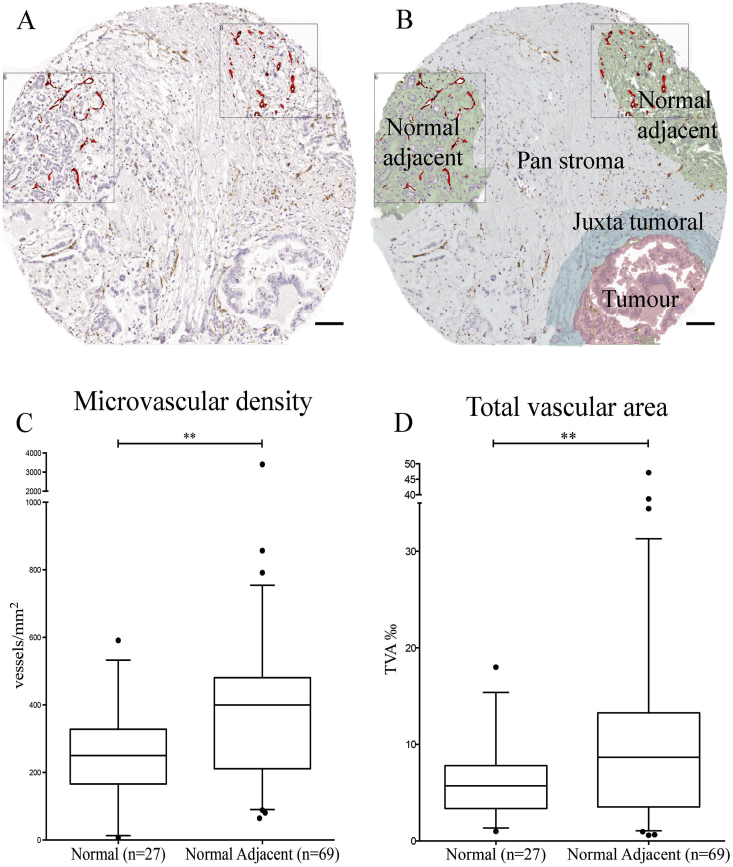
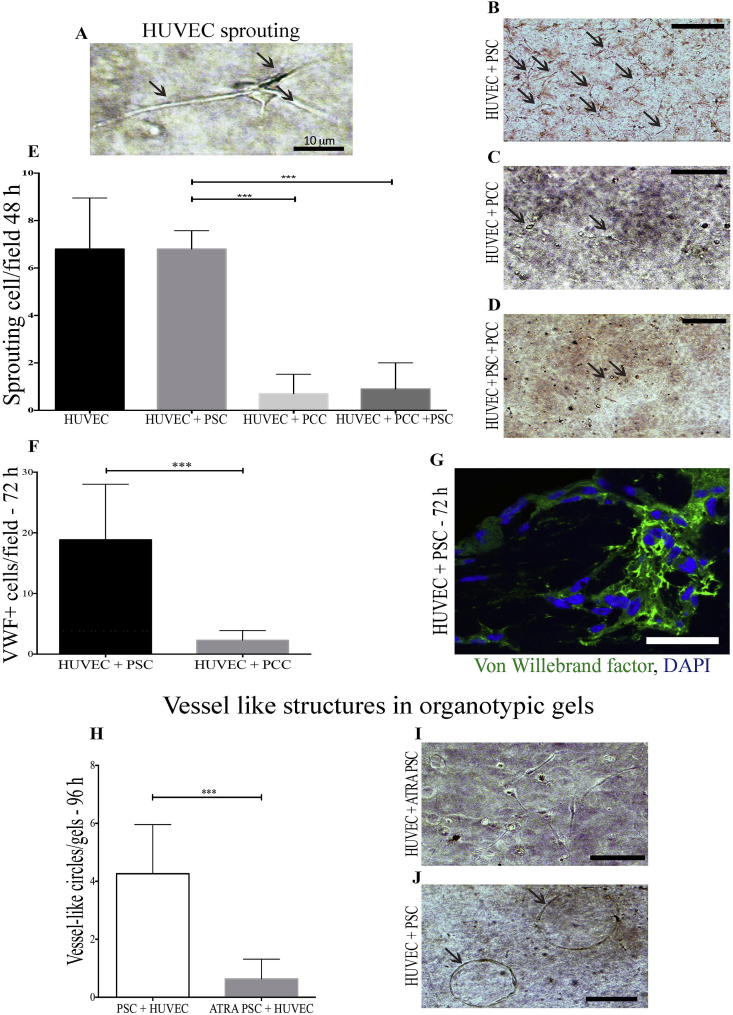
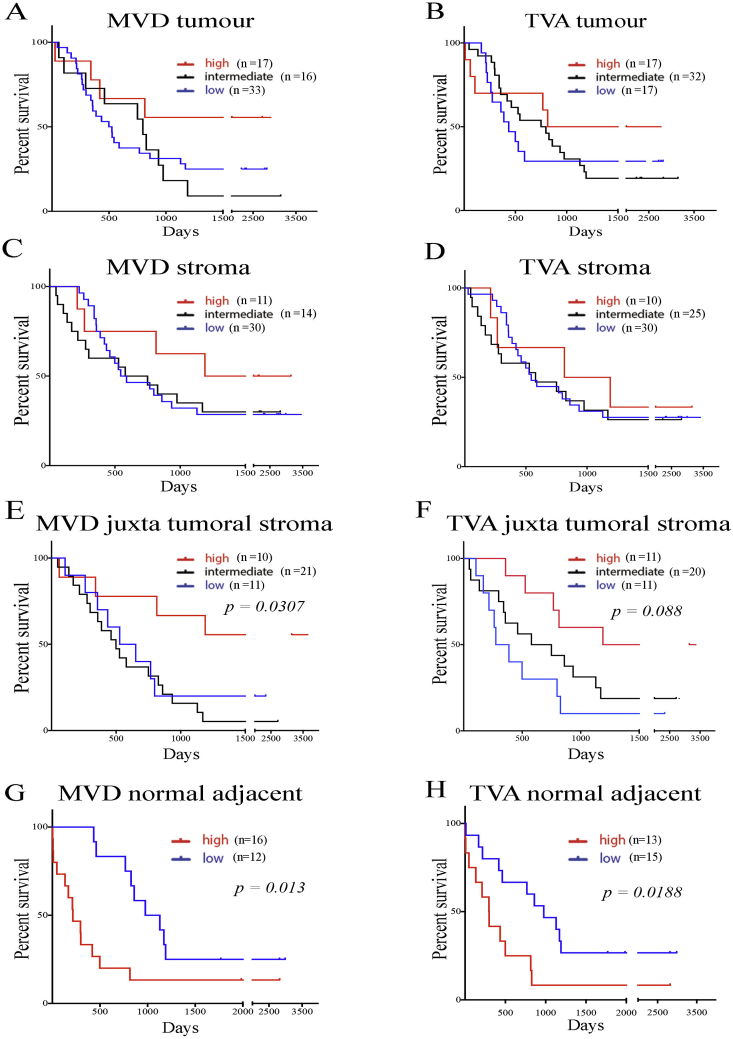
Results: PDAC has a distinct vascular density and distribution of vessels compared to cholangiocarcinoma. The PDAC juxta-tumoral stroma was hypovascular and the normal adjacent rim was hypervascular compared to the panstromal compartment. These features adversely affected patient prognosis, suggesting a model for spatio-temporal PDAC evolution. Mice aortic rings and 3D organotypic cultures demonstrated pro- and anti-angiogenic signalling from activated PSC and cancer cells respectively. ATRA-induced quiescence suppressed the pro-angiogenic activity of PSC.

Conclusion: Human PDAC has variable vascularity at microscopic level suggesting that novel stromal directed therapies would need to be determined by pathological characteristics.

Keywords: Angiogenesis; Juxta-tumoral; Micro-environment; Pancreatic stellate cells; Panstromal.


Figures

None
Supplementary Fig. 1Aortic rings angiogenesis assay. Schema of construction of aortic ring angiogenesis assays and feeding the aortic rings with conditioned media from cancer or stellate cells.
None
Supplementary Fig. 2Effect of collagen concentration on angiogenesis in mice aortic rings. The summary data of the aortic ring angiogenesis assays are shown in the form of box (median and interquartile ranges) and whisker (95% range) graphs. Each data-point represents an aortic ring with experiments performed in multiple replicates , , , , , , with at least three biological replicates using different Collagen concentrations to embed the aortic rings. Statistical analyses were performed by Kruskal-Wallis test with Dunn's post-hoc multiple comparison. *p < 0.05, **P < 0.01, ***p < 0.001.
None
Supplementary Fig. 3Juxtatumoral and normal adjacent vascular density impact on prognosis. Kaplan-Meier curves were obtained after patients for various factors which may have prognostic impact. Comparisons were made by Log-rank (Mantel Cox) test. For each patient (number, n=), data are obtained by calculating the average MVD and TVA measured within the specific parenchymal area for that patient. A: PDAC versus cholangiocarcinoma overall survival in this patient cohort, B–E: Grade of tumour (B), lymph nodal involvement (B), resection margin involvement and impact on sex in patients with PDAC and their survival.
None
Supplementary Figure 4Organotypic cultures' consecutive sections stained for cleaved caspase 3 and von Willebrand factor. HUVEC-Capan1 and HUVEC-PSC double organotypic cultures were used. Consecutive sections were stained for stained for cleaved caspase 3 and von Willebrand factor.
Fig. 1
Fig. 1
Stroma is hypovascular in PDAC but not cholangiocarcinoma. A–C: CD31 immuno-histochemistry (brown) was used to demonstrate vascular density in tissue micro-arrays with normal pancreas (A), PDAC (B) and cholangiocarcinoma (C). Scale Bar = 100 μm. D-E The micro-vascular density (MVD, D) was measured by number of vessels/mm2. The total vascular area (TVA, E) was measured by area occupied by vessels per 1000 units of area using automated Ariol™ analysis for the tumour bearing and stromal areas of cancer. The summary data are shown in the form of box (median and interquartile ranges) and whisker (95% range) graphs. Each data-point represents a patient (numbers depicted by n=), which was derived as a median value of three to six microarray cores. Statistical analyses were performed by Kruskal-Wallis test with Dunn's post-hoc multiple comparison. ns, not significant, *p < 0.05, **P < 0.01, ***p < 0.001.
Fig. 2
Fig. 2
Vascular density of stromal sub-compartments. A: Juxtatumoral stroma (within 100 μm of tumour tissue) and panstroma (the rest of the tumour stroma) were defined using the Ariol™ software to perform separate analyses for vascular density. Scale Bar = 100 μm. B, C: The micro-vascular density (MVD, D) was measured by number of vessels/mm2. The total vascular area (TVA, E) was measured by area occupied by vessels per 1000 units of area using automated Ariol™ analysis for the stromal cub-compartments areas of PDAC. The summary data are shown in the form of box (median and interquartile ranges) and whisker (95% range) graphs. Each data-point represents a measurement from individual core. In case of multiple spots analysed within the same core (for Juxtatumoral only) the median of the index measurement per core was used. Statistical analyses were performed by Kruskal-Wallis test with Dunn's post-hoc multiple comparison. ns, not significant, *p < 0.05, **P < 0.01, ***p < 0.001. D: The dimension of each vessel was measured. The summary data are shown in the form of box (median and interquartile ranges) and whisker (95% range) graphs. Each data-point represents a vessel (number, n=) on a graph with logarithmic Y-axis scale. Statistical analysis was performed by Kruskal-Wallis test with Dunn's post-hoc multiple comparison. **P < 0.01, ***p < 0.001. E. The proportion of capillaries (5.5–20 μm) is the highest in normal tissue, whereas in tumour stroma arteries (100–500 μm) and arterioles (20–100 μm) are more prevalent. In juxta-tumoral stroma very small capillaries (<5 μm) account for 3–4% of total and may represent non-functional vessels compressed by the dense stroma.
Fig. 3
Fig. 3
Normal adjacent pancreas is more vascularised in PDAC. A, B: Histopathological image of normal pancreas adjacent to PDAC showing higher vascular density, as identified by CD31 immuno-histochemistry. Scale Bar: 100 μm. C, D: The micro-vascular density (MVD, C) was measured by number of vessels/mm2. The total vascular area (TVA, D) was measured by area occupied by vessels per 1000 units of area using automated Ariol™ analysis for the normal adjacent areas in PDAC and normal pancreas. The summary data are shown in the form of box (median and interquartile ranges) and whisker (95% range) graphs. Each data-point is a selected area analysed. Statistical analysis by Mann-Whitney U test. **P < 0.01.
Fig. 4
Fig. 4
Stellate cells promote angiogenesis in mice aortic rings whereas cancer cells inhibit it. A–D: Representative microscopic images of aortic rings treated with either VEGF (30 ng/mL, positive control, A) , or conditioned medium from cancer cells (B), or negative controls (2.5% FBS supplemented media, C), or stellate cells (D) to demonstrate vessel sprouts at endpoint analysis. Scale Bar = 500 μm. E: The summary data of the aortic ring angiogenesis assays are shown in the form of box (median and interquartile ranges) and whisker (95% range) graphs. Each data-point represents an aortic ring with experiments performed in multiple replicates , , , , , , with at least three biological replicates. Statistical analyses were performed by Kruskal-Wallis test with Dunn's post-hoc multiple comparison. *p < 0.05, **P < 0.01, ***p < 0.001. F, G: ATRA treated pancreatic stellate cells show a quiescent morphology, whilst ethanol treated pancreatic stellate cells show the characteristic myofibroblast-like morphology. Scale Bar = 50 μm. H,I: Representative microscopic images of aortic rings treated conditioned medium from ATRA-treated PSC (H) or activated PSC (I) at endpoint analysis. Scale Bar = 500 μm (H) and 200 μm (I). J: The summary data of the aortic ring angiogenesis assays are shown in the form of box (median and interquartile ranges) and whisker (95% range) graphs. Each data-point represents an aortic ring with experiments performed in multiple replicates , , , , , , with at least three biological replicates. Statistical analyses were performed by Kruskal-Wallis test with Dunn's post-hoc multiple comparison. ***p < 0.001. K: Confocal microscope image of a sprout confirming the vascular nature of the sprouts. Vascular structures are stained with BSI-Lectin and supporting fibroblasts (pericytes) with smooth muscle actin (SMA). Scale bar: 100 μm. See Supplementary Fig. 2 for other analysis on effect of Collagen concentration.
Fig. 5
Fig. 5
Activated PSC promote HUVEC survival and angiogenesis in organotypic cultures. A: Early sprouting (24 h) of a single HUVEC cell in a 3D organotypic culture. B–D: Representative images of sprouting HUVEC cells (arrows) in 3D double co-culture with PSC (B) or double culture with PCC (C) or triple HUVEC/PSC/PCC cultures (D) at 48 h after starting the cultures. E: Summary data are mean + SEM of sprouting HUVEC cells per field analysed from multiple organotypic cultures as shown in B–D. 6 OT gels were cultured of each condition. 10 independent fields were analysed for each double culture. Statistical analyses were performed by Friedman Test, *p < 0.05, **P < 0.01, ***p < 0.001). F, G; Von-Willebrand Factor positive HUVEC (G) survived significantly more in OT gels with HUVEC-PSC than HUVEC-PCC co-cultures. Summary data are mean + SEM of sprouting cells per field analysed. 15 independent fields were analysed for each slide stained from a total of eight biological samples. Statistical analyses were performed by Friedman Test, ***p < 0.001. H–J: Circular structures resembling vessels were detectable after 72–96 h in organotypic gels with activated PSC-HUVEC (I) significantly more than in gels with ATRA-treated PSC-HUVEC (J). 12 double culture gels were analysed. Summary data are mean + SEM of circular structures per field analysed. Statistical analyses were performed by Friedman Test, ***p < 0.001.
Fig. 6
Fig. 6
Juxtatumoral and normal adjacent vascular density impact on prognosis. Kaplan Meier curves were obtained after patients were divided either in three groups based on quantiles which were high (above 3rd quartile), intermediate (between 1st and 3rd quartile), or low (below 1st quartile) for total vascular area (TVA) and microvascular density (MVD). Comparisons were made by Log-rank (Mantel Cox) test. For each patient (number, n=), data are obtained by calculating the average MVD and TVA measured within the specific parenchymal area for that patient. A–D: Whole tumoral (A,B) and stromal (C,D) vascular density indices do not have prognostic impact, E–F: Higher juxtatumoral vascular density indices for MVD (E) and TVA (F) result in better prognosis. G,H: For normal adjacent pancreas the data were analysed in two groups as high (above median) or low (below median). Both vascular indices MVD (G) and TVA (H) in tumour adjacent normal tissues indicate higher vascularisation leads to poorer prognosis. See Supplementary Fig. 3 for other analysis on cholangiocarcinoma.

References

    1. Kadaba R., Birke H., Wang J., Hooper S., Andl C.D., Di Maggio F. Imbalance of desmoplastic stromal cell numbers drives aggressive cancer processes. J Pathol. 2013;230(1):107–117. - PMC - PubMed
    1. Froeling F.E., Mirza T.A., Feakins R.M., Seedhar A., Elia G., Hart I.R. Organotypic culture model of pancreatic cancer demonstrates that stromal cells modulate E-cadherin, beta-catenin, and Ezrin expression in tumor cells. Am J Pathol. 2009;175(2):636–648. - PMC - PubMed
    1. Pappas S.G., Christians K.K., Tolat P.P., Mautz A.P., Lal A., McElroy L. HPB; Oxford: 2013. Staging chest computed tomography and positron emission tomography in patients with pancreatic adenocarcinoma: utility or futility? - PMC - PubMed
    1. Wong P.P., Demircioglu F., Ghazaly E., Alrawashdeh W., Stratford M.R., Scudamore C.L. Dual-action combination therapy enhances angiogenesis while reducing tumor growth and spread. Cancer Cell. 2015;27(1):123–137. - PubMed
    1. Rhim A.D., Oberstein P.E., Thomas D.H., Mirek E.T., Palermo C.F., Sastra S.A. Stromal elements act to restrain, rather than support, pancreatic ductal adenocarcinoma. Cancer Cell. 2014;25(6):735–747. - PMC - PubMed

LinkOut - more resources