. 2016 Aug;26(8):3655-3668.
doi: 10.1093/cercor/bhw166. Epub 2016 Jun 9.

From Neuron Biophysics to Orientation Selectivity in Electrically Coupled Networks of Neocortical L2/3 Large Basket Cells

Affiliations

From Neuron Biophysics to Orientation Selectivity in Electrically Coupled Networks of Neocortical L2/3 Large Basket Cells

Oren Amsalem et al. Cereb Cortex. 2016 Aug.

Abstract

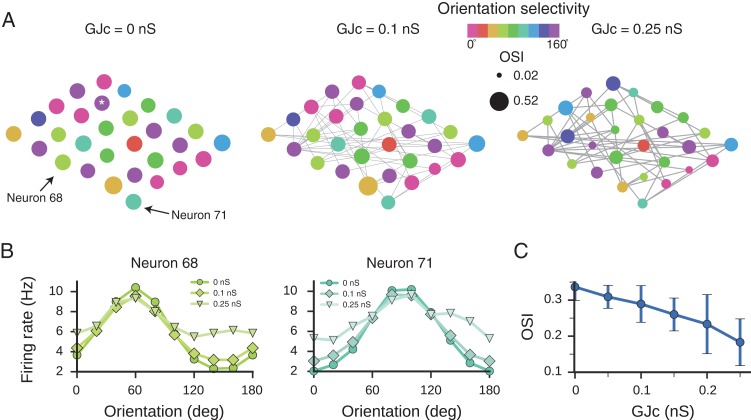
In the neocortex, inhibitory interneurons of the same subtype are electrically coupled with each other via dendritic gap junctions (GJs). The impact of multiple GJs on the biophysical properties of interneurons and thus on their input processing is unclear. The present experimentally based theoretical study examined GJs in L2/3 large basket cells (L2/3 LBCs) with 3 goals in mind: (1) To evaluate the errors due to GJs in estimating the cable properties of individual L2/3 LBCs and suggest ways to correct these errors when modeling these cells and the networks they form; (2) to bracket the GJ conductance value (0.05-0.25 nS) and membrane resistivity (10 000-40 000 Ω cm(2)) of L2/3 LBCs; these estimates are tightly constrained by in vitro input resistance (131 ± 18.5 MΩ) and the coupling coefficient (1-3.5%) of these cells; and (3) to explore the functional implications of GJs, and show that GJs: (i) dynamically modulate the effective time window for synaptic integration; (ii) improve the axon's capability to encode rapid changes in synaptic inputs; and (iii) reduce the orientation selectivity, linearity index, and phase difference of L2/3 LBCs. Our study provides new insights into the role of GJs and calls for caution when using in vitro measurements for modeling electrically coupled neuronal networks.

Keywords: cortical interneurons; electrical coupling; gap junctions; membrane time constant; visual cortex.


Figures

Figure 1.
Figure 1.
Passive properties of an exemplar L2/3 LBC measured in vitro. (A) Three-dimensional reconstructed LBC from L2/3 of the rat. (B) Series of hyper- and depolarizing current steps (lower traces) and the corresponding voltage response (upper traces) for the cell shown in A. Spikes in gray are truncated. (C) I/V curve (black squares) extracted from B; the slope at resting potential yields an input resistance of 157 MΩ. The membrane time constant τm for this neuron, estimated from the initial phase of the voltage response to the smallest currents, was 12–15 ms (see Materials and Methods). Three additional L2/3 LBCs used for network modeling are presented in Supplementary Figure 1.
Figure 2.
Figure 2.
Constraining GJc and Rm values in L2/3 LBCs by fitting the model to the experiments. (A) Part of the modeled L2/3 LBC network (blue dots—GJs between these 8 neurons; brown dots—GJs with other neurons which are not shown here). The full network consists of 121 L2/3 LBCs (composed of 4 different morphologies, each with variability in the number of connections/cell, number of contacts/connection, and variability in Rm and in GJc values; see Supplementary Fig. 1 and Materials and Methods). (B) Relationship between GJc and the corresponding Rm value consistent with the range of the in vitro values of the experimental Rin (ranging from 103 to 157 MΩ; see Materials and Methods). Three exemplar modeled cells (and their corresponding Rin values) are shown. In each case, 3 different network configurations (mean number of connections per cell) are shown (see also the corresponding analytical result for the case without dendrites in Supplementary Fig. 2). Color code at right represents the average CC between the modeled cell and its directly connected neighbors; the 2 red arrows at right demarcate the experimental range of the CC (1.5–3.5%); this range is also marked by the 2 vertical lines on each curve. In these 3 examples, and depending on the connectivity level via GJs, Rm was estimated to range from 10 000 to 40 000 Ω cm2 and GJc from 0.05 to 0.25 nS. The range of Rm and GJc for the whole population is shown in Supplementary Figure 3. The axial resistivity Ra was 100 Ω cm (see Supplementary Fig. 4 for estimates of GJc and Rm with Ra = 200 Ω cm).
Figure 3.
Figure 3.
Distortion in L2/3 LBC cable properties due to GJs. (A) Right—schematic representation of the modeled L2/3 LBC neuronal network, consisting of 121 modeled L2/3 LBC neurons as in Figure 2 (an exemplar cell is shown at left, see Materials and Methods). Red—neuron of interest; green—neurons that are directly coupled with the red neuron via GJs; blue—all other neurons that are not directly connected to the red cell. Red lines depict the GJs between the green cells and the red cells (shown at left by the blue dots); green lines depict all other GJs made onto the green cells. GJs between the blue cells are not shown. (B1) Normalized voltage decay following a short current injection to the red cell in A, for the case of an average of 30 connections per neuron. Short vertical lines depict 85–90% decay of the initial voltage. (B2) “Peeling” transients for estimating the membrane time constant (τ0,peel) from the tail of the log of the voltage decay (peeled between 85% and 90% of the voltage decay), as typically done experimentally. Note the large underestimation of τm due to the GJs (green and red traces). The mean error for all neurons in estimating the membrane time constant (C1) and the input resistance (C2) as a function of GJc value is shown by the continuous line; the corresponding SD is depicted by the shaded region.
Figure 4.
Figure 4.
Effect of GJs on firing characteristics of L2/3 LBCs. (A) Response of a model of an isolated L2/3 LBC (cell shown in Fig. 1A) to suprathreshold depolarizing step current (see model parameters in Materials and Methods). (B) Same modeled cell as in A, but when the cell is embedded in a network with 30 ± 6 connections per neuron (with mean GJc = 0.11 nS). Voltage response is shown in red for the same current as in A. The spikes in A are also shown in black. (C) As in B, but compensating for the (1.4-fold) reduction in Rin due to the GJs by proportionally increasing the injected current. (D) Compensating for the effect of GJs by increasing (based on Fig. 2B) Rm of the modeled neurons by a factor of approximately 3 for preserving their in vitro Rin. This compensation successfully retrieves the spiking characteristics of the model in A (see also Supplementary Fig. 9).
Figure 5.
Figure 5.
L2/3 LBC network as a coincidence detector. (A) excitatory postsynaptic potentials (EPSPs) in an isolated passive neuron with Rm = 20 000 Ω cm2 (black trace) and in the same neuron when it is embedded in an L2/3 LBC network (red trace, network consists of 30 ± 6 connections per neuron, with a mean GJc = 0.1 nS). (B) EPSP in the same neuron when other neurons that are directly connected to it were activated. The cases of 6, 13, and 20 simultaneously activated neurons are shown. (C) The corresponding cases where cells that were not directly connected to it were simultaneously activated. (D) A train of 4 EPSPs in the LBC of interest when 50 synapses were activated (at 71 Hz) on its dendrites (red); Green, when 20 other LBCs which were not directly connected to that cell were also activated, each by 50 excitatory dendritic synapses. Blue, when 20 neurons that were directly connected to the cell of interest were activated. (E) Same as in D, but when L2/3 LBCs consist of excitable soma (see Materials and Methods). (F and G) Dependence of the integration time window of a given neuron on the number of activated neurons that were directly connected to it (each neuron was activated with 85 excitatory synapses). Increasing the number of activated neurons was associated with an increase in the temporal jitter of the sensory input that still gives rise to a reliable spiking response.
Figure 6.
Figure 6.
GJs enhance the encoding capability of the neuron. (A) Representation of one of the 121 modeled cells in the L2/3 LBC network. Each L2/3 LBC modeled neuron is connected to 30 ± 6 similar neurons with a mean of 2 GJs per connection (blue dots). (B) Spiking response (upper trace) of the neuron shown in A, to a noisy current injected into the cell soma (middle trace, black). The injected current was composed of a DC current (middle trace, red line), a modulated sine wave (lower trace, green line), and a noisy current (see Materials and Methods). (C) Phase plots of the axonal APs for 3 different GJc values (0, 0.1, and 0.25 nS). (D) Zoom-in to the initial part of the AP phase plots shown in C. Increasing GJc enhances the speed of the rising phase of the spike. (E) Vector strength as a function of input frequency showing the increasing capability of the modeled cell to track high-frequency input modulations with increasing GJc (value shown near the corresponding curves). The cutoff frequency is defined by the intersection between the vector strength, R, and the respective 95th percentile (respective dotted colored lines) obtained by computing the vector strength in 1500 random spike trains (see Materials and Methods). The cutoff frequencies were 490, 575, and 815 Hz for GJc = 0, 0.1, and 0.25 nS, respectively.
Figure 7.
Figure 7.
GJs reduce input selectivity in L2/3 LBCs network. (A) OSI for neurons in 3 networks that differ in their GJc values (value above each network). The PO of the modeled cells is color-coded (color scale at top) and the OSI value for each neuron is represented by the size of the circle (2 exemplar black circles at top). Only part of the modeled network is shown with only 10% of the GJs, which are depicted by the lines connecting the neurons. Note the decrease in the size of the circles (decreased OSI) with increasing GJc and also the change in PO (change in color) of some cells (e.g., the cell marked by asterisk). (B) Tuning curves of 2 exemplar neurons (68 and 71), for 3 values of GJc. (C) The mean OSI + SD for the whole network consisting of 121 L2/3 LBCs as a function of GJc; the larger the GJc value, the lower the OSI. In all cases, the average firing rate of the network was adjusted to 10 Hz (see Materials and Methods).
Figure 8.
Figure 8.
Influence of GJs on visual-like sensory input. (A) Spiking activity of a neuron in response to an oscillating axonal input, the linearity index of the cell decreased from 1.8 to 0.55 when GJs were added to the network (at 0.1 nS, lower graph). The decrease in linearity due to GJs is manifested by the lower amplitude of the sine wave, which was computed as the best 2 Hz sinusoidal fit (continuous line) to the spike histogram (blue histogram). (B) Mean linearity as a function of GJc. (C) Spiking histogram for 2 different cells without GJs (top) and with GJc = 0.1 nS (bottom). The phase difference between the cells decreases as the conductance of the GJs increases. (D) Mean phase difference across all cell pairs in the network (vertical lines in B and D represent standard error of the mean).

References

    1. Alcami P, Marty A. 2013. Estimating functional connectivity in an electrically coupled interneuron network. Proc Natl Acad Sci USA. 110:E4798–E4807. - PMC - PubMed
    1. Amitai Y, Gibson JR, Beierlein M, Patrick SL, Ho AM, Connors BW, Golomb D. 2002. The spatial dimensions of electrically coupled networks of interneurons in the neocortex. J Neurosci. 22:4142–4152. - PMC - PubMed
    1. Anastasiades PG, Marques-Smith A, Lyngholm D, Lickiss T, Raffiq S, Kätzel D, Miesenböck G, Butt SJB. 2016. GABAergic interneurons form transient layer-specific circuits in early postnatal neocortex. Nat Commun. 7:10584. - PMC - PubMed
    1. Angulo MC, Rossier J, Audinat E. 1999. Postsynaptic glutamate receptors and integrative properties of fast-spiking interneurons in the rat neocortex. J Neurophysiol. 82:1295–1302. - PubMed
    1. Avermann M, Tomm C, Mateo C, Gerstner W, Petersen CCH. 2012. Microcircuits of excitatory and inhibitory neurons in layer 2/3 of mouse barrel cortex. J Neurophysiol. 107:3116–3134. - PubMed