. 2016 Sep 7:404:222-235.
doi: 10.1016/j.jtbi.2016.06.003. Epub 2016 Jun 8.

Scalar utility theory and proportional processing: What does it actually imply?

Affiliations

Scalar utility theory and proportional processing: What does it actually imply?

Tom Rosenström et al. J Theor Biol. .

Abstract

Scalar Utility Theory (SUT) is a model used to predict animal and human choice behaviour in the context of reward amount, delay to reward, and variability in these quantities (risk preferences). This article reviews and extends SUT, deriving novel predictions. We show that, contrary to what has been implied in the literature, (1) SUT can predict both risk averse and risk prone behaviour for both reward amounts and delays to reward depending on experimental parameters, (2) SUT implies violations of several concepts of rational behaviour (e.g. it violates strong stochastic transitivity and its equivalents, and leads to probability matching) and (3) SUT can predict, but does not always predict, a linear relationship between risk sensitivity in choices and coefficient of variation in the decision-making experiment. SUT derives from Scalar Expectancy Theory which models uncertainty in behavioural timing using a normal distribution. We show that the above conclusions also hold for other distributions, such as the inverse Gaussian distribution derived from drift-diffusion models. A straightforward way to test the key assumptions of SUT is suggested and possible extensions, future prospects and mechanistic underpinnings are discussed.

Keywords: Decision making; Risk preferences; Scalar expectancy theory; Scalar property; Weber's law.


Conflict of interest statement

Disclosures

The authors declare no conflicting interests.

Figures

Figure 1
Figure 1
Typical application of Scalar Utility Theory (SUT). A) If an animal has been trained in an experiment where a choice option always delivers a reward of magnitude 2 (vertical dashed line), the animal’s operational (memory) representation is approximated by a normal distribution with mean 2 and standard deviation γ2 (solid line for probability density function; γ = 0.5 here). B) When a choice option yields a reward of 1 with probability of ½ and a reward of 3 with probability of ½ (mean is again equal to 2), then this option’s representation is assumed to be a mixture of the representation (thick line) for the equivalent certain rewards (thin lines), with the mixing weights equal to the probabilities of respective cases of reward in the experiment: (½,½). Because the standard deviation of mental representation of a reward is assumed to be proportional to the reward value, a more dispersed representation for the bigger outcome is superposed on a less dispersed one for the lower outcome, which induces a skewed representation for the variable reward. C) Contours of the joint distribution of the independent fixed (horizontal axis) and variable (vertical axis) choice options. Because of the skew for the variable option and equal means for the fixed and variable option (i.e., 2), a larger share of the probability mass resides below the diagonal; i.e., in the set {fixed option > variable option}. Thus, in independent random samples the event {fixed option > variable option} occurs more often, implying risk-averse behaviour for variable reward amount.
Figure 2
Figure 2
Zero rewards in SUT. A) Irrespective of the (constant) value of γ, the standard deviation of SUT’s memory representations, γm, tend towards zero as the encoded value, m, does so. A small probability of a negative memory draw exists, however. B) With a truncated Normal distribution, negative memories are avoided by setting the likelihood of negative values to zero and normalising the positive likelihoods so as to integrate to 1. C) The inverse Gaussian distribution is also subject to the scalar property, although defined only for positive rewards. D) SUT-predicted probability of choosing the safe option in the experiment of Shafir et al. (2008), as a function of γ. Solid line gives the usual SUT prediction, dashed line the one where SUT’s normal densities have been replaced by zero-truncated normal densities, and dash-dotted line the prediction using Inverse Gaussian distribution (zero reward is represented by Dirac’s delta distribution).
Figure 3
Figure 3
SUT prediction for two equal-mean outcomes as a function of γ and θ. Left column of panels shows contour plots and right column indifference regions (black areas), where 0.495 < P(S2 > S1) < 0.505, implying that the animal has no readily observable preference. Rows show the same for different values of mean (m) and small outcome of the variable option (s). The findings are almost exactly the same when replacing normal base distribution of the model with truncated normal or inverse Gaussian.
Figure 4
Figure 4
Strong Stochastic Transitivity (SST). An example where SST is violated is illustrated. A) Cumulative distribution functions of alternative a (solid line), b (dashed line), and c (dotted line). BD) Joint probability densities of the options. The higher mean of c compared to b takes more probability mass over the diagonal for the joint distribution of c and b than for the joint distributions of c and a or b and a. Because b was already preferred to a and c preferred to b, strong stochastic transitivity would require c to be preferred to a even more than it is preferred to b; but this fails to happen in the present SUT parametrisation.
Figure 5
Figure 5
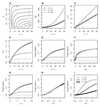
Statistics of variation compared with SUT prediction. Panels A to D statistically characterize the risky option of the experiment, whereas panels E to I compare those statistics with corresponding predictions of SUT; the safe option has a fixed mean equal to that of the risky option. A) Contours plot for coefficient of variation (CV) of the two-outcome risky, or variable option as a function of the difference of outcomes (b – s) and the probability θ of getting the big reward b when choosing this option (s = 3). CV has been used to predict risk sensitivity, which is defined as absolute difference between probability of choosing the risky option instead of a safe option with equal mean and the indifference-value ½. BE) Variance (Var), standard deviation (s. d.),and CV of the risky option, and associated SUT prediction as a function of b – s, for three different values of θ. FH) SUT prediction compared to the variance, standard deviation, and CV. I) SUT prediction compared to CV when θ =0.1, for three different values of the scalar γ.

Similar articles

Cited by

References

    1. Akre KL, Johnsen S. Psychophysics and the evolution of behavior. Trends in Ecology & Evolution. 2014;29(5):291–300. doi: 10.1016/j.tree.2014.03.007. - DOI - PubMed
    1. Allan LG, Gibbon J. Human bisection at the geometric mean. Learning and Motivation. 1991;22(1–2):39–58. doi: 10.1016/0023-9690(91)90016-2. - DOI
    1. Barnard CJ, Brown CAJ, Houston AI, McNamara JM. Risk-sensitive foraging in common shrews: an interruption model and the effects of mean and variance in reward rate. Behavioral Ecology and Sociobiology. 1985;18(2):139–146.
    1. Bateson M, Kacelnik A. Accuracy of memory for amount in the foraging starling, Sturnus vulgaris. Animal Behaviour. 1995a;50(2):431–443. doi: 10.1006/anbe.1995.0257. - DOI
    1. Bateson M, Kacelnik A. Preferences for fixed and variable food sources: variability in amount and delay. Journal of the Experimental Analysis of Behavior. 1995b;63(3):313–329. doi: 10.1901/jeab.1995.63-313. - DOI - PMC - PubMed

Publication types

LinkOut - more resources