. 2016 Aug;195(2):190-198.
doi: 10.1016/j.jsb.2016.06.001. Epub 2016 Jun 8.

A new method for vitrifying samples for cryoEM

Affiliations

A new method for vitrifying samples for cryoEM

Ivan Razinkov et al. J Struct Biol. 2016 Aug.

Abstract

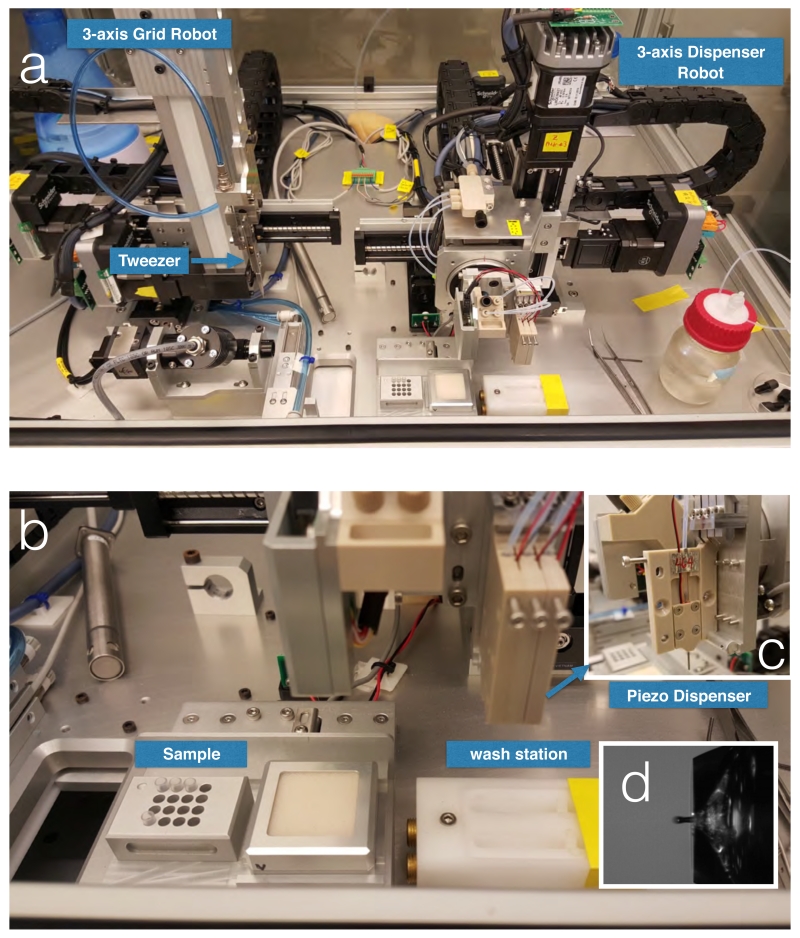
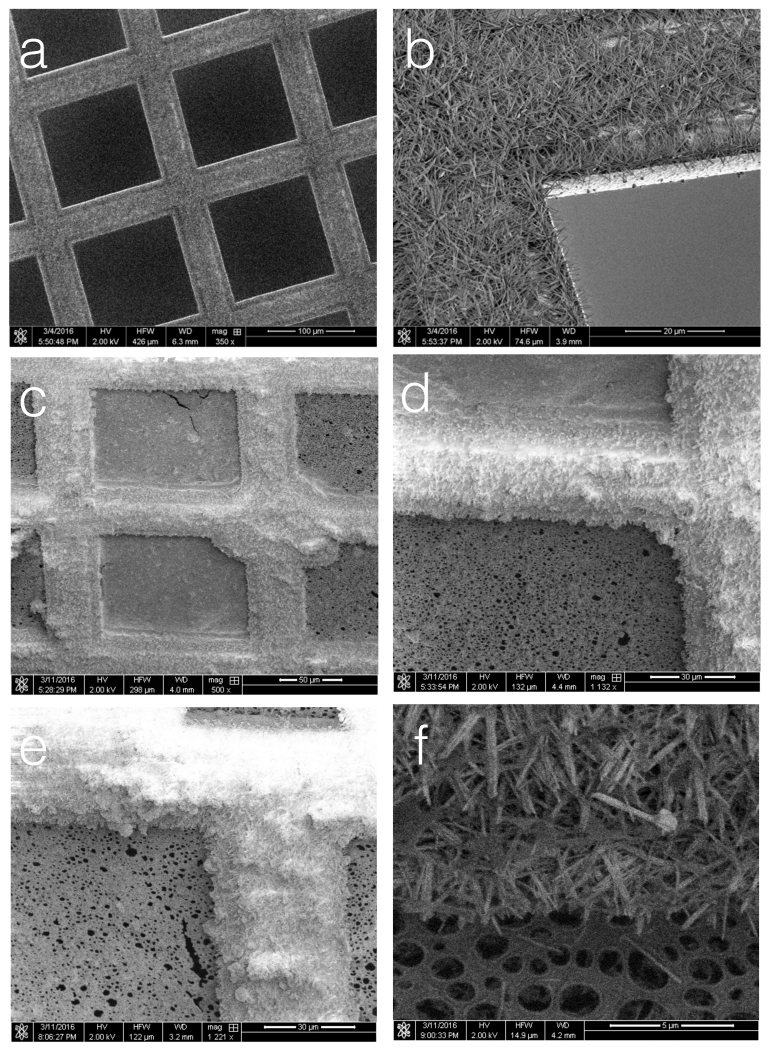
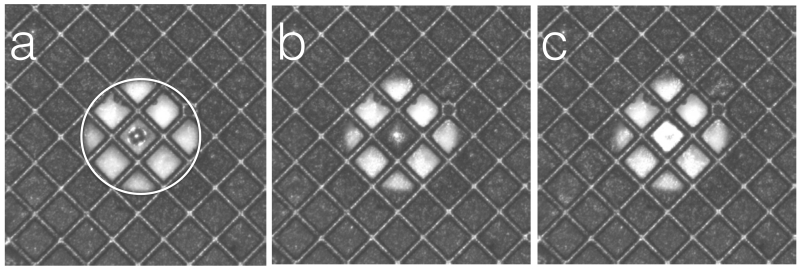
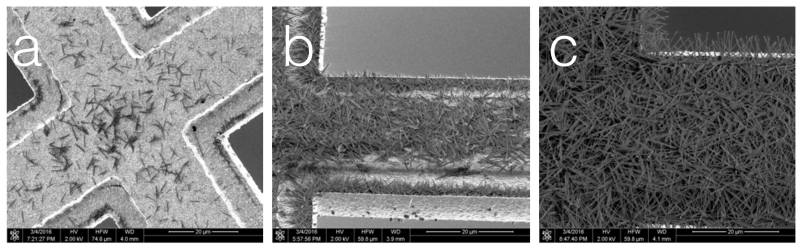
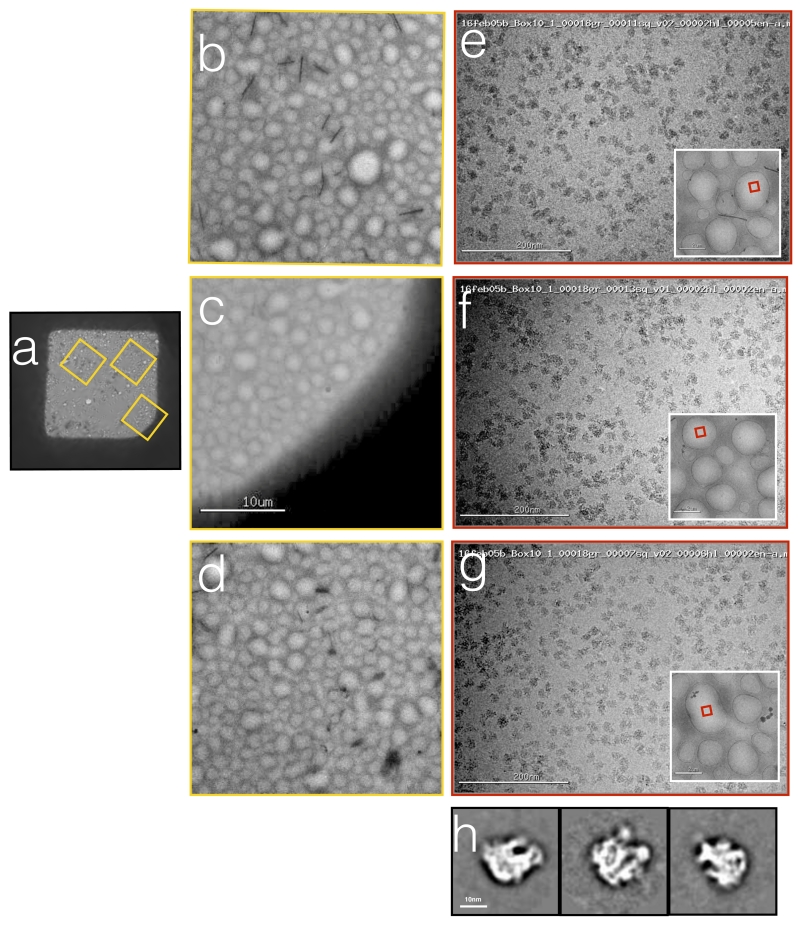
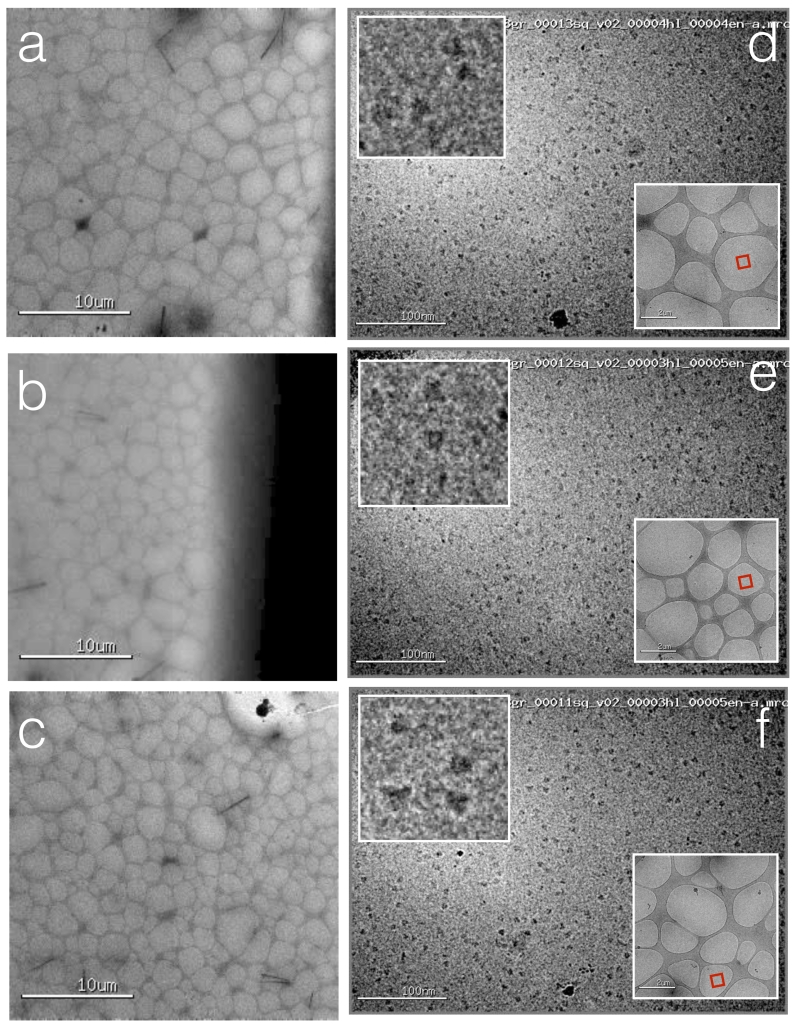
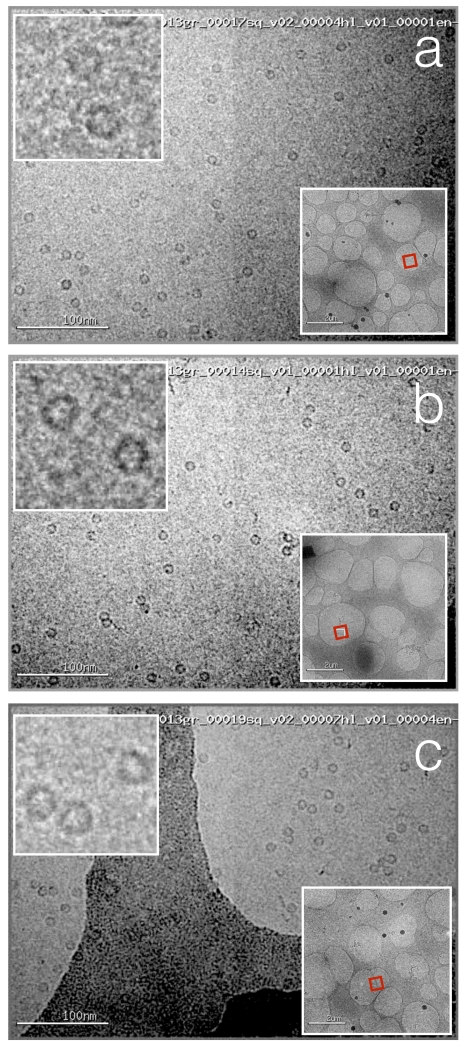
Almost every aspect of cryo electron microscopy (cryoEM) has been automated over the last few decades. One of the challenges that remains to be addressed is the robust and reliable preparation of vitrified specimens of suitable ice thickness. We present results from a new device for preparing vitrified samples. The successful use of the device is coupled to a new "self-blotting" grid that we have developed to provide a method for spreading a sample to a thin film without the use of externally applied filter paper. This new approach has the advantage of using small amounts of protein material, resulting in large areas of ice of a well defined thickness containing evenly distributed single particles. We believe that these methods will in the future result in a system for vitrifying grids that is completely automated.

Keywords: Automation; CryoTEM; Nanowires; Self-blotting grids.


Figures

Figure 1
Figure 1
Spotiton 1.0 device. (a) Picture of the Spotiton 1.0 robot; a 3 axis robot grid arm can move the tweezers in three directions to precisely locate the grid in front of the tip; a independent 3-axis dispenser robot arm can move the tip to exact specified locations on the grid. (b) Close up views of the piezo tip dispenser and (c) washing and drying station. (d) View of drop in flight from piezo top. Minimum drop volume is 30pL.
Figure 2
Figure 2
Nanowire grids. (a,b) SEM images of a nanowire grid (after 6.5 minutes of chemical treatment). (c) After examination in a TEM, a vitrified nanowire grid was transferred to the cryo-SEM. Ice can be seen covering two squares of the grid (as confirmed by the TEM images and the video of the spotting). (d) Ice is observed to thickly coat the nanowires that appear to be saturated. (e) the saturation of the nanowires continues along the grid bars all the way out to the edge of the grid. (f) The nanowires after being cleared of ice by heating.
Figure 3
Figure 3
Individual frames from a Spotiton video. (a) Frame acquired just as the spot hits the surface of the grid. (b) 200msecs later the spot has contacted the nanowires and the liquid is being absorbed along the grid bars. (c) 200 msecs later the spot has been spread to a thin film. Note that the bright circular region, outlined by a circle in (a) is an image of the piezo tip.
Figure 4
Figure 4
Nanowire grids with varying lengths of time of chemical treatment in Ammonium Persulfate solution. (a) 4 minutes, (b) 6 minutes, (c) 10 minutes.
Figure 5
Figure 5
Ribosomes vitrified onto nanowire grids using Spotiton. (a) An image of the grid square into which the sample was spotted. (b,c,d) Larger scale views of the areas of the square indicated by the yellow boxes in (a). (e,f,g) High magnification images acquired from these regions of the grid square show a uniform ice thickness and fairly uniform distribution of particles across the holes. The red box in the inset indicates the exact hole that was imaged. (h) Representative class averages calculated form a small set of selected particles.
Figure 6
Figure 6
Hemaglutinnin (HA) vitrified onto nanowire grids using Spotiton. (a, b, c) Several regions across the grid square that was spotted. (d,e.f) High magnification images acquired from these regions of the grid square show a uniform ice thickness and fairly uniform distribution of particles across the holes. The red box in the lower right inset indicates the exact hole that was imaged, the upper left inset shows a higher magnification image of a selected region.
Figure 7
Figure 7
Apoferritin vitrified onto nanowire grids using Spotiton. (a, b, c) High magnification images acquired from regions across the grid square show a uniform ice thickness and fairly uniform distribution of particles across the holes. The red box in the lower right inset indicates the exact hole that was imaged, the upper left inset shows a higher magnification image of a selected region.

References

    1. ADRIAN M, DUBOCHET J, LEPAULT J, MCDOWALL AW. Cryo-electron microscopy of viruses. Nature. 1984;308:32–6. - PubMed
    1. CHENG Y. Single-particle Cryo-EM at crystallographic resolution. Cell. 2015;161:450–457. - PMC - PubMed
    1. DUBOCHET J, ADRIAN M, CHANG J, HOMO J, LEPAULT J, MCDOWALL A, SCHULTZ P. Cryo-electron microscopy of vitrified specimens. Q Rev Biophys. 1988;21:129–228. - PubMed
    1. ERMANTRAUT E, WOHLFART K, TICHELAAR W. Perforated support foils with pre-defined hole size, shape and arrangement. Ultramicroscopy. 1998;74:75–81.
    1. FUKAMI A, ADACHI K. A new method of preparation of a self-perforated micro plastic grid and its application. J Electron Microsc (Tokyo) 1965;14:112–8. - PubMed

Publication types

MeSH terms