. 2016 Aug;75(8):718-730.
doi: 10.1093/jnen/nlw044. Epub 2016 Jun 10.

Expression of TRPC6 and BDNF in Cortical Lesions From Patients With Focal Cortical Dysplasia

Affiliations

Expression of TRPC6 and BDNF in Cortical Lesions From Patients With Focal Cortical Dysplasia

Da-Hai Zheng et al. J Neuropathol Exp Neurol. 2016 Aug.

Abstract

Focal cortical dysplasia (FCD) likely results from abnormal migration of neural progenitor cells originating from the subventricular zone. To elucidate the roles in molecules that are involved in neural migration pathway abnormalities in FCDs, we investigated the expression patterns of transient receptor potential canonical channel 6 (TRPC6) and brain-derived neurotrophic factor (BDNF) in cortical lesions from FCD patients and in samples of normal control cortex. TRPC6 and BDNF mRNA and protein levels were increased in FCD lesions. By immunohistochemistry, they were strongly expressed in microcolumns, heterotopic neurons, dysmorphic neurons, and balloon cells (BCs). Colocalization assays revealed that most of the misshapen TRPC6-positive or heterotopic cells had a neuronal lineage with the exception of TRPC6-positive FCDiib patient BCs, which had both neuronal and glial features. Most TRPC6-positive cells were glutamatergic neurons. There was also greater expression of calmodulin-dependent kinase IV (CaMKIV), the downstream factor of TRPC6, in FCD lesions, suggesting that TRPC6 expression promoted dendritic growth and the development of dendritic spines and excitatory synapses via the CaMKIV-CREB pathway in FCD. Thus, overexpression of BDNF and TRPC6 and activation of the TRPC6 signal transduction pathway in cortical lesions of FCD patients may contribute to FC pathogenesis and epileptogenesis.

Keywords: Brain-derived neurotrophic factor; Epilepsy; Focal cortical dysplasia; Malformations of cortical development; Transient receptor potential canonical channel 6.


Figures

FIGURE 1.
FIGURE 1.
Expression of TRPC6 mRNA in CTX and in patients with FCD types Ia, IIa, and IIb. (A) Real-time polymerase chain reaction analysis of TRPC6 mRNA expression in CTX, FCDIa, FCDIIa, and FCDIIb (n = 10/group) specimens. Increased TRPC6 mRNA levels were observed in the FCDIa, FCDIIa, and FCDIIb samples versus CTX samples. Importantly, the expression of TRPC6 mRNA was significantly increased in the FCDIIa and FCDIIb cortical lesions compared with the FCDIa specimens. Error bars represent SE; *p < 0.05, **p < 0.01 versus CTX; #p < 0.05 versus FCDIa; ANOVA. (B–I) In situ hybridization analysis of TRPC6 mRNA expression. TRPC6 mRNA expression in CTX samples (B–D). Expression was observed in neurons (arrows in B and C) and glia-like cells (arrowheads in C and D) in the neocortex, white matter (WM), and junction. TRPC6 mRNA expression in FCDIa samples (E, F). Expression was observed in neurons (arrows in E), including microcolumns (insert in E), heterotopic neurons (arrows in F) in the white matter, and glia-like cells (arrowheads in F). TRPC6 mRNA expression in FCDIIa samples (G). Expression was observed in dysmorphic neurons (DNs, arrows in G) and glia-like cells (arrowheads in G). TRPC6 mRNA expression in FCDIIb samples (H, I). Expression was observed in dysmorphic neurons (DNs, arrows in H and inset), balloon cells (BCs, double-arrows in I), and glia-like cells (arrowheads in I and inset). Scale bar: 30 µm.
FIGURE 2.
FIGURE 2.
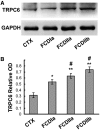
Expression of TRPC6 protein in CTX and FCD types Ia, IIa, and IIb. (A) Representative immunoblot of TRPC6 in total homogenates of lesions from FCD types Ia (FCDIa), IIa (FCDIIa), and IIb (FCDIIb) (n = 10 in each series) and the control CTX tissues (n = 10). (B) Densitometric analyses of the Western blots. There was a significant increase in TRPC6 protein levels in the FCDIa, FCDIIa, and FCDIIb tissues versus control samples. The TRPC6 protein levels were also significantly greater in the FCDIIa and FCDIIb cortical lesions versus the FCDIa specimens. Error bars represent SE; *p < 0.05, **p < 0.01 versus CTX; #p < 0.05 versus FCDIa; ANOVA.
FIGURE 3.
FIGURE 3.
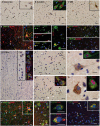
Cell-specific distribution of TRPC6 in CTX and FCDIa samples. (A–C) TRPC6 in the normal control cortex (CTX). Representative photomicrographs of immunohistochemical staining for TRPC6 in the control cortex (A), junction (B), and white matter (WM) (C), showing weak to moderate TRPC6 staining in neurons (arrows in A and B) and glia-like cells (arrowheads in B and C). (B inset, D–J) Double-label immunofluorescence showing TRPC6-positive cells in the control cortex. TRPC6 is shown in green; nuclei are stained with DAPI (blue). Antibodies against NeuN (B, inset) and glial fibrillary acidic protein (GFAP) (D) were used to label neurons and astrocytes, respectively. Antibodies against glutamate, glutamic acid decarboxylase 65 (GAD65), glutamic acid decarboxylase 67 (GAD67), andγ-aminobutyric acid (GABA) were used to label glutamatergic neurons and GABAergic neurons and are also shown in red (E–J). The merged images are shown in yellow. The merged images show the colocalization of TRPC6 (green) with NeuN (red) in neurons (B, insert) and with GFAP (red) in astrocytes (arrows in D and inset). TRPC6 (green, E) was coexpressed with the excitatory neurotransmitter glutamate (red, F) in neurons of the CTX samples (arrows in E–G), suggesting that they are glutamatergic neurons. Merged images show that TRPC6 (green) is coexpressed with the inhibitory neurotransmitter GABA (red) (arrows in H), and with GAD65 and GAD67 (red) in neurons of the CTX samples (arrows in I and J), indicating that they are GABAergic neurons. (K–T) TRPC6 in focal cortical dysplasia (FCD) type Ia (FCDIa) samples. Representative photomicrographs of immunohistochemical staining for TRPC6 in the cortex (K), junction (L), and white matter (M) of FCDIa samples, showing moderate to strong TRPC6 staining in neurons (arrows in K–O), including the microcolumns (insert a in K), pyramidal neurons (N) and heterotopic neurons (arrows in M and O) in the white matter, and glia-like cells (arrowheads in L and M). (Insert b in K, M–T) Merged images show the colocalization of TRPC6 (green) and NeuN (red) in the pyramidal neurons (insert in N) and heterotopic neurons (insert in O) and the colocalization with GFAP (red) in astrocytes (P). Double-label immunofluorescence confirmed that the neurons in the microcolumns (insert b in K) and the heterotopic neurons (insert in M) are glutamatergic neurons. The merged images also show the colocalization of TRPC6 (green) with the marker of glutamatergic neurons, glutamate (red) (arrows in Q), and with the markers of GABAergic neurons, GABA (red) (R), GAD65 (red) (S), and GAD67 (red) (arrows in T), in neurons of the FCDIa samples. Scale bars: A–C, K–M = 30 μm; D–J, P, Q, T = 25 μm; N, O, R, S = 10 μm.
FIGURE 4.
FIGURE 4.
Cell-specific distribution of TRPC6 in FCD types IIa and IIb. (A–K) TRPC6 in focal cortical dysplasia (FCD) type IIa (FCDIIa) samples. (A–C) There is moderate to strong TRPC6-immunoreactivity (-IR) in neurons, particularly the dysmorphic neurons (DNs), throughout the cortical layers (arrows in A and C) and in the white matter (arrows in B). Moderate to strong TRPC6-IR was also observed in glia-like cells in the FCDIIa samples (arrowheads in B). (Inset in C, D–K) Merged images show the colocalization of TRPC6 (green) with NeuN (red) (inset in C, D) in the DNs. Some scattered reactive astrocytes (GFAP-positive) are colabeled with TRPC6 (arrows in E–G). Double-label immunofluorescence shows that the TRPC6-positive DNs coexpressed either glutamate (H) or GABA (arrows in I); a few TRPC6-positive neurons colocalized with GAD65 (arrows in J) and GAD67 (arrows in K). (L–W) TRPC6 in FCD type IIb (FCDIIb) samples. There is moderate to strong TRPC6-IR in neurons, including dysmorphic neurons (DNs, arrows in L–N) and balloon cells (BCs, double-arrows in L and O). There is also moderate to strong TRPC6-IR in glia-like cells in the FCDIIb samples (arrowheads in M). (N–W) Merged images show colocalization of TRPC6 (green) with NeuN (red) (insert in N) in dystrophic neurons (DNs). TRPC6-positive BCs coexpress NeuN (insert in O) and glutamate (arrows in P). Double-label immunofluorescence showed that most of the TRPC6-positive BCs (double arrows) coexpressed glutamate (P). A few TRPC6-positive DNs and BCs coexpressed GABA, GAD65, and GAD67 (arrows in Q, R, S). TRPC6 was localized to a few GFAP-positive astrocytes (arrows in U–W) but not HLA-positive microglia (arrows in T). Scale bars: A, B, D–G, K–M = 30 μm; C, N, H–J, O = 10 μm; P–W = 20 μm.
FIGURE 5.
FIGURE 5.
Expression of BDNF in FCD types Ia, IIa, IIb and normal CTX specimens. (A) Real-time polymerase chain reaction analysis of BDNF mRNA expression in CTX, FCDIa, FCDIIa, and FCDIIb (n = 10 in each group). Greater BDNF mRNA levels were observed in the FCDIa, FCDIIa, and FCDIIb samples versus the CTX samples. BDNF mRNA expression was significantly greater in the FCDIIa and FCDIIb cortical lesions versus the FCDIa specimens. Error bars represent SE; *p < 0.05; **p < 0.01 versus CTX; #p < 0.05 versus FCDIa; ANOVA. (B) Representative immunoblots of BDNF in total homogenates from the FCDIa, FCDIIa, FCDIIb, and CTX samples. (C) Densitometric analyses of the Western blots. There was a significant increase in BDNF protein levels in the total homogenates from the FCDIa, FCDIIa, FCDIIb samples (n = 10 in each series) versus the CTX samples (n = 10). The expression of BDNF protein was also significantly greater in the FCDIIa and FCDIIb cortical lesions versus the FCDIa specimens. Error bars represent SE; *p < 0.05, **p < 0.01 versus CTX, #p < 0.05 versus FCDIa; ANOVA. There was no significant difference BDNF expression levels between the FCDIIa and FCDIIb samples. (D–L) BDNF-immunoreactivity (-IR) in the CTX, FCDIa, FCDIIa, and FCDIIb samples. Representative immunohistochemical staining for BDNF in the control cortex (D), junction (E), and white matter (F) showing weak to moderate BDNF staining in neurons (arrows in D and E) and glia-like cells (arrowheads in E and F). In FCDI samples there is moderate to strong BDNF staining in neurons (arrows in G and H), including the microcolumns (insert in G) in the gray matter and heterotopic neurons (arrows in H) in the white matter. There was also moderate BDNF staining in glia-like cells (arrowheads in H). There is moderate to strong BDNF staining in FCDIIa samples in the DNs (arrows in I and J) and glia-like cells (arrowheads in J and insert in J). In FCDIIb samples there was moderate to strong BDNF-IR in the DNs (arrows in K, L and insert in K) and BCs (double-arrows in K, L and insert in L), along with moderate to strong staining in glia-like cells (arrowheads in K and L). Scale bars: D–F, H–J, L = 30 μm; G, K = 50 μm.
FIGURE 6.
FIGURE 6.
Expression of CaMKIV protein in normal CTX and FCD types Ia, IIa, and IIb. (A) Representative immunoblots of CaMKIV in total homogenates from FCD types Ia (FCDIa), IIa (FCDIIa), and IIb (FCDIIb) lesions and CTX samples tissues (n = 10 in each group). (B) Densitometric analyses of the Western blots. There were significantly greater CaMKIV protein levels in the FCDIa, FCDIIa, and FCDIIb tissues versus the control samples. Importantly, protein levels of CaMKIV were significantly greater in the FCDIIa and FCDIIb cortical lesions versus FCDIa specimens. Error bars represent SE; *p < 0.05, **p < 0.01 versus CTX; #p < 0.05 versus FCDIa; ANOVA.

Similar articles

Cited by

References

    1. Palmini A, Holthausen H. Focal malformations of cortical development: A most relevant etiology of epilepsy in children. Handb Clin Neurol 2013;111:549–65 - PubMed
    1. Schwartzkroin PA, Walsh CA. Cortical malformations and epilepsy. Ment Retard Dev Disabil Res Rev 2000;6:268–80 - PubMed
    1. Crino PB, Miyata H, Vinters HV. Neurodevelopmental disorders as a cause of seizures: Neuropathologic, genetic, and mechanistic considerations. Brain Pathol 2002;12:212–33 - PMC - PubMed
    1. Mischel PS, Nguyen LP, Vinters HV. Cerebral cortical dysplasia associated with pediatric epilepsy. Review of neuropathologic features and proposal for a grading system. J Neuropathol Exp Neurol 1995;54:137–53 - PubMed
    1. Crino PB, Eberwine J. Cellular and molecular basis of cerebral dysgenesis. J Neurosci Res 1997;50:907–16 - PubMed