. 2016 Aug 5;15(8):2787-801.
doi: 10.1021/acs.jproteome.6b00366. Epub 2016 Jun 24.

Dynamic and Combinatorial Landscape of Histone Modifications during the Intraerythrocytic Developmental Cycle of the Malaria Parasite

Affiliations

Dynamic and Combinatorial Landscape of Histone Modifications during the Intraerythrocytic Developmental Cycle of the Malaria Parasite

Anita Saraf et al. J Proteome Res. .

Abstract

A major obstacle in understanding the complex biology of the malaria parasite remains to discover how gene transcription is controlled during its life cycle. Accumulating evidence indicates that the parasite's epigenetic state plays a fundamental role in gene expression and virulence. Using a comprehensive and quantitative mass spectrometry approach, we determined the global and dynamic abundance of histones and their covalent post-transcriptional modifications throughout the intraerythrocytic developmental cycle of Plasmodium falciparum. We detected a total of 232 distinct modifications, of which 160 had never been detected in Plasmodium and 88 had never been identified in any other species. We further validated over 10% of the detected modifications and their expression patterns by multiple reaction monitoring assays. In addition, we uncovered an unusual chromatin organization with parasite-specific histone modifications and combinatorial dynamics that may be directly related to transcriptional activity, DNA replication, and cell cycle progression. Overall, our data suggest that the malaria parasite has a unique histone modification signature that correlates with parasite virulence.

Keywords: cell cycle; epigenetics; histones; label-free quantification; malaria; multiple reaction monitoring; parasite; post-translational modifications; tandem mass spectrometry.


Figures

Figure 1
Figure 1. Qualitative overview of Plasmodium histones modifications
A. Detected PTMs on Plasmodium histone H4 are plotted along its sequence, while the plots for H2A, H2A.Z, H2B, H2B.Z, H3, and H3.3 are provided in Fig. S1. PTMs are sorted into three main categories based on their novelty status (see SI-3.1): 1) PTMs previously reported in Plasmodium falciparum and/or Toxoplasma gondii (red and orange symbols for non-conserved (n.c.) residues); 2) PTMs previously reported in species other than apicomplexans (black symbols); 3) novel PTMs on conserved residues are in bright green symbols, a subset of those are in lighter green symbols drawn with a black edge to denote that the amino acid had been previously reported as modified by other types of PTMs, while novel modifications on n.c. residues are in cyan. In addition, PTMs previously reported in other organisms but were not detected (n.d.) in our analysis are plotted as grey symbols, while PTMs previously detected in apicomplexans are colored in light pink (SI-3.1). Underlined amino acid residues are covered by detected peptides. Amino acids predicted to be within structured domains (SI-3.2) are highlighted in yellow. B. Total numbers of PTMs for each of the novelty categories. C. Spectral counts for peptides bearing the 232 detected PTMs within each of the novelty categories. D. Tally of the PTMs types falling into each of the novelty categories and the known PTMs not detected in our analysis.
Figure 2
Figure 2. Quantitative profiles of modification levels on Plasmodium histones
Percentages of modification occupancy calculated based on local spectral counts (SI-4.1) from all 14 analyses (“Mod/Total (%)” columns in SI-4.2) are plotted along the whole sequences of Plasmodium H2A.Z, H2B.Z, H3, and H4, while the plots for the other histones are provided in Fig. S2. Boundaries for the structural domains (N-terminal tail, core domain, and C-terminus) are shown by the red, green, and cyan boxes around the sequence numbering. When multiple PTMs are observed on one residue (SI-4.1), the modification with the highest levels is reported here. The measured levels of methionine oxidations are plotted for reference (grey bars). Box-plots are overlaid above the data points for the K acetylations within the N-terminal tails. Linear regressions through the data points within these boxes are plotted as a grey line and the adjusted R2 statistics calculated for each regression are provided.
Figure 3
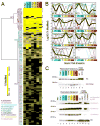
Figure 3. Dynamic landscape of PTM levels across seven erythrocytic stages of P. falciparum
A. Unsupervised hierarchical clustering analyses of histone PTMs. SpC-based modification levels (SI-4.2) are hierarchically clustered (SI-5.1) with Euclidean as the distance metric and Ward’s method with multiple-fragment heuristic algorithm (MF) as a seriation rule. For each of the 202 quantified histone PTMs (rows), the color intensity is proportional to the modification level (%) measured in each stage (columns). PTM types are color-coded as in Fig. 2 and the dendrogram line colors denote the modification type that is the most represented in each cluster. An expanded version of this heat map is provided in Fig. S3. B. k-means clustering of histone PTMs. Histone modifications optimally separate into eight k-means clusters using the Hartigan-Wong algorithm on their spectral count-based abundance during the IDC (SI-5.2). For each histone PTM, abundance values for the seven time points are expressed as the percentage of the maximum measured value for this PTM at any time point during the IDC. For each k-means cluster, log10 values of the average normalized modification level are plotted as a function of hours post-invasion (SI-5.1). Clusters are ordered based on the time point at which their maximum modification levels are measured (from 0 to 36-hpi), with cluster KC1 containing PTMs detected at near maximum levels across all seven time points. The number of PTMs in each cluster in indicated in the bottom right corner. The temporal profile of each individual PTMs is represented by lines color-coded by modification type, while thick black lines represent the result of multiple curves averaging. C. Validation of mass-spectrometry results by Western blot. Acetylation at H3-K27 and the three methylation states of H3-K4 are detected at seven time points of the parasite cell cycle using antibodies against the conserved modifications in S. cerevisiae. Whole cell extracts from wild-type yeast, a strain expressing the H3-K27A mutant, and yeast strains deficient in the H3-K4 methylating machinery are analyzed in parallel to ensure proper behavior of each antibody. Loading amounts in each lane are normalized using an antibody against Saccharomyces cerevisiae histone H3. K27ac levels in both H3 isoforms as measured by our MS analysis of the seven time points are indicated by the open red arrowheads on the right side of the heat map in A. While the peptide bearing H3-K4 was not detected by MS, mono-, di- ant tri-methylation of this residue are present at all stages of the parasite cell cycle, hence behaving similarly to H3-K27ac. An additional 30 PTMs are validated by MRM assays (SI-6.2), as indicated by arrowheads on the right side of the heat map in A. These arrowheads are color-coded by novelty status as in Fig.1A/S1.
Figure 4
Figure 4. Combinatorial associations between modifications on Plasmodium histone H3
The Apriori algorithm is used on the spectral counts of modified peptides (SI-5.3) to derive the probabilities of combinatorial associations between individual modified residues (SI-5.4). Frequencies of co-occurrence are plotted as cord diagrams using Circos. The ratio layout is used such as probabilities of PTMs XY given PTM X and of PTMs XY given PTM Y are depicted by one ribbon with ends of variable sizes corresponding to P(XY|X) and P(XY|Y) values. The order of the segments in the chord diagrams is imposed such as the PTMs locations are from N-terminus to C-terminus (segment starting at 12:00, clockwise), while the segments and ribbons are colored based on modification types as in Fig. 2. A. Frequencies of co-occurrence derived from the merged dataset (“ALL”). The outer segments reflect the location of each residue along H3 sequence (N-terminal tail or core domain). Full-sized Circos output images for all histones are provided in Fig. S4A. B. Frequencies of co-occurrence calculated for each of the seven time-points (0 to 36-hpi). The dynamic combinatorial patterns between residues located within H3 core domain (CD) are shown. The outer segments and ribbons are colored based on the type of PTMs, while the inner quadrants are colored to denote the time points at which PTM combinations are observed. For all histones, full-sized Circos output images for the dynamic combinatorial patterns between residues located within the N-terminal tails or core domains are provided in Fig. S4B. C. Mapping of the combinatorial peptide bearing K79me2 and Y99phs on histone H3 in the tridimensional structure of the human nucleosome. Dimethyl and phosphate groups were added to the side-chains of H3-K79 and Y99, respectively, using the Vienna-PTM 2.0 web application. Histones backbones are displayed as ribbon cartoons: H2A in blue/cyan; H2B in green/bright green; H3 in magenta/light pink; H4 in orange/yellow. Modified residues side-chains are displayed as space-filled atoms color-coded using the CPK convention and their labels are cyan for methylation and dark yellow for phosphorylation. Additional structural analyses of combinatorial peptides on H2B and H3 are provided in SI-3.3.C. D. MRM assay to validate the co-occurrence of H3-K79me2 and H3-Y99phs. Five transitions of the peptide bearing both H3-K79 and Y99 (LysC + GluC digested) are assayed for the presence of dimethylation on K79 and phosphorylation on Y99 at 0-, 18- and 36-hpi. The only positive identifications are reproducibly observed at 36-hpi (see SI-6.2), with a representative MRM spectrum shown here, confirming the MudPIT results (see combination highlighted in yellow in A and B panels).

Similar articles

Cited by

References

    1. Martin C, Zhang Y. Mechanisms of epigenetic inheritance. Curr Opin Cell Biol. 2007;19(3):266–72. - PubMed
    1. Ruthenburg AJ, Li H, Patel DJ, Allis CD. Multivalent engagement of chromatin modifications by linked binding modules. Nat Rev Mol Cell Biol. 2007;8(12):983–94. - PMC - PubMed
    1. Tan M, Luo H, Lee S, Jin F, Yang JS, Montellier E, Buchou T, Cheng Z, Rousseaux S, Rajagopal N, Lu Z, Ye Z, Zhu Q, Wysocka J, Ye Y, Khochbin S, Ren B, Zhao Y. Identification of 67 histone marks and histone lysine crotonylation as a new type of histone modification. Cell. 2011;146(6):1016–28. - PMC - PubMed
    1. Rivera C, Gurard-Levin ZA, Almouzni G, Loyola A. Histone lysine methylation and chromatin replication. Biochim Biophys Acta. 2014;1839(12):1433–9. - PubMed
    1. Smith OK, Kim R, Fu H, Martin MM, Lin CM, Utani K, Zhang Y, Marks AB, Lalande M, Chamberlain S, Libbrecht MW, Bouhassira EE, Ryan MC, Noble WS, Aladjem MI. Distinct epigenetic features of differentiation-regulated replication origins. Epigenetics Chromatin. 2016;9:18. - PMC - PubMed

Publication types

MeSH terms