. 2016 Jun 13:7:11640.
doi: 10.1038/ncomms11640.

MTHFD1 controls DNA methylation in Arabidopsis

Affiliations

MTHFD1 controls DNA methylation in Arabidopsis

Martin Groth et al. Nat Commun. .

Abstract

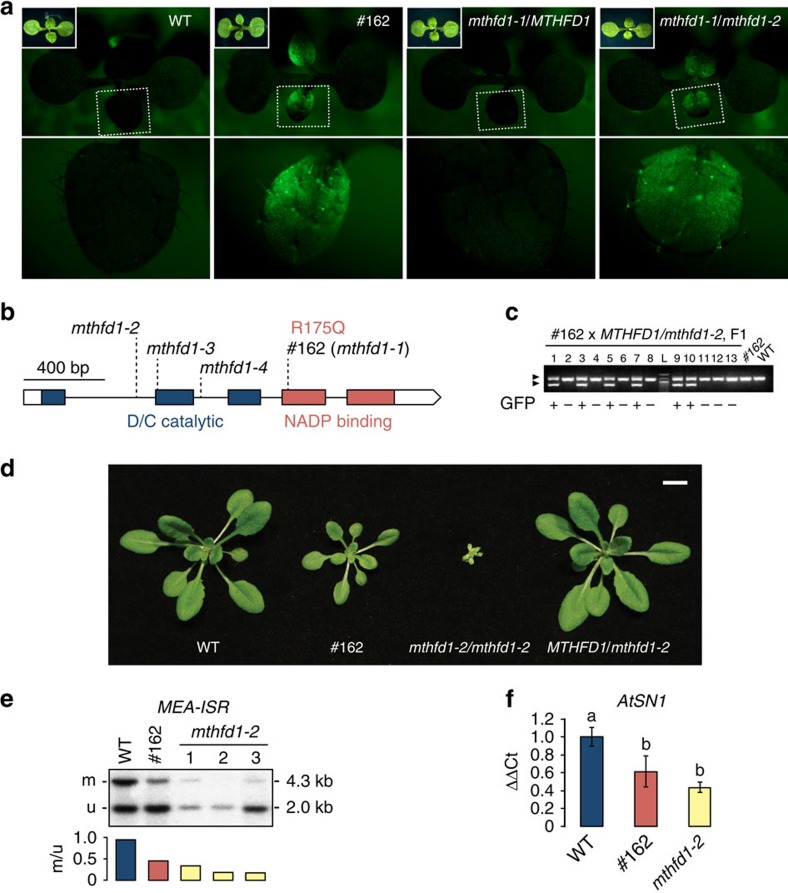
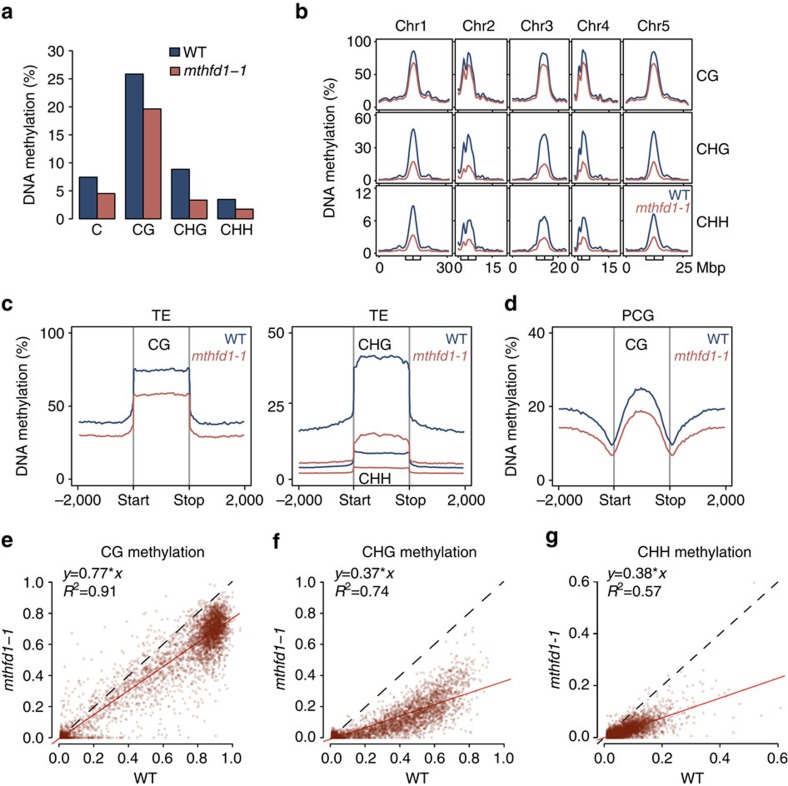
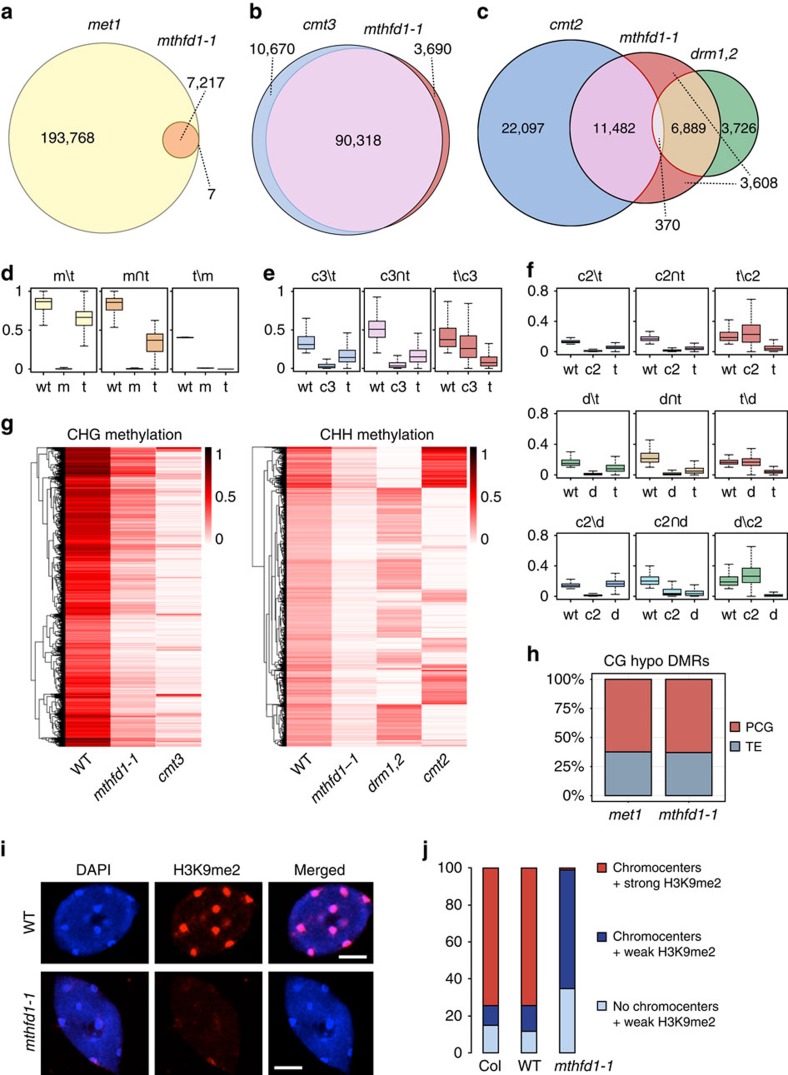
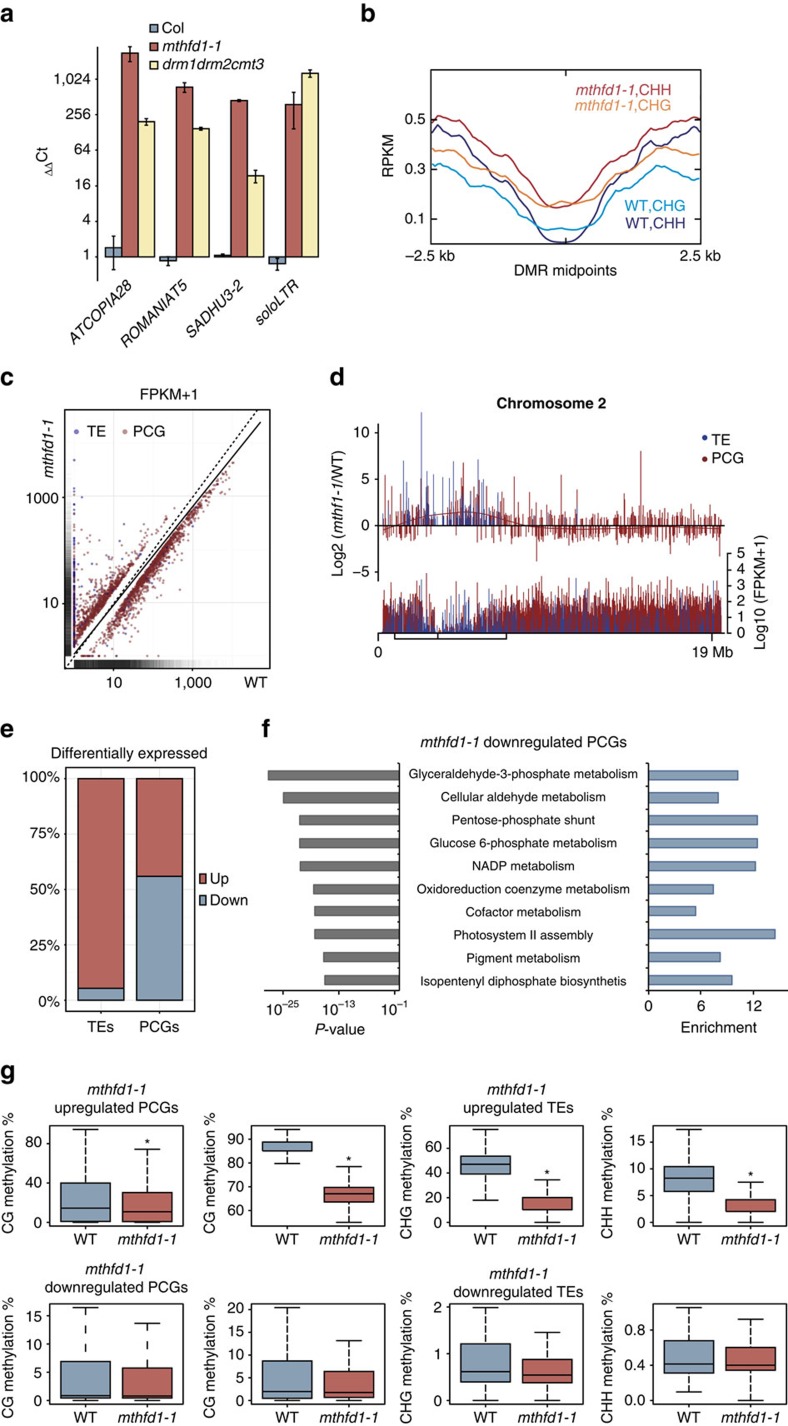
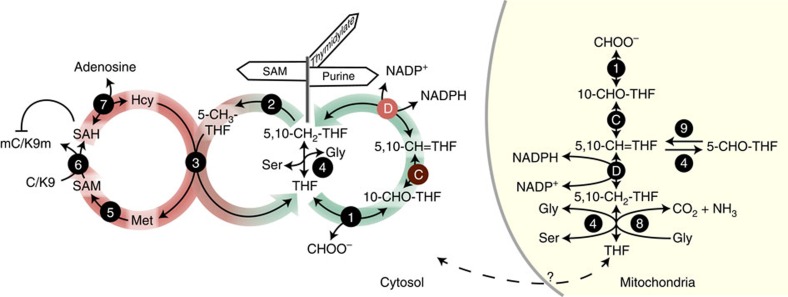
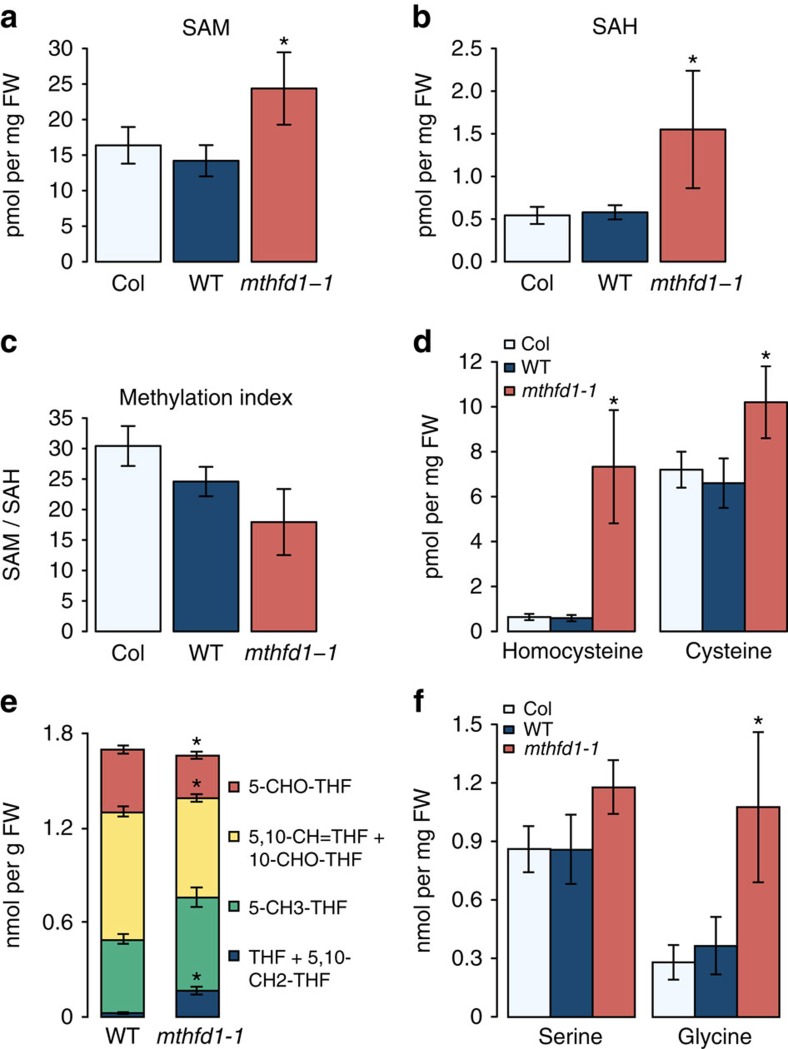
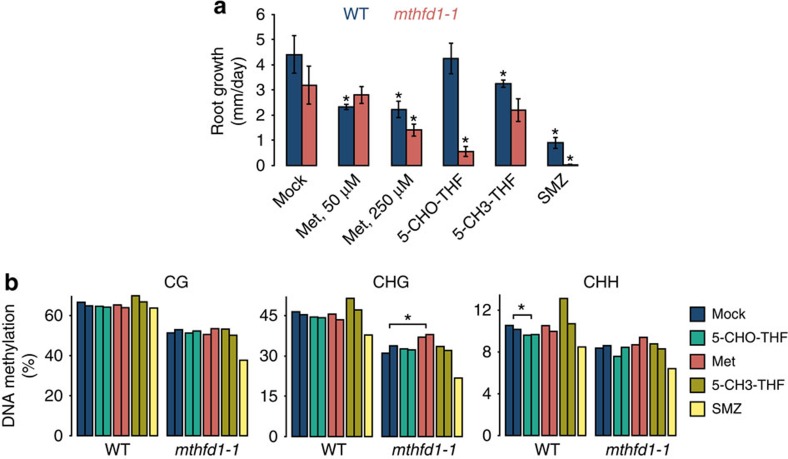
DNA methylation is an epigenetic mechanism that has important functions in transcriptional silencing and is associated with repressive histone methylation (H3K9me). To further investigate silencing mechanisms, we screened a mutagenized Arabidopsis thaliana population for expression of SDCpro-GFP, redundantly controlled by DNA methyltransferases DRM2 and CMT3. Here, we identify the hypomorphic mutant mthfd1-1, carrying a mutation (R175Q) in the cytoplasmic bifunctional methylenetetrahydrofolate dehydrogenase/methenyltetrahydrofolate cyclohydrolase (MTHFD1). Decreased levels of oxidized tetrahydrofolates in mthfd1-1 and lethality of loss-of-function demonstrate the essential enzymatic role of MTHFD1 in Arabidopsis. Accumulation of homocysteine and S-adenosylhomocysteine, genome-wide DNA hypomethylation, loss of H3K9me and transposon derepression indicate that S-adenosylmethionine-dependent transmethylation is inhibited in mthfd1-1. Comparative analysis of DNA methylation revealed that the CMT3 and CMT2 pathways involving positive feedback with H3K9me are mostly affected. Our work highlights the sensitivity of epigenetic networks to one-carbon metabolism due to their common S-adenosylmethionine-dependent transmethylation and has implications for human MTHFD1-associated diseases.


Figures

Figure 1
Figure 1. SDCpro-GFP expression and DNA demethylation caused by R175Q mutation in MTHFD1.
(a) GFP fluorescence micrographs of WT, #162 M2, MTHFD1/mthfd1-2 F1 and #162/mthfd1-2 F1 seedlings. F1 are progeny of #162 M2 x MTHFD1/mthfd1-2. Dashed boxes indicate magnified areas shown in lower panels. Inlets show bright-field images. (b) Gene structure, positions of mutations and conserved domains of MTHFD1. The EMS mutation in #162 lead to a R175Q substitution of a conserved residue required for NADP binding. (c) PCR-based genotype analysis of 13 F1 seedlings and two control samples. Arrowheads mark bands corresponding to WT/mthfd1-1 (upper) and mthfd1-2 (lower). The mthfd1-2 allele co-segregates with GFP fluorescence in F1 (+: present, −: absent). L, ladder. (d) Habit of different genotype plants 20 days after germination. Scale bar, 10 mm. (e) DNA blot analysis of non-CG methylation at the MEA-ISR locus. Genomic DNA was digested with methylation-sensitive MspI; upper and lower bands correspond to methylated (m) and unmethylated (u) fragments, respectively. Ratios of band intensities for each lane are shown under the gel image. (f) Levels of non-CG methylation at the AtSN1 locus by quantitative chop PCR analysis of genomic DNA after digestion with methylation-sensitive HaeIII relative to undigested DNA. Mean values±s.d. (n=3). Different letters above bars indicate significant differences between pairwise comparisons by Student's t-test (P<0.05).
Figure 2
Figure 2. DNA methylation is globally decreased in mthfd1-1 mutants.
(a) Average genome-wide DNA methylation for all Cs and in individual sequence contexts (H=C, A or T). (b) Chromosomal distribution of fractional DNA methylation in individual sequence contexts. Boxes and vertical lines inside boxes mark pericentromeric regions and centromeres, respectively. (c,d) Average distribution of DNA methylation over TEs (c) and PCGs (d) and the flanking 2,000 bp in individual sequence contexts. (eg) Comparison of DNA methylation levels in 5,000 random 100 bp bins with WT methylation levels >0.01 in CG (e), CHG (f) and CHH (g) contexts. Red line: linear regression between mthfd1-1 and WT levels; corresponding coefficients are shown in top left corners. Dashed: identity line.
Figure 3
Figure 3. mthfd1-1 mostly interferes with non-CG and H3K9 methylation.
(ac) Overlap between hypo-DMRs of different mutants in CG (a), CHG (b) and CHH (c) contexts. (df) CG (d), CHG (e) and CHH (f) methylation levels in DMR fractions corresponding to (ac), respectively. w=wild-type, m=met1, t=mthfd1-1, c3=cmt3, c2=cmt2, d=drm1,2. Box plot (herein and after): horizontal line, median; edges of boxes, 25th (bottom) and 75th (top) percentiles; error bars, minimum and maximum points within 1.5 × interquartile range. (g) Heat map of DNA methylation levels in mthfd1-1 hypo-DMRs (rows) clustered by methylation levels. (h) Overlap of met1 or mthfd1-1 CG hypo-DMRs with PCGs or TEs. (i) Fluorescence micrographs of representative nuclei from WT and mthfd1-1. DNA was stained with DAPI and H3K9me2 was immunostained using Alexa Fluor 647 as secondary antibody. Scale bar, 5 μm. (j) Number of nuclei classified by DAPI staining and H3K9me2 immunofluorescence.
Figure 4
Figure 4. mthfd1-1 mutants show loss of TE silencing and pleiotropic transcriptional deregulation of PCGs.
(a) Quantitative RT-PCR analysis of four exemplary TEs. Transcript levels are normalized to ACTIN7 and relative to WT, and mean values±s.e.m. (n=3) are shown. (b) Average distribution of normalized RNA-seq reads (RPKM) over mthfd1-1 hypo-DMRs in CHG or CHH context. X axis indicates distance from the DMR midpoints. (c) Scatter plot showing normalized transcript levels (FPKM+1) of differentially expressed PCGs and TEs in mthfd1-1 versus WT. Solid line: linear regression through all TEs and PCGs. Dashed: identity line. Marginal density plots: distribution of all TEs and PCGs in WT (x axis) and mthfd1-1 (y-axis). (d) Distribution of average normalized transcript levels (FPKM+1) of all TEs and PCGs from mthfd1-1 and WT (lower panel) and fold change in normalized transcript levels of differentially expressed PCGs and TEs (upper panel) along chromosome 2. Box and vertical line inside box mark pericentromeric region and centromere, respectively. (e) Fraction of TEs and PCGs significantly up- or downregulated in mthfd1-1. (f) Enrichment score and statistical significance of GO processes annotated to mthfd1-1-downregulated PCGs. (g) Methylation levels over mthfd1-1 differentially expressed PCGs and TEs in different sequence contexts.
Figure 5
Figure 5. Schematic representation of plant SAM and folate metabolism in the cytosol and mitochondria.
One-carbon enters the cytoplasmic folate cycle (green) either through formyltetrahyrofolate synthetase (1) or SHMT (4); MTHFD1 reversibly interconverts 10-CHO-THF to 5,10-CH2-THF by cyclohydrolase (C) and NADP+-dependent dehydrogenase (D) activity. 5,10-CH2-THF serves for thymidylate synthesis or is converted by methylenetetrahyrofolate reductase (2) to 5-CH3-THF, which enters the Met cycle (red) and serves for Hcy remethylation to Met by methionine synthase (3) (ref. 17). SAM synthetase (5) converts Met to SAM, which is further converted to SAH (6) during methylation of cytosines, H3K9 and so on. SAH is a competitive inhibitor of methyltransferases (6) and is recycled to Hcy by SAH hydrolase (7) (ref. 23). In mitochondria, one-carbon is transferred to THF during the oxidation of Gly by the glycine decarboxylase complex (8), but surplus of Gly due to photorespiration leads to consumption of one-carbon by SHMT during serine production. 5-CHO-THF, a byproduct of SHMT, is metabolized by mitochondrial 5-formyltetrahyrofolate cycloligase in order to re-enter the folate cycle (9) (ref. 59). Shuttle of THF between mitochondria and the cytosol has been described in other organisms, but remains uncharacterized in plants.
Figure 6
Figure 6. Cytoplasmic localization of MTHFD1-YPET-3xFLAG.
(a) Confocal micrographs of MTHFD1-YPET-3xFLAG (M) and FOLD4-YPET-3xFLAG (F) transiently expressed in N. benthamiana. Excitation (λ, nm)/filters (λ, nm): YFP=514/519–559, chlorophyll=488/630–730, DAPI=405/409–530, and fluorescence overlay with bright field. Scale bars, 50 μm. (b) Western blot using anti-FLAG antibody against anti-GFP-immunopurified extracts from N. benthamiana (IN) transiently expressing free YFP (Y), MTHFD1-YPET-3xFLAG (M), MTHFD1_R175Q-YPET-3xFLAG (m), or FOLD4-YPET-3xFLAG (F). Arrowhead indicates unspecific binding of anti-FLAG (shown as loading reference).
Figure 7
Figure 7. mthfd1-1 mutants show impaired one-carbon cycle.
(af) Steady-state levels of SAM (a), SAH (b), Methylation Index (MI) (c), selected thiols (d), folates (e) and selected amino acids (f) in leaves of Col, WT and the mthfd1-1 mutant. Data represent means±SD. Asterisks indicate significant differences determined by Student's t-test (P<0.05, n≥3).
Figure 8
Figure 8. mthfd1-1 mutants are hypersensitive to exogenous 5-CHO-THF but tolerant to exogenous methionine.
(a) Root growth of seedlings on solid media containing mock, Met, 0.5 mM 5-CHO-THF, 0.5 mM 5-CH3-THF or 5 μM SMZ. Mean values±s.d. (n=3) are shown. (b) Average CG, CHG and CHH methylation levels at previously defined mthfd1-1 CG, CHG and CHH hypo-DMRs, respectively, in seedlings grown for 14 days on solid media containing mock, 0.1 mM Met, 0.5 mM 5-CHO-THF, 0.5 mM 5-CH3-THF or 5 μM SMZ. Two biological replicates are shown, except for SMZ. * indicates significant difference between mock and chemical treatment (P<0.05, Student's t-test).

References

    1. Law J. A. & Jacobsen S. E. Establishing, maintaining and modifying DNA methylation patterns in plants and animals. Nat. Rev. Genet. 11, 204–220 (2010). - PMC - PubMed
    1. Cao X. & Jacobsen S. E. Role of the arabidopsis DRM methyltransferases in de novo DNA methylation and gene silencing. Curr. Biol. 12, 1138–1144 (2002). - PubMed
    1. Woo H. R., Dittmer T. A. & Richards E. J. Three SRA-domain methylcytosine-binding proteins cooperate to maintain global CpG methylation and epigenetic silencing in Arabidopsis. PLoS Genet. 4, e1000156 (2008). - PMC - PubMed
    1. Johnson L. M. et al. The SRA methyl-cytosine-binding domain links DNA and histone methylation. Curr. Biol. 17, 379–384 (2007). - PMC - PubMed
    1. Du J. et al. Dual binding of chromomethylase domains to H3K9me2-containing nucleosomes directs DNA methylation in plants. Cell 151, 167–180 (2012). - PMC - PubMed

Publication types

MeSH terms