. 2016 Jun 13:7:ncomms11845.
doi: 10.1038/ncomms11845.

Spatial niche formation but not malignant progression is a driving force for intratumoural heterogeneity

Affiliations

Spatial niche formation but not malignant progression is a driving force for intratumoural heterogeneity

Rouven Hoefflin et al. Nat Commun. .

Abstract

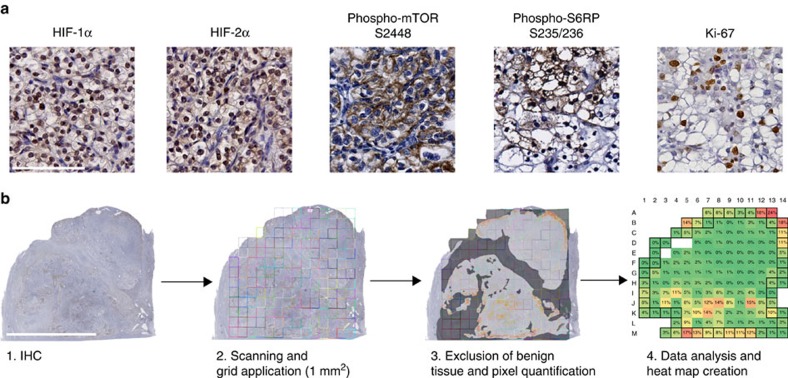
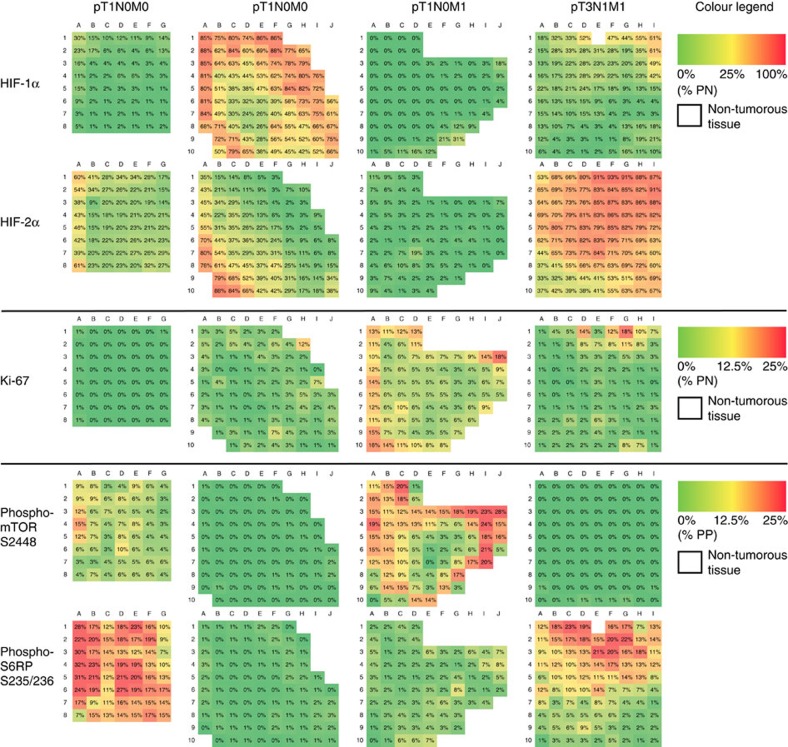
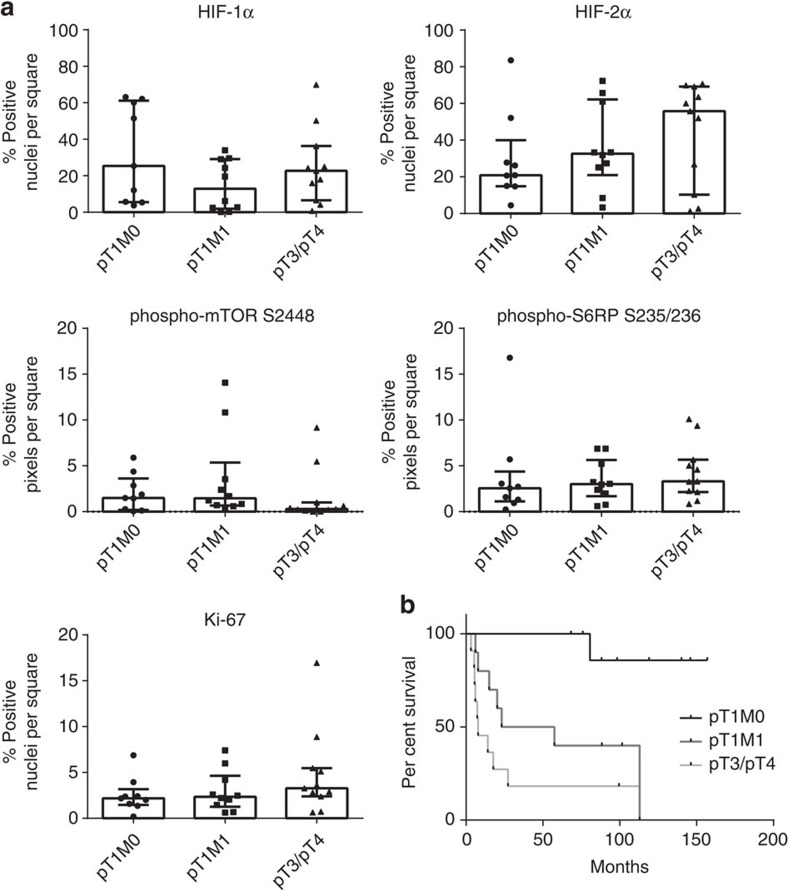
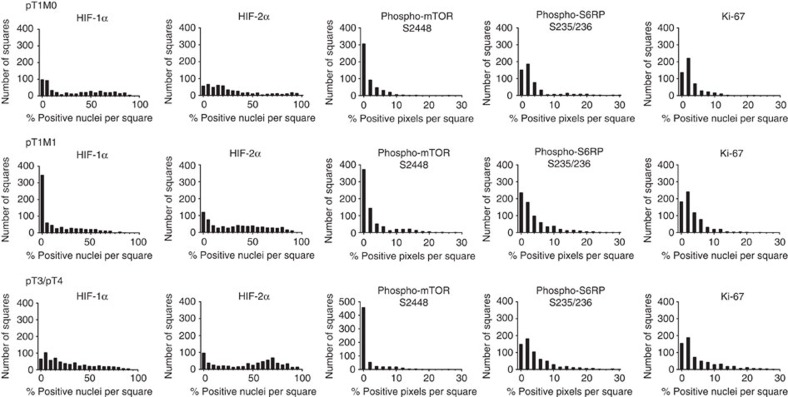
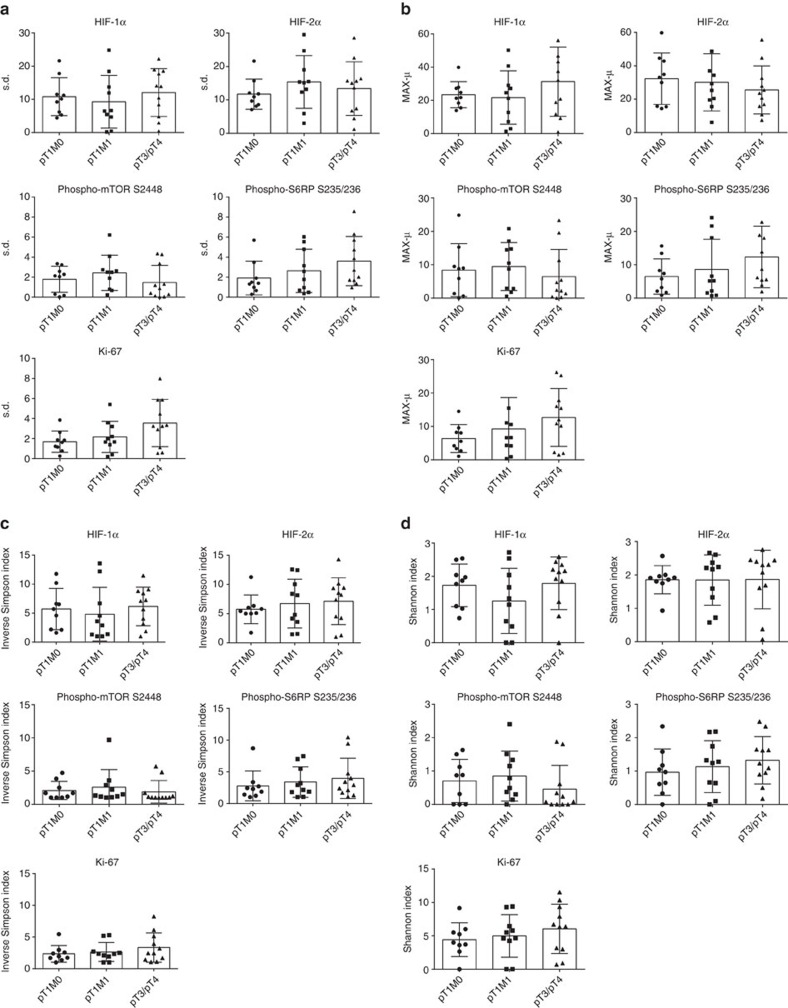
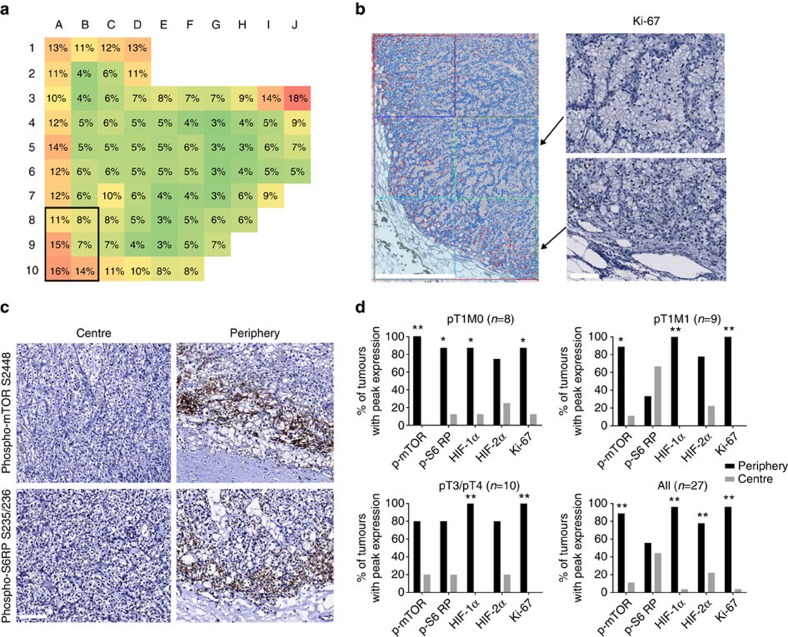
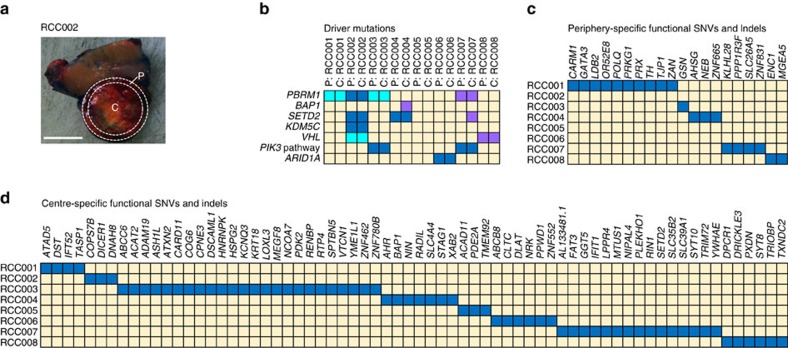
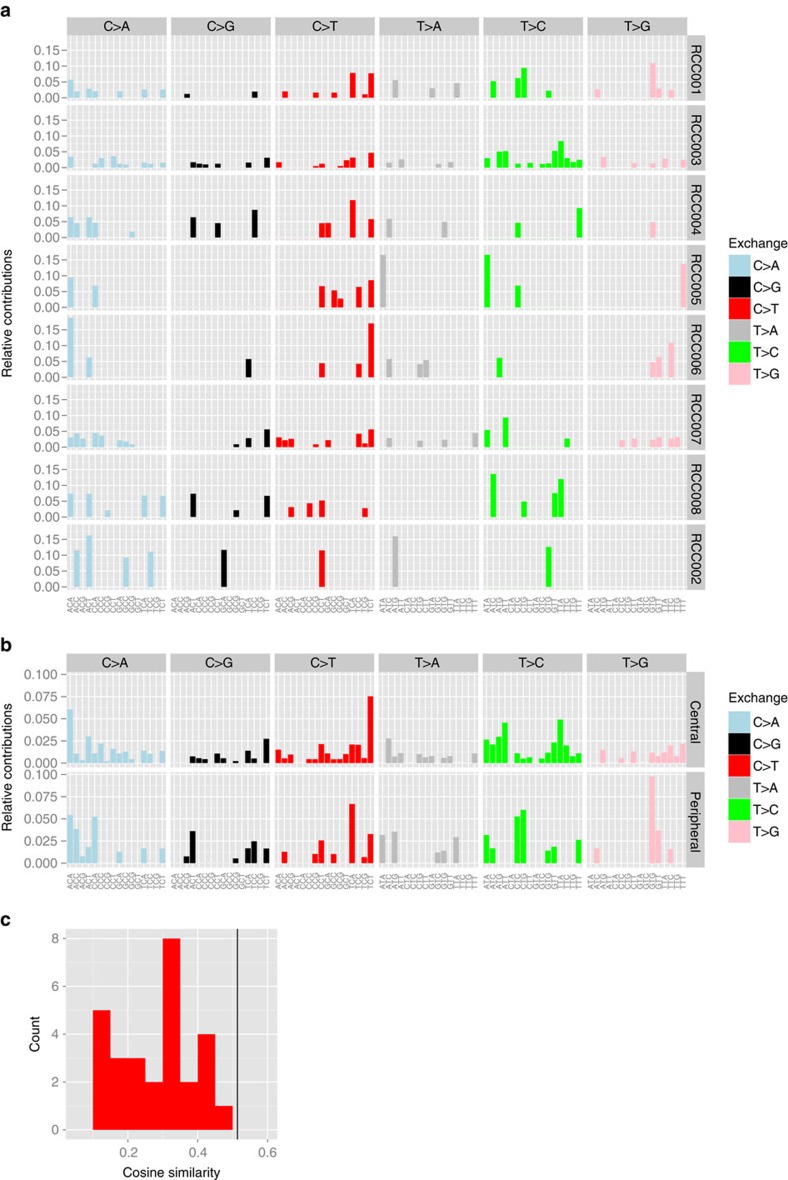
Intratumoural heterogeneity (ITH) is a major cause of cancer-associated lethality. Extensive genomic ITH has previously been reported in clear cell renal cell carcinoma (ccRCC). Here we address the question whether ITH increases with malignant progression and can hence be exploited as a prognostic marker. Unexpectedly, precision quantitative image analysis reveals that the degree of functional ITH is virtually identical between primary ccRCCs of the lowest stage and advanced, metastatic tumours. Functional ITH was found to show a stage-independent topological pattern with peak proliferative and signalling activities almost exclusively in the tumour periphery. Exome sequencing of matching peripheral and central primary tumour specimens reveals various region-specific mutations. However, these mutations cannot directly explain the zonal pattern suggesting a role of microenvironmental factors in shaping functional ITH. In conclusion, our results indicate that ITH is an early and general characteristic of malignant growth rather than a consequence of malignant progression.


Figures

Figure 1
Figure 1. Precision quantitative image analysis workflow for the characterization of functional ITH.
(a) Representative areas with positive immunohistochemical (IHC) staining for HIF-1α, HIF-2α, phospho-mTOR S2448, phospho-S6RP S235/236 and Ki-67. Only nuclear HIF-1α and HIF-2α expression was included in the analysis. Scale bar, 100 μm. (b) Overview of the quantitative IHC analysis process using a representative image of a whole-slide scanned pT1M1 tumour after phospho-mTOR S2448 staining. The image was overlaid with a virtual grid consisting of 1 mm2 squares that defines the tumour regions to be analysed. Non-cancerous tissue was subtracted manually (dark grey) and a positive pixel count was performed on the corrected area. Positivity per square was expressed as percentage of positive pixels. If a square contained non-tumorous tissue, the positivity was normalized to the corrected square area. Computed values were depicted as a heat map. Coloured squares represent tumour, whereas open squares indicate completely non-tumorous areas. Squares defined as peripheral tumour zone are marked by a black line. Scale bar, 1 cm.
Figure 2
Figure 2. Functional ITH is independent from tumour stage.
Representative heat maps of biomarker expression (HIF-1α, HIF-2α, phospho-mTOR S2448, phospho-S6RP S235/236 and Ki-67) in different prognostic subgroups. Positivity per square was calculated using the positive nuclear count for HIF-1α, HIF-2α and Ki-67, and expressed as percentage positive nuclei (% PN). Colours correspond to % PN and range from absent (0% PN; green) to high (100% PN; red) for HIF-1α and HIF-2α. Ki-67 showed a maximum of 25% PN and thus is represented by a smaller range from 0% PN (green) to 25% PN (red). Cytoplasmic staining for phospho-mTOR S2448 and phospho-S6RP S235/236 was analysed as shown in Fig. 1 and expressed as percentage positive pixels (% PP). Note that a square with 25% PP is considered completely positive. White squares represent completely non-cancerous tissue and were excluded from analysis.
Figure 3
Figure 3. Quantification of functional ITH in prognostic ccRCC subgroups.
(a) Scatter plots showing median±interquartile range of the mean percentage positive pixels (phospho-mTOR S2448 and phospho-S6RP S235/236) or mean percentage positive nuclei (HIF-1α, HIF-2α and Ki-67) per tumour. No statistically significant differences were observed between subgroups (P>0.05, Kruskal–Wallis test for multiple comparisons). (b) Kaplan–Meier cancer-specific survival analysis of the patients.
Figure 4
Figure 4. Heterogeneous expression of markers of functional ITH in prognostic ccRCC subgroups.
Cumulative histograms of tumour subgroups representing the number of squares that contained a certain percentage of positive pixels or positive nuclei are shown. None of the marker distribution passed the D'Agostino–Pearson omnibus normality test indicating a non-Gaussian distribution and therefore a heterogeneous expression pattern in all three prognostic subgroups.
Figure 5
Figure 5. Functional ITH is stage independend as measured by heterogeneity scores and biodiversity indices.
(ad) Scatter plots representing mean±s.d. and individual values of the heterogeneity scores s.d. (a), MAX-μ (b), inverse Simpson index (c) and Shannon index (d) for the indicated biomarkers and prognostic subgroups.
Figure 6
Figure 6. Topological differences in functional ITH define tumour centre and periphery as distinct spatial niches.
(a,b) Heat map and immunohistochemical staining of a representative ccRCC for Ki-67. A representative picture showing the PNC analysis is shown in (b, left panel). Positive nuclei are false coloured in red, negative nuclei blue. Scale bar, 1 mm. High-power views of squares B9 and B10 immunostained for Ki-67 are shown (b, right panels). Note the differences in proliferating cells between squares B9 (centre) and B10 (periphery). Scale bar, 100 μm. (c) Representative immunohistochemical stainings for phospho-mTOR S2448 and phospho-S6RP S235/236 in the tumour centre and the tumour periphery. Scale bar, 100 μm. (d) Each bar shows the percentage of tumours with peak marker expression in the central (grey bars) versus peripheral (black bars) tumour zone. Significance was assessed using the Bernoulli trial (*P<0.05, **P<0.01).
Figure 7
Figure 7. Whole-exome sequencing reveals distinct mutations in the tumour centre and periphery.
(a) Macroscopic view of RCC002 with centre (C) and periphery (P) labelled as dissected. Scale bar, 1 cm. (b) Map of driver mutations found in the tumour periphery or tumour centre of all samples. Colour indicates the presence of a mutation (blue, nonsynonymous SNV; lavender, frameshift; cyan, stop gain/loss). Yellow indicates the absence of a mutation. (c,d) Maps of functional SNVs and indels (blue) specific for the tumour periphery (c) or centre (d).
Figure 8
Figure 8. Mutational signatures do not differ between the tumour periphery and the tumour centre.
(a,b) Triplet distribution of functional SNVs per patient (a) and per stratum (b), relative contributions. The x axis indicates the triplet context. (c) Cosine similarities of pair-wise comparisons of the patient-specific distributions (red histogram) and of the merged sets of central and peripheral SNVs (black vertical line).

References

    1. Nowell P. The clonal evolution of tumor cell populations. Science 194, 23–28 (1976). - PubMed
    1. Cahill D. P., Kinzler K. W., Vogelstein B. & Lengauer C. Genetic instability and darwinian selection in tumours. Trends Cell Biol. 9, M57–M60 (1999). - PubMed
    1. Burrell R. A., McGranahan N., Bartek J. & Swanton C. The causes and consequences of genetic heterogeneity in cancer evolution. Nature 501, 338–345 (2013). - PubMed
    1. Fisher R., Pusztai L. & Swanton C. Cancer heterogeneity: implications for targeted therapeutics. Br. J. Cancer 108, 479–485 (2013). - PMC - PubMed
    1. Gerlinger M. et al. Intratumor heterogeneity and branched evolution revealed by multiregion sequencing. N. Engl. J. Med. 366, 883–892 (2012). - PMC - PubMed

Publication types

Substances