. 2016 Sep 15;594(18):5237-54.
doi: 10.1113/JP272441. Epub 2016 Jul 24.

Revisiting Frank-Starling: regulatory light chain phosphorylation alters the rate of force redevelopment (ktr ) in a length-dependent fashion

Affiliations

Revisiting Frank-Starling: regulatory light chain phosphorylation alters the rate of force redevelopment (ktr ) in a length-dependent fashion

Christopher N Toepfer et al. J Physiol. .

Abstract

Key points: Regulatory light chain (RLC) phosphorylation has been shown to alter the ability of muscle to produce force and power during shortening and to alter the rate of force redevelopment (ktr ) at submaximal [Ca(2+) ]. Increasing RLC phosphorylation ∼50% from the in vivo level in maximally [Ca(2+) ]-activated cardiac trabecula accelerates ktr . Decreasing RLC phosphorylation to ∼70% of the in vivo control level slows ktr and reduces force generation. ktr is dependent on sarcomere length in the physiological range 1.85-1.94 μm and RLC phosphorylation modulates this response. We demonstrate that Frank-Starling is evident at maximal [Ca(2+) ] activation and therefore does not necessarily require length-dependent change in [Ca(2+) ]-sensitivity of thin filament activation. The stretch response is modulated by changes in RLC phosphorylation, pinpointing RLC phosphorylation as a modulator of the Frank-Starling law in the heart. These data provide an explanation for slowed systolic function in the intact heart in response to RLC phosphorylation reduction.

Abstract: Force and power in cardiac muscle have a known dependence on phosphorylation of the myosin-associated regulatory light chain (RLC). We explore the effect of RLC phosphorylation on the ability of cardiac preparations to redevelop force (ktr ) in maximally activating [Ca(2+) ]. Activation was achieved by rapidly increasing the temperature (temperature-jump of 0.5-20ºC) of permeabilized trabeculae over a physiological range of sarcomere lengths (1.85-1.94 μm). The trabeculae were subjected to shortening ramps over a range of velocities and the extent of RLC phosphorylation was varied. The latter was achieved using an RLC-exchange technique, which avoids changes in the phosphorylation level of other proteins. The results show that increasing RLC phosphorylation by 50% accelerates ktr by ∼50%, irrespective of the sarcomere length, whereas decreasing phosphorylation by 30% slows ktr by ∼50%, relative to the ktr obtained for in vivo phosphorylation. Clearly, phosphorylation affects the magnitude of ktr following step shortening or ramp shortening. Using a two-state model, we explore the effect of RLC phosphorylation on the kinetics of force development, which proposes that phosphorylation affects the kinetics of both attachment and detachment of cross-bridges. In summary, RLC phosphorylation affects the rate and extent of force redevelopment. These findings were obtained in maximally activated muscle at saturating [Ca(2+) ] and are not explained by changes in the Ca(2+) -sensitivity of acto-myosin interactions. The length-dependence of the rate of force redevelopment, together with the modulation by the state of RLC phosphorylation, suggests that these effects play a role in the Frank-Starling law of the heart.

Keywords: cardiac muscle; force redevelopment; muscle contraction; phosphorylation; regulatory light chain.


Figures

Figure 1
Figure 1. Step‐release protocol on control trabecula
A, time course of force changes (black) of a trabecula following temperature‐jump activation. Isometric force (F iso) is reached before an 8% step release is applied. Force recovery after the release is fit with a single exponential (Blue & McMurray, 2005). B, representative motor output traces showing the step protocols for step release protocols of three different amplitudes. C, expanded force trace directly after step‐release. Time zero is set to be the time after the end of the step release when force deviated from zero (F = 0). D, representative force recoveries observed after step releases of variable amplitude leading to different sarcomere lengths after the end of the step release. Each plot is fit with a single exponential (continuous lines). E, plot of residuals for each slack protocol performed in (D).
Figure 2
Figure 2. Release‐ramp protocols
A, time course of length changes of varying speed and amplitude applied to trabeculae by the length transducer. The differences between 0.3, 0.5 and 1 FL s–1 release velocities are seen. B, time course of force recovery (F rec) after release‐ramp protocols of different velocities. Each force recovery is fit with a single exponential. C, plot of residuals for each release ramp protocol shown in (B). D, time course of force changes from three trabeculae at differing RLC phosphorylation levels, induced by the slowest ramp shown in (A). The force signals show that the force level during the fixed velocity ramp (F ramp) depends on the RLC phosphorylation level. Phosphorylation also affects the ability of trabeculae to recover force after the end of the ramp‐release (F rec).
Figure 3
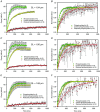
Figure 3. The effect of step release protocol on force redevelopment at three RLC phosphorylation levels
A, averaged time course of force recovery F rec at SL = 1.94 μm. B, same records as in (A) after normalization for isometric force reached after force recovery. C, averaged time course of force recovery F rec at SL = 1.90 μm. D, same records as in (C) after normalization. E, averaged time course of force recovery F rec at SL = 1.85 μm. F, same records as in (E) after normalization. Each trace in (B), (D) and (E) is fitted with an exponential function to determine k tr. All data points are the mean ± SEM (n = 5) and fit by a single exponential.
Figure 4
Figure 4. The effect of RLC phosphorylation on ktr following the step‐release protocol
A, plot of k tr as a function of normalized RLC phosphorylation at three sarcomere lengths. Reduced phosphorylation is 0.69 ± 0.04, control phosphorylation is 1.13 ± 0.07 and phosphorylated is 1.45 ± 0.1. *Significant difference compared to phosphorylated, where P < 0.05. #Significant difference compared to control phosphorylation where P < 0.05. B, plot of k tr as a function of sarcomere length (SL) for three different RLC phosphorylation levels. Data are the mean ± SEM. Linear regression is used to fit k tr as a function of sarcomere length data (n = 5 for each point). The slopes of the regressions are 79 ± 14, 8 ± 0.2 and 26 ± 3 s−1 μm−1 for phosphorylated, control phosphorylation and reduced phosphorylation, respectively (n = 5). Significance was achieved between each slope, where P < 0.05. *Significant difference compared to 1.94 μm, where P < 0.05. #Significant difference compared to 1.90 μm, where P < 0.05. C, bar graph depicting F iso for each RLC phosphorylation level at each sarcomere length. *Significant difference compared to control phosphorylation (and phosphorylated) within SLs, where P < 0.05. #Significant difference compared to corresponding phosphorylation levels at 1.94 μm, where P ≤ 0.05.
Figure 5
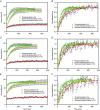
Figure 5. The effect of RLC phosphorylation levels on ktr in release‐ramp protocols on force redevelopment at three RLC phosphorylation levels
A, time course of force redevelopment F rec after shortening at 1 FL s–1. B, the same records as in (A) after normalization. C, time course of force redevelopment F rec after shortening at 0.5 FL s–1. D, The same records as in (C) after normalization. E, time course of force redevelopment F rec after shortening at 0.3 FL s–1. F, the same records as in (E) after normalization. Each trace in (B), (D) and (E) is fitted with an exponential function to determine k tr. All data points are the mean ± SEM (n = 5) and fit by single exponential.
Figure 6
Figure 6. The effect of RLC phosphorylation on ktr following the release‐ramp protocol
A, the rate of force redevelopment k tr as a function of normalized RLC phosphorylation at SL = 1.94 μm following ramp shortening at three velocities. Reduced phosphorylation is 0.69 ± 0.04, control phosphorylation is 1.13 ± 0.07 and phosphorylated is 1.45 ± 0.1. *Significant difference compared to phosphorylated, where P < 0.05. #Significant difference compared to control phosphorylation, where P < 0.05 B, the rate of force redevelopment k tr as a function of shortening velocity for three different RLC phosphorylation levels. Data are shown as the mean ± SEM (n = 5). There are no significant differences within RLC phosphorylation levels. Linear regression is used to fit k tr as a function of ramp velocity data. There are no significant differences between the slopes. C, bar graph depicting F iso for each RLC phosphorylation level after each ramp velocity. *Significance between all RLC phosphorylation levels at a specific velocity, where P < 0.05. #Significant difference compared to corresponding phosphorylation levels at 1 FL s–1, where P < 0.05.

References

    1. Abraham TP, Jones M, Kazmierczak K, Liang HY, Pinheiro AC, Wagg CS, Lopaschuk GD & Szczesna‐Cordary D (2009). Diastolic dysfunction in familial hypertrophic cardiomyopathy transgenic model mice. Cardiovasc Res 82, 84–92. - PMC - PubMed
    1. Adhikari BB, Regnier M, Rivera AJ, Kreutziger KL & Martyn DA (2004). Cardiac length dependence of force and force redevelopment kinetics with altered cross‐bridge cycling. Biophys J 87, 1784–1794. - PMC - PubMed
    1. Aoki H, Sadoshima J & Izumo S (2000). Myosin light chain kinase mediates sarcomere organization during cardiac hypertrophy in vitro. Nat Med 6, 183–188. - PubMed
    1. Araujo A & Walker JW (1994). Kinetics of tension development in skinned cardiac myocytes measured by photorelease of Ca2+ . Am J Physiol Heart Circ Physiol 267, H1643–H1653. - PubMed
    1. Barany K, Barany M, Gillis JM & Kushmerick MJ (1980). Myosin light chain phosphorylation during the contraction cycle of frog muscle. Fed Proc 39, 1547–1551. - PubMed

Publication types

Substances