

miR-21, miR-155, miR-192, and miR-375 Deregulations Related to NF-kappaB Activation in Gastroduodenal Fluid-Induced Early Preneoplastic Lesions of Laryngeal Mucosa In Vivo
- PMID: 27292022
- PMCID: PMC4909705
- DOI: 10.1016/j.neo.2016.04.007
miR-21, miR-155, miR-192, and miR-375 Deregulations Related to NF-kappaB Activation in Gastroduodenal Fluid-Induced Early Preneoplastic Lesions of Laryngeal Mucosa In Vivo
Abstract
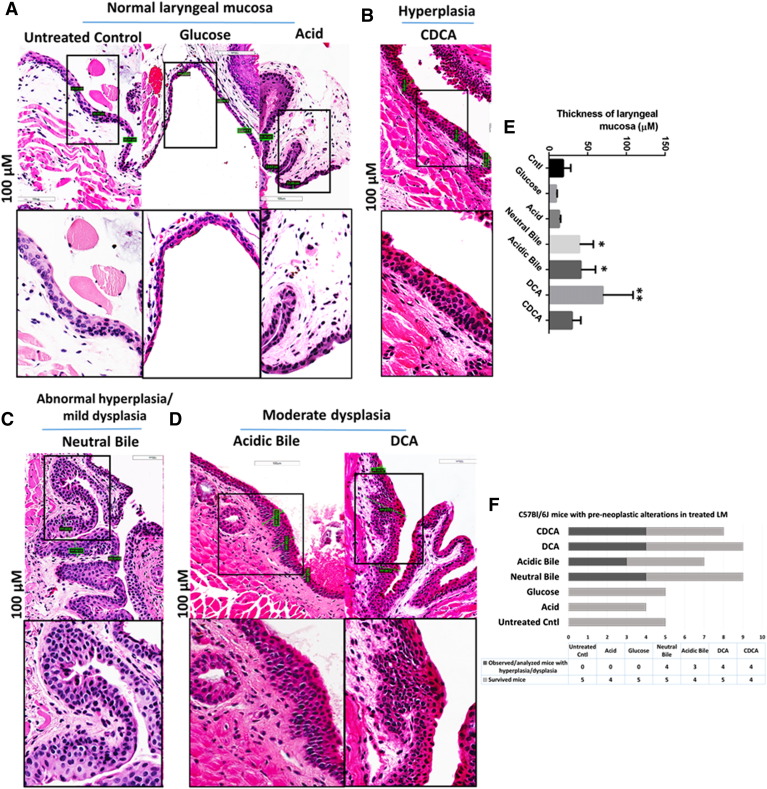
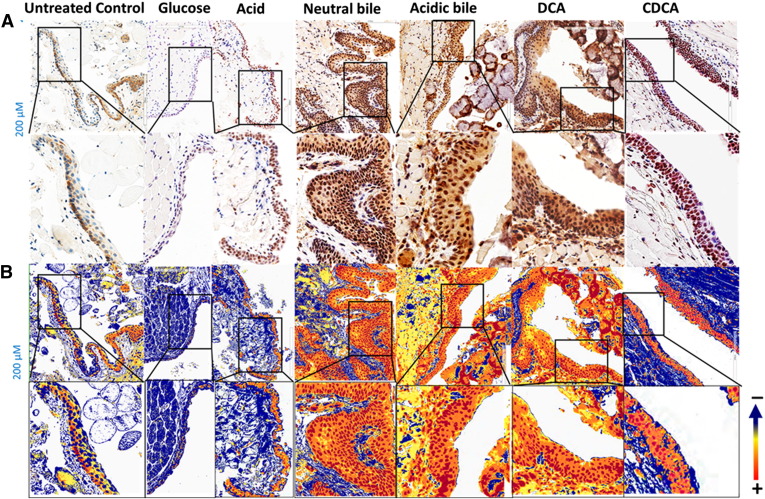
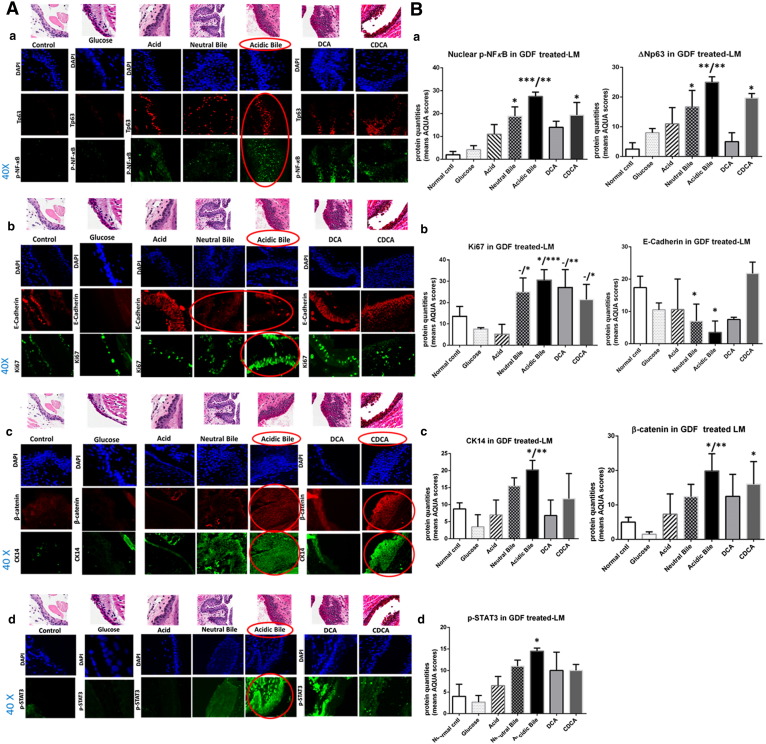
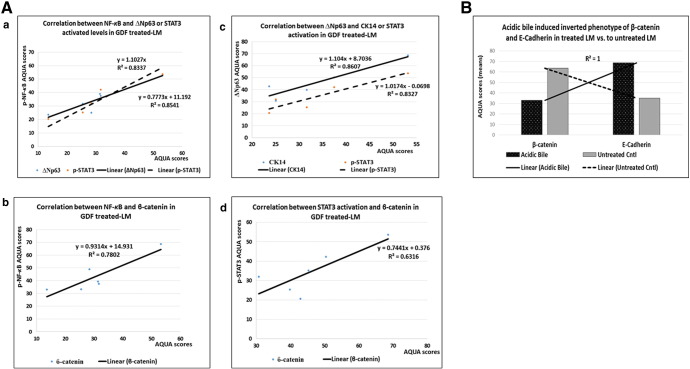
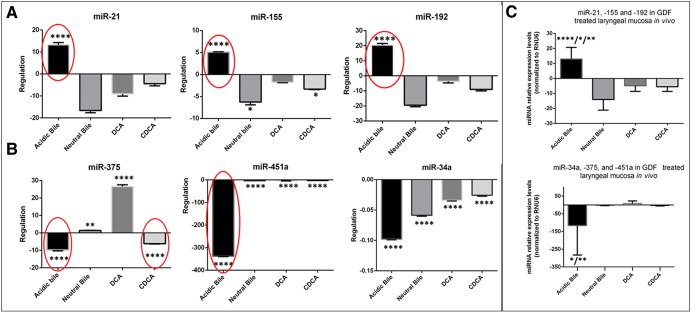
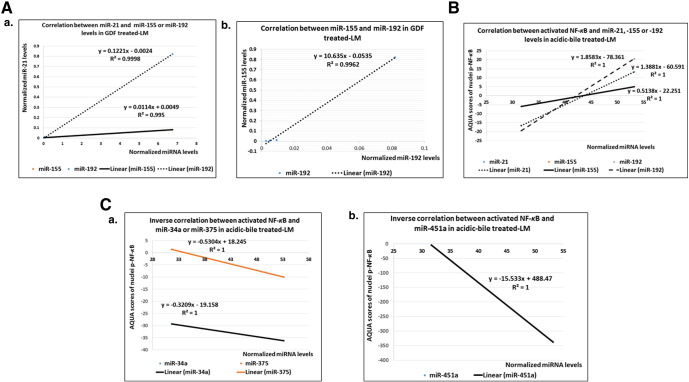
Gastroduodenal refluxate found in the upper aerodigestive tract is not clinically uncommon. We recently demonstrated the neoplastic potential of gastroduodenal fluids (GDF) on hypopharyngeal mucosa, via NF-κB, using in vitro and in vivo models. Here we will explore the in vivo effect of GDF on laryngeal mucosa (LM) to induce early preneoplastic lesions related to NF-κB activation, along with deregulation of specific microRNA (miRNA) markers previously linked to laryngeal cancer. We used histological, immunohistochemical, automated quantitative analysis and quantitative polymerase chain reaction to examine LM from 35 C57Bl/6J mice previously treated with topical GDF against corresponding controls (4 experimental and 3 control groups; 5 mice/group). Our analysis showed that GDF produced early preneoplastic lesions in treated LM related to NF-κB activation. LM treated by acid and bile combination demonstrated significantly higher expression of the analyzed cell proliferation markers (Ki67, CK14, ∆Np63), oncogenic p-STAT3, and changes of cell adhesion molecules (E-cadherin, ϐ-catenin) versus untreated LM or LM exposed to acid alone (P < .0005). Furthermore, acidic bile but not neutral bile appeared to accelerate the expression of "oncomirs" miR-21, miR-155, and miR-192 (acidic bile versus neutral bile, P < .0001), while reducing tumor suppressor miR-375 (acidic bile versus neutral bile, P = .0137), previously linked to NF-κB and laryngeal cancer. Finally, acidic bile induced reduction of miR-34a, miR-375, and miR-451a, exhibiting an inverse correlation with NF-κB activation.
Significance: Bile in combination with acid has a selective tumorigenic effect on LM, inducing deregulation of "oncomirs" and tumor suppressor miRNAs, produced by NF-κB activation with molecular and early histopathological alterations linked to neoplastic transformation. Systematic acid suppression may in part convey a protective role.
Copyright © 2016 The Authors. Published by Elsevier Inc. All rights reserved.
Figures
Similar articles
-
In Vivo Short-Term Topical Application of BAY 11-7082 Prevents the Acidic Bile-Induced mRNA and miRNA Oncogenic Phenotypes in Exposed Murine Hypopharyngeal Mucosa.Neoplasia. 2018 Apr;20(4):374-386. doi: 10.1016/j.neo.2018.02.001. Epub 2018 Mar 9. Neoplasia. 2018. PMID: 29529473 Free PMC article.
-
Gastro-duodenal fluid induced nuclear factor-κappaB activation and early pre-malignant alterations in murine hypopharyngeal mucosa.Oncotarget. 2016 Feb 2;7(5):5892-908. doi: 10.18632/oncotarget.6824. Oncotarget. 2016. PMID: 26745676 Free PMC article.
-
NF-κB inhibition reverses acidic bile-induced miR-21, miR-155, miR-192, miR-34a, miR-375 and miR-451a deregulations in human hypopharyngeal cells.J Cell Mol Med. 2018 May;22(5):2922-2934. doi: 10.1111/jcmm.13591. Epub 2018 Mar 8. J Cell Mol Med. 2018. PMID: 29516639 Free PMC article.
-
Bile reflux and hypopharyngeal cancer (Review).Oncol Rep. 2021 Nov;46(5):244. doi: 10.3892/or.2021.8195. Epub 2021 Sep 24. Oncol Rep. 2021. PMID: 34558652 Free PMC article. Review.
-
Regulation of the MIR155 host gene in physiological and pathological processes.Gene. 2013 Dec 10;532(1):1-12. doi: 10.1016/j.gene.2012.12.009. Epub 2012 Dec 14. Gene. 2013. PMID: 23246696 Review.
Cited by
-
A miRNA signature suggestive of nodal metastases from laryngeal carcinoma.Acta Otorhinolaryngol Ital. 2017 Dec;37(6):467-474. doi: 10.14639/0392-100X-851. Acta Otorhinolaryngol Ital. 2017. PMID: 29327732 Free PMC article.
-
Bile Acid Application in Cell-Targeting for Molecular Receptors in Relation to Hearing: A Comprehensive Review.Curr Drug Targets. 2024;25(3):158-170. doi: 10.2174/0113894501278292231223035733. Curr Drug Targets. 2024. PMID: 38192136 Review.
-
Weakly Acidic Bile Is a Risk Factor for Hypopharyngeal Carcinogenesis Evidenced by DNA Damage, Antiapoptotic Function, and Premalignant Dysplastic Lesions In Vivo.Cancers (Basel). 2021 Feb 18;13(4):852. doi: 10.3390/cancers13040852. Cancers (Basel). 2021. PMID: 33670587 Free PMC article.
-
SOX2 interferes with the function of CDX2 in bile acid-induced gastric intestinal metaplasia.Cancer Cell Int. 2019 Jan 31;19:24. doi: 10.1186/s12935-019-0739-8. eCollection 2019. Cancer Cell Int. 2019. PMID: 30733645 Free PMC article.
-
Targeting STAT3 prevents bile reflux-induced oncogenic molecular events linked to hypopharyngeal carcinogenesis.J Cell Mol Med. 2022 Jan;26(1):75-87. doi: 10.1111/jcmm.17011. Epub 2021 Dec 1. J Cell Mol Med. 2022. PMID: 34850540 Free PMC article.
References
-
- Sandler RS, Everhart JE, Donowitz M, Sandler RS, Everhart JE, Donowitz M, Adams E, Cronin K, Goodman C, Gemmen E. The burden of selected digestive diseases in the United States. Gastroenterology. 2002;122(5):1500–1511. - PubMed
-
- McQuaid KR, Laine L, Fennerty MB, Souza R, Spechler SJ. Systematic review: the role of bile acids in the pathogenesis of gastro-oesophageal reflux disease and related neoplasia. Aliment Pharmacol Ther. 2011;34:146–165. - PubMed
-
- Covington MF, Krupinski E, Avery RJ, Kuo PH. Classification schema of symptomatic enterogastric reflux utilizing sincalide augmentation on hepatobiliary scintigraphy. J Nucl Med Technol. 2014;42(3):198–202. - PubMed
Publication types
MeSH terms
Substances
LinkOut - more resources
Full Text Sources
Other Literature Sources
Molecular Biology Databases
Miscellaneous
