

Early Detection of Treatment-Induced Mitotic Arrest Using Temporal Diffusion Magnetic Resonance Spectroscopy
- PMID: 27292027
- PMCID: PMC4909704
- DOI: 10.1016/j.neo.2016.04.006
Early Detection of Treatment-Induced Mitotic Arrest Using Temporal Diffusion Magnetic Resonance Spectroscopy
Abstract
Purpose: A novel quantitative magnetic resonance imaging (MRI) method, namely, temporal diffusion spectroscopy (TDS), was used to detect the response of tumor cells (notably, mitotic arrest) to a specific antimitotic treatment (Nab-paclitaxel) in culture and human ovarian xenografts and evaluated as an early imaging biomarker of tumor responsiveness.
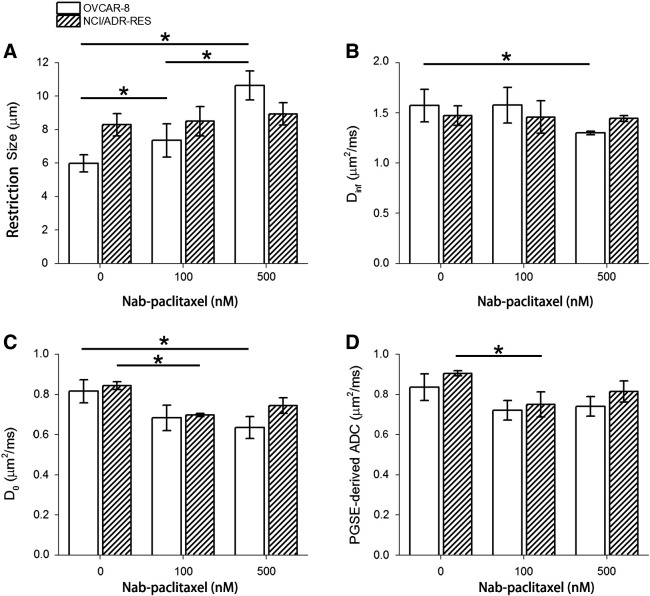
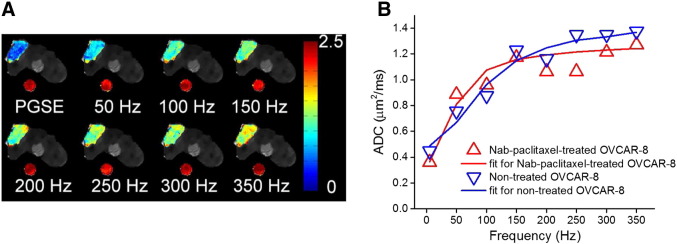
Methods: TDS measures a series of apparent diffusion coefficients (ADCs) of tissue water over a range of effective diffusion times, which may correspond to diffusion distances ranging from subcellular to cellular levels (~3-20 μm). By fitting the measured ADC data to a tissue model, parameters reflecting structural properties such as restriction size in solid tumors can be extracted. Two types of human ovarian cell lines (OVCAR-8 as a responder to Nab-paclitaxel and NCI/ADR-RES as a resistant type) were treated with either vehicle (PBS) or Nab-paclitaxel, and treatment responses of both in vitro and in vivo cases were investigated using TDS.
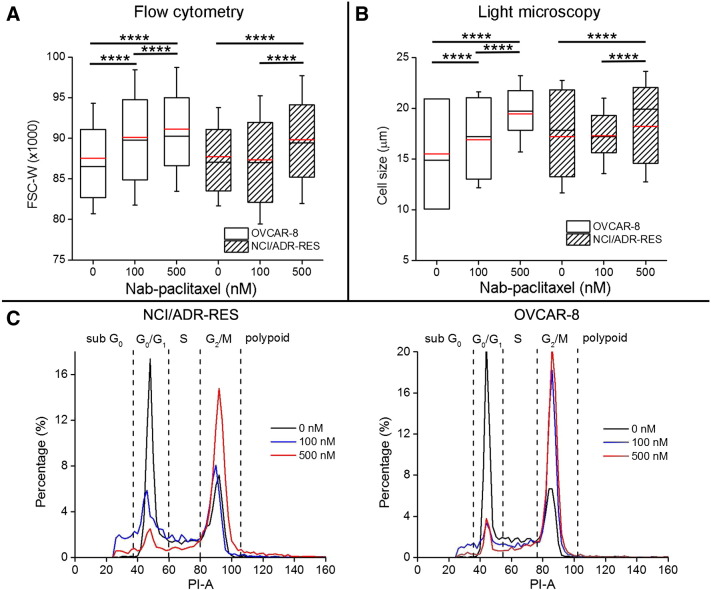
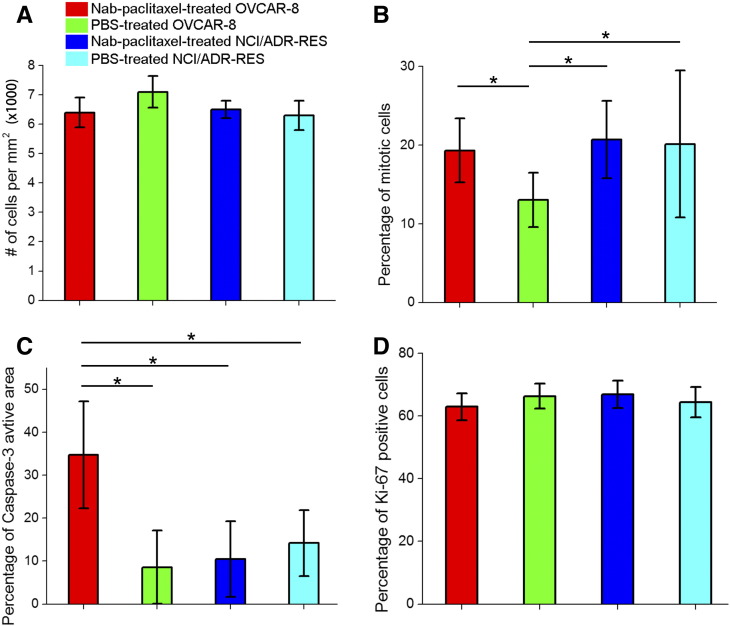
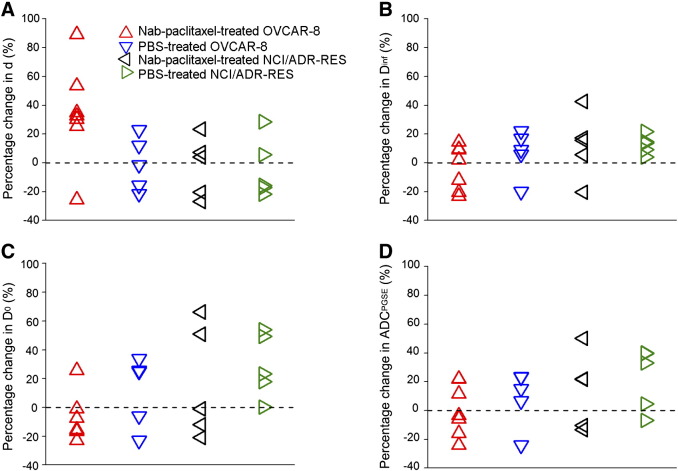
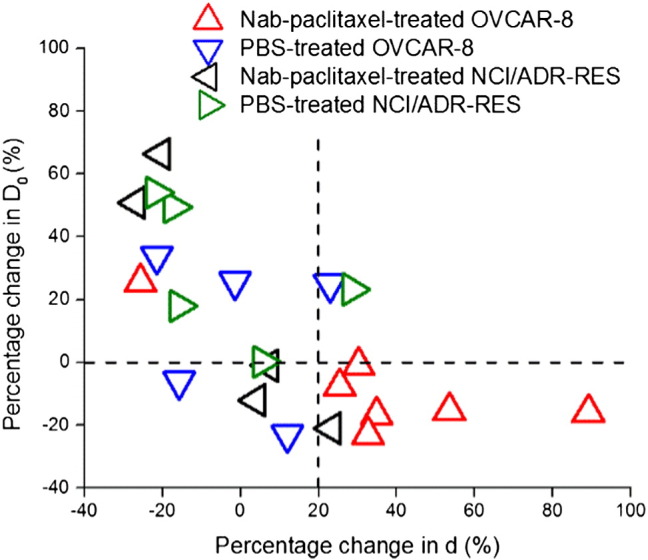
Results: Acute cell size increases induced by Nab-paclitaxel in responding tumors were confirmed by flow cytometry and light microscopy in cell culture. Nab-paclitaxel-induced mitotic arrest in treated tumors/cells was quantified histologically by measuring the mitotic index in vivo using a mitosis-specific marker (anti-phosphohistone H3). Changes in the fitted restriction size, one of the parameters obtained from TDS, were able to detect and quantify increases in tumor cell sizes. All the MR results had a high degree of consistency with other flow, microscopy, and histological data. Moreover, with an appropriate analysis, the Nab-paclitaxel-responsive tumors in vivo could be easily distinguished from all the other vehicle-treated and Nab-paclitaxel-resistant tumors.
Conclusion: TDS detects increases in cell sizes associated with antimitotic-therapy-induced mitotic arrest in solid tumors in vivo which occur before changes in tissue cellularity or conventional diffusion MRI metrics. By quantifying changes in cell size, TDS has the potential to improve the specificity of MRI methods in the evaluation of therapeutic response and enable a mechanistic understanding of therapy-induced changes in tumors.
Copyright © 2016 The Authors. Published by Elsevier Inc. All rights reserved.
Figures
References
-
- Jordan MA, Wilson L. Microtubules as a target for anticancer drugs. Nat Rev Cancer. 2004;4:253–265. - PubMed
-
- Wang TH, Wang HS, Soong YK. Paclitaxel-induced cell death: where the cell cycle and apoptosis come together. Cancer. 2000;88:2619–2628. - PubMed
-
- Green MR, Manikhas GM, Orlov S, Afanasyev B, Makhson AM, Bhar P, Hawkins MJ. Abraxane, a novel Cremophor-free, albumin-bound particle form of paclitaxel for the treatment of advanced non–small-cell lung cancer. Ann Oncol. 2006;17:1263–1268. - PubMed
-
- Duffaud F, Therasse P. New guidelines to evaluate the response to treatment in solid tumors. Bull Cancer. 2000;87:881–886. - PubMed
-
- Weber WA. Assessing tumor response to therapy. J Nucl Med. 2009;50(Suppl. 1):1S–10S. - PubMed
Publication types
MeSH terms
Substances
Grants and funding
LinkOut - more resources
Full Text Sources
Other Literature Sources
Molecular Biology Databases
Research Materials
