. 2017 Feb 1;525(2):271-290.
doi: 10.1002/cne.24059. Epub 2016 Aug 11.

Immunocytochemical organization and sour taste activation in the rostral nucleus of the solitary tract of mice

Affiliations

Immunocytochemical organization and sour taste activation in the rostral nucleus of the solitary tract of mice

Jennifer M Stratford et al. J Comp Neurol. .

Abstract

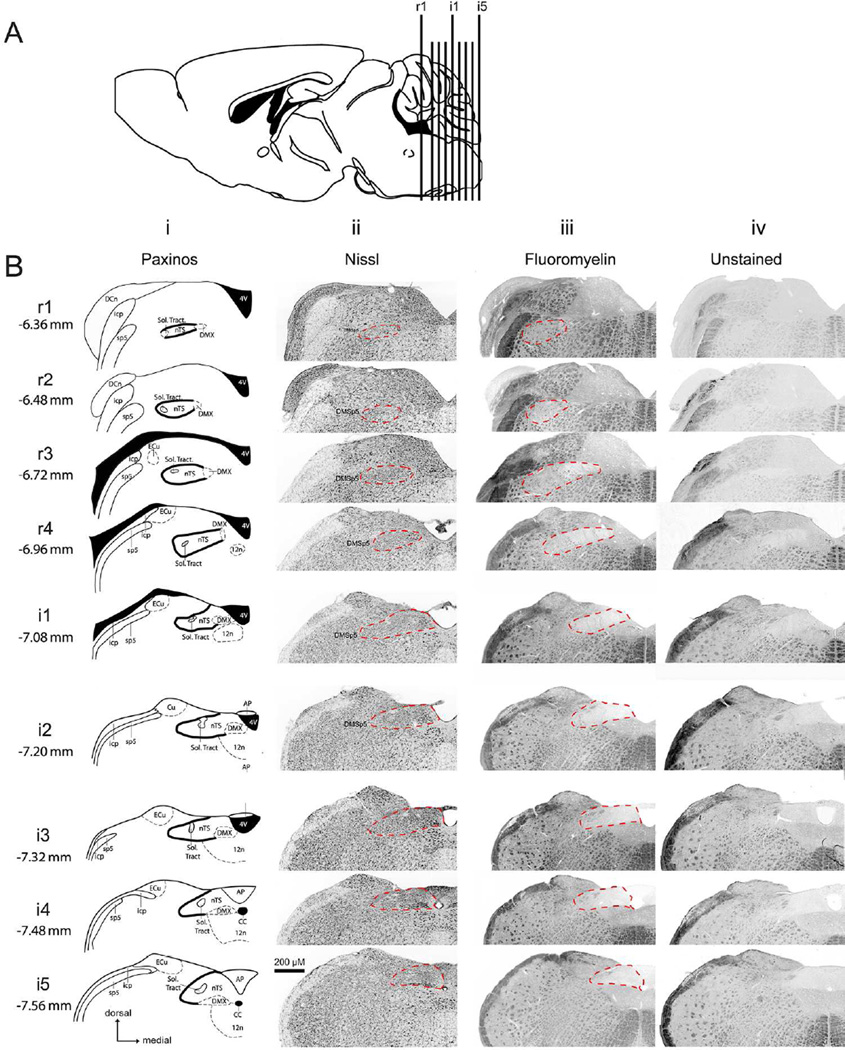
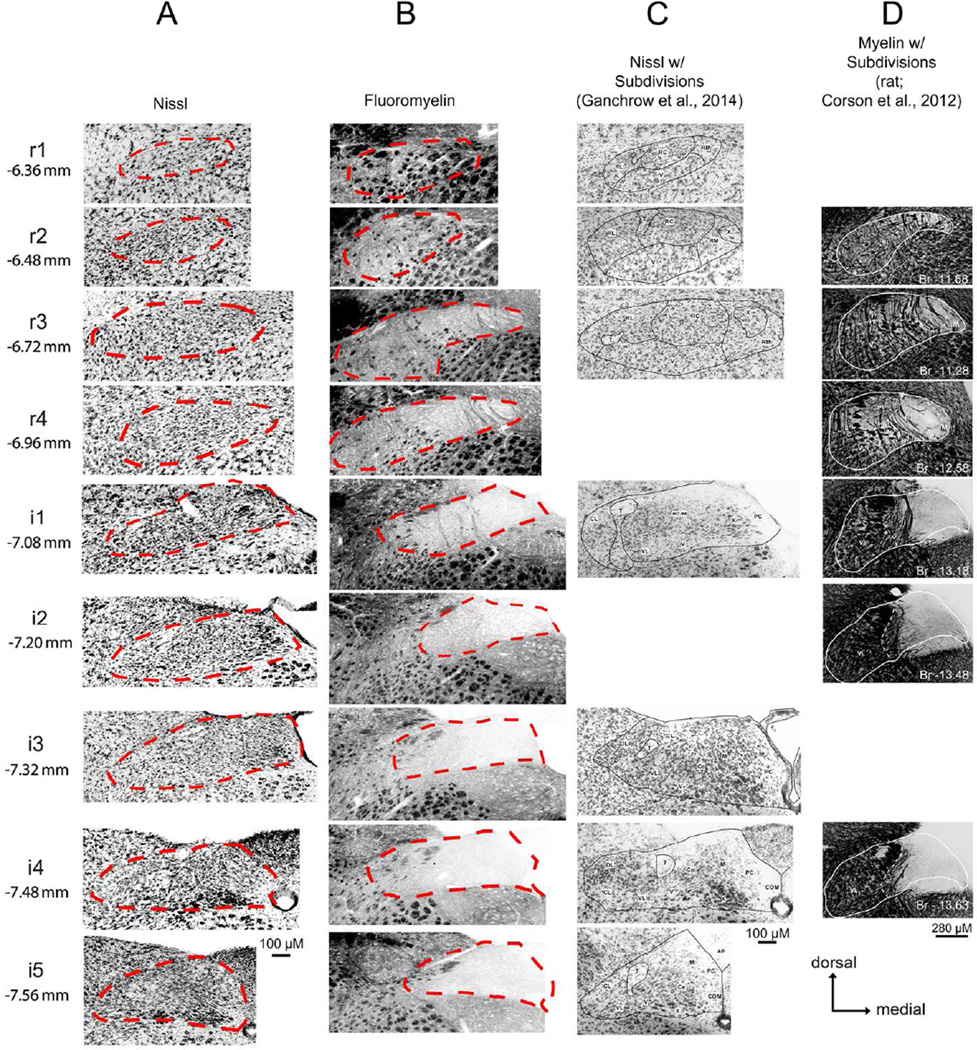
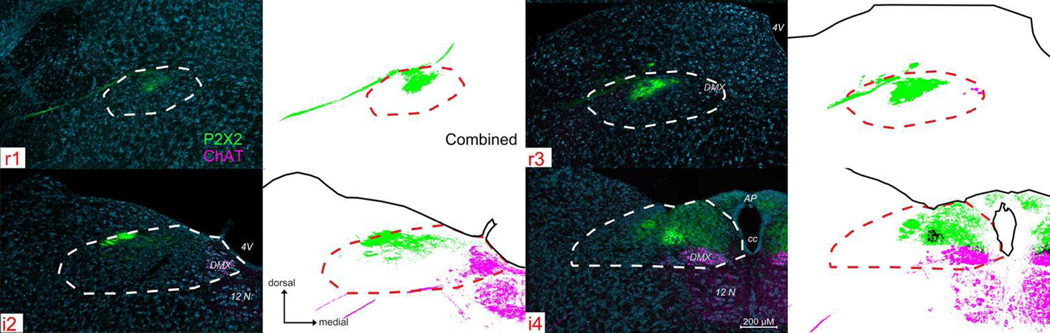
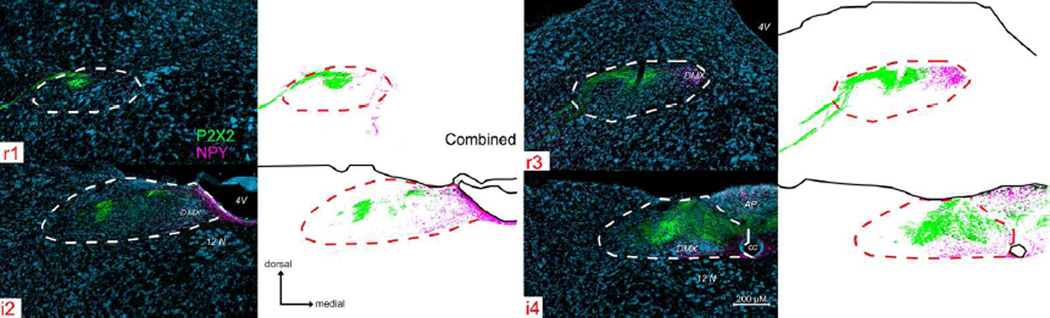
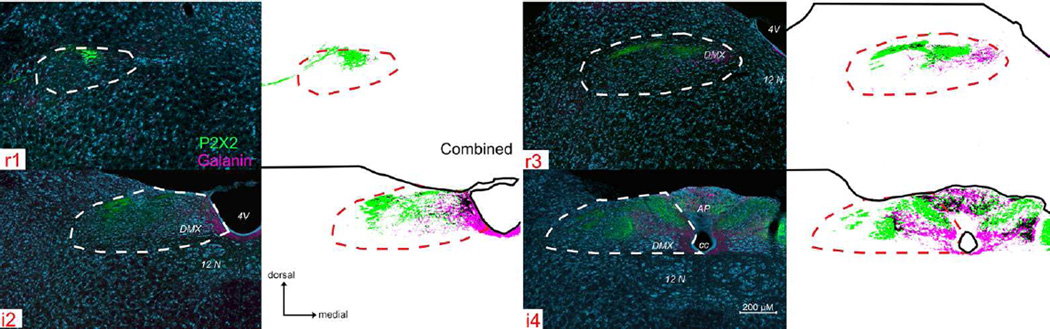
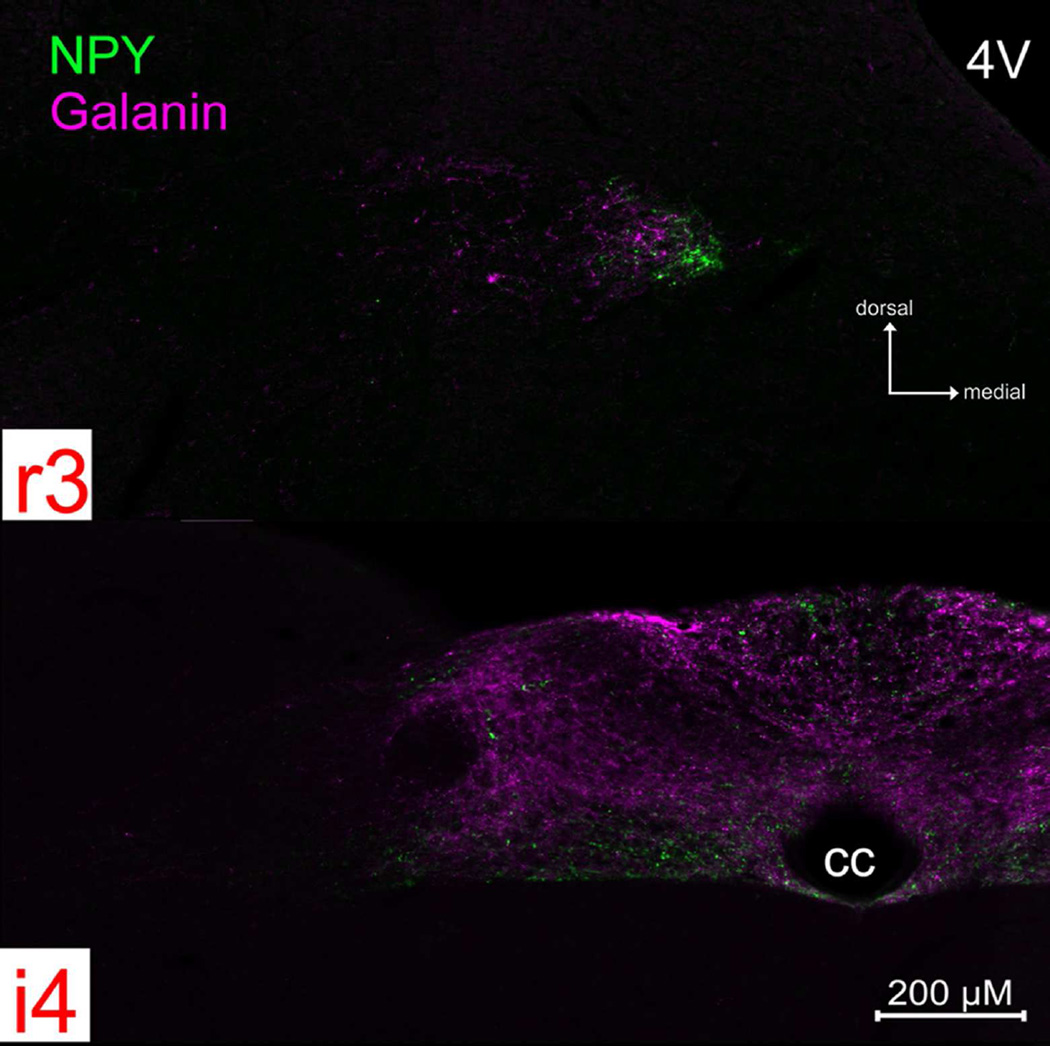
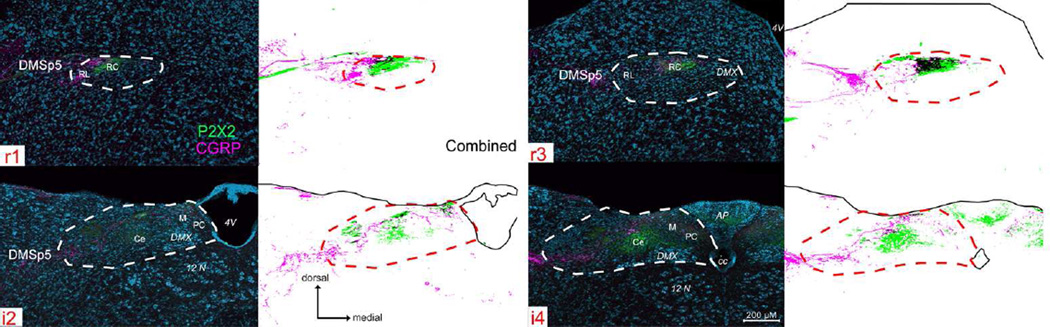
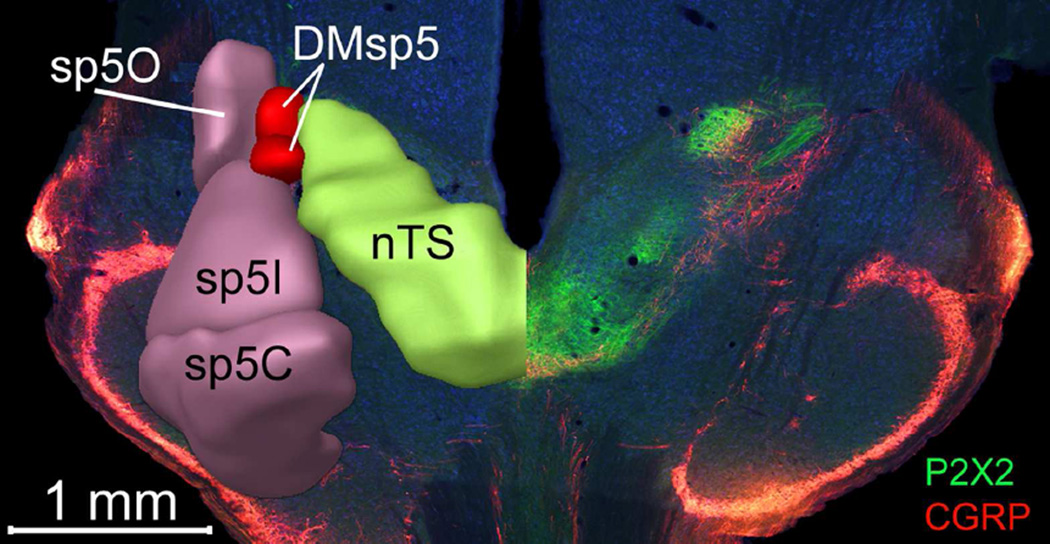
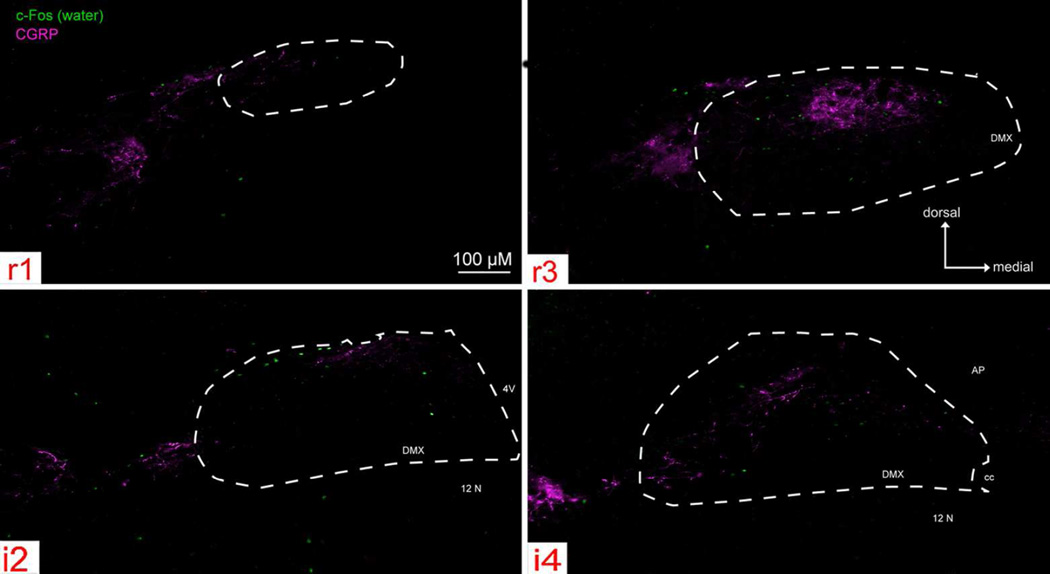
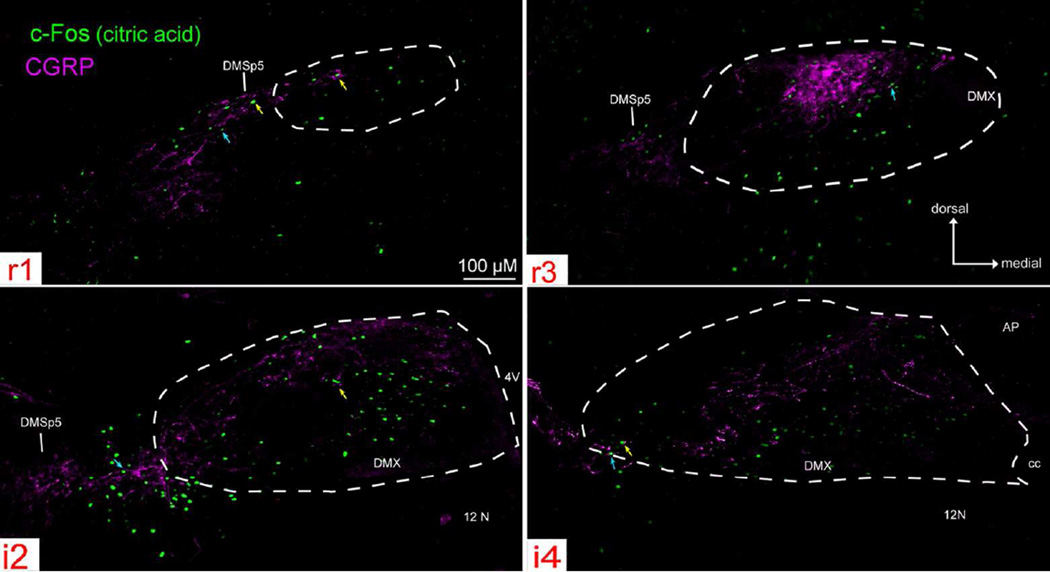
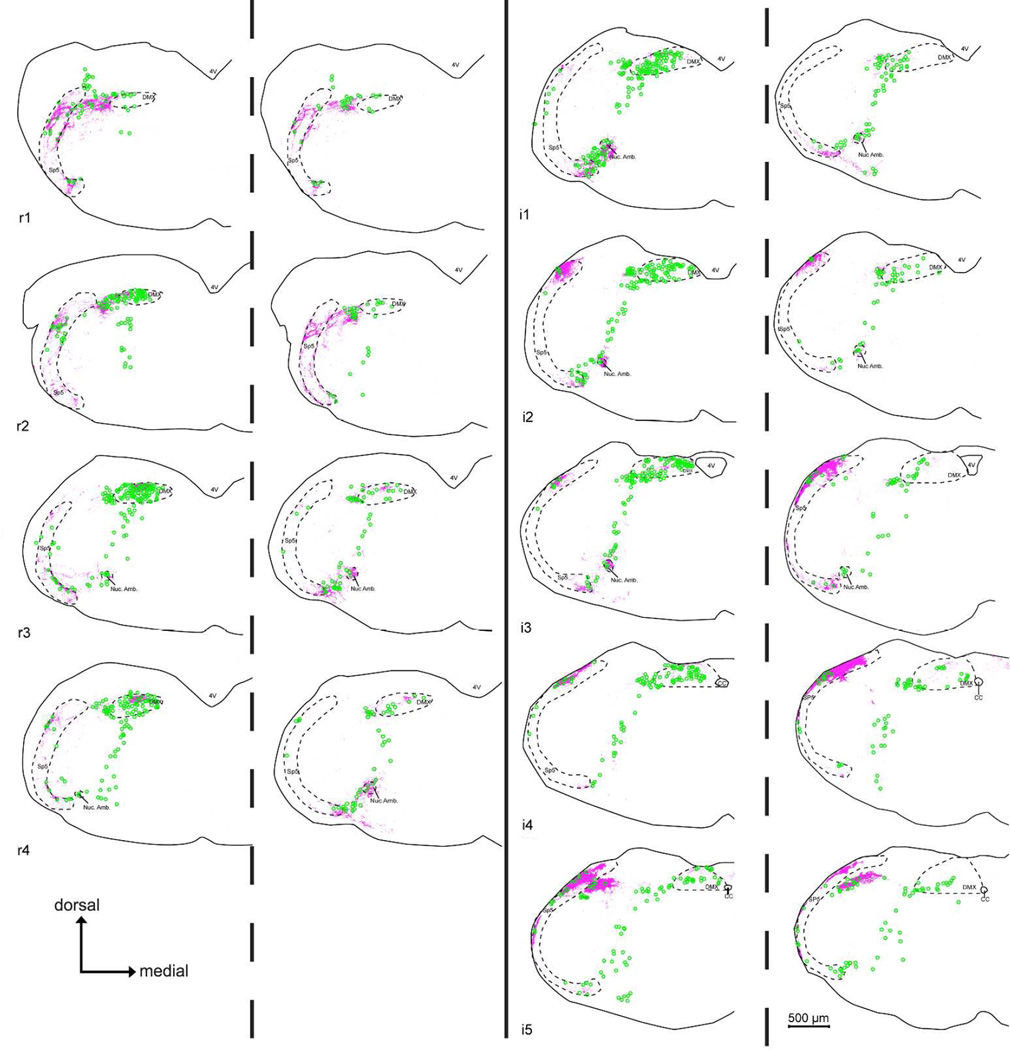
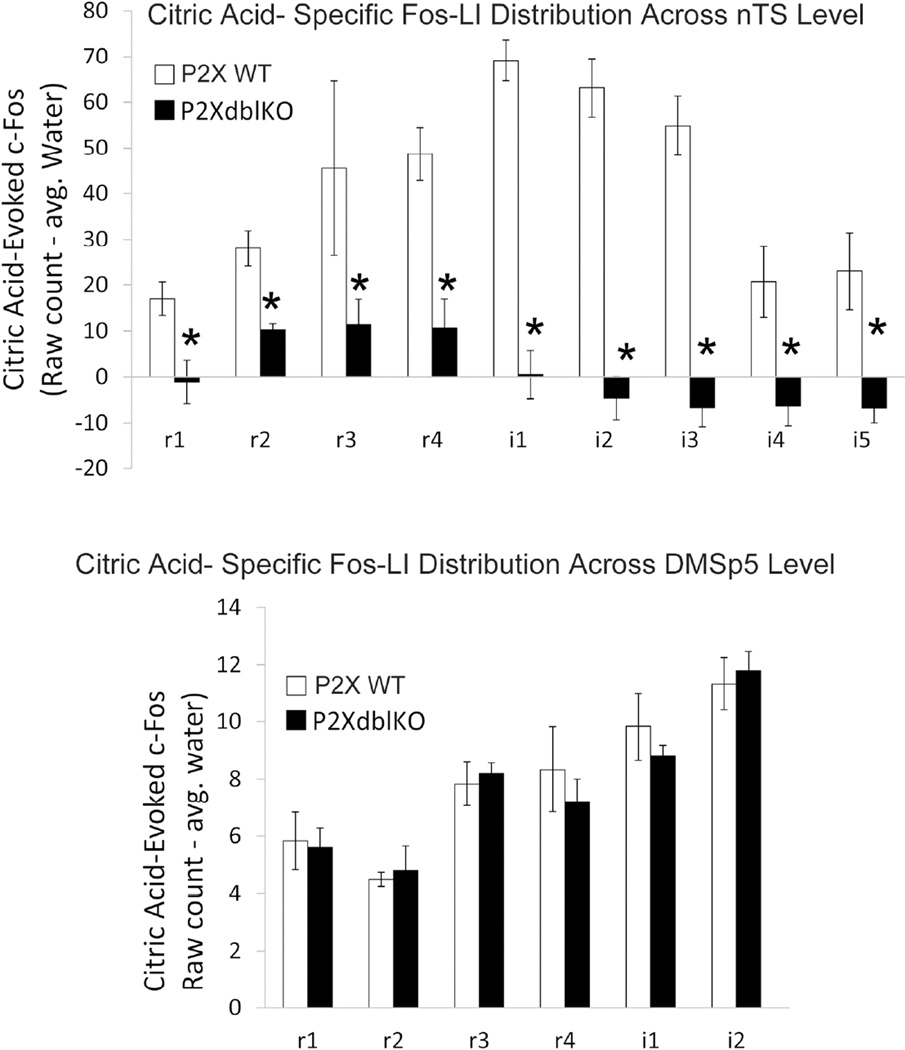
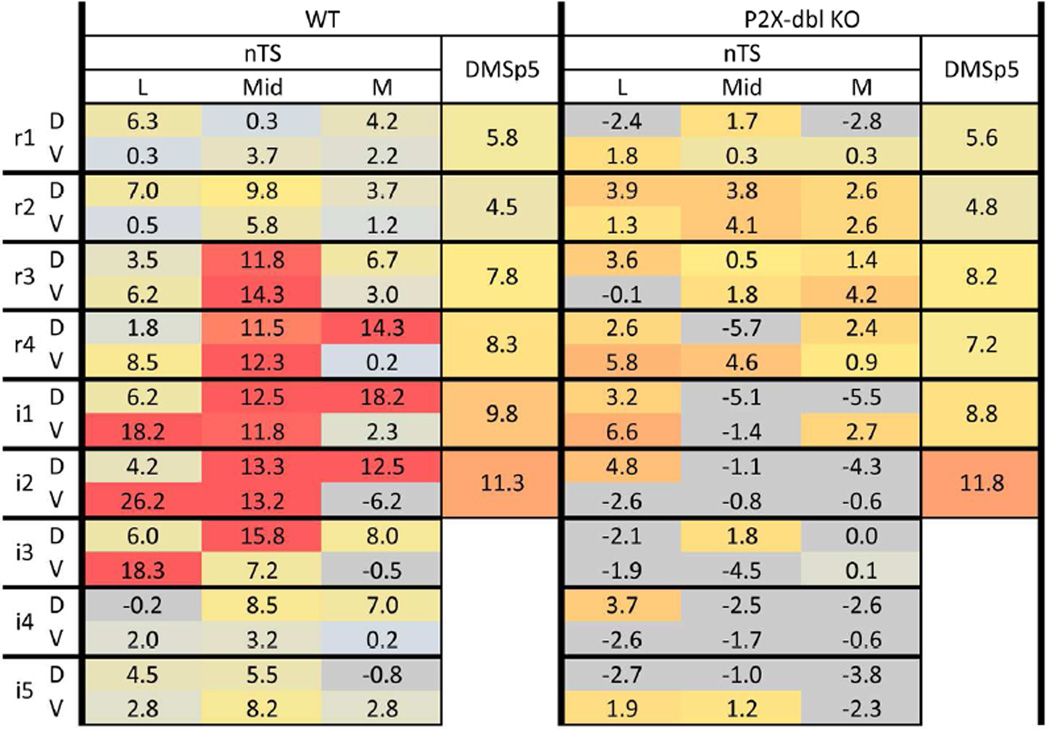
Sensory inputs from the oropharynx terminate in both the trigeminal brainstem complex and the rostral part of the nucleus of the solitary tract (nTS). Taste information is conveyed via the facial and glossopharyngeal nerves, while general mucosal innervation is carried by the trigeminal and glossopharyngeal nerves. In contrast, the caudal nTS receives general visceral information largely from the vagus nerve. Although the caudal nTS shows clear morphological and molecularly delimited subdivisions, the rostral part does not. Thus, linking taste-induced patterns of activity to morphological subdivisions in the nTS is challenging. To test whether molecularly defined features of the rostral nTS correlate with patterns of taste-induced activity, we combined immunohistochemistry for markers of various visceral afferent and efferent systems with c-Fos-based activity maps generated by stimulation with a sour tastant, 30 mM citric acid. We further dissociated taste-related activity from activity arising from acid-sensitive general mucosal innervation by comparing acid-evoked c-Fos in wild-type and "taste blind" P2X2 /P2X3 double knockout (P2X-dbl KO) mice. In wild-type mice, citric acid stimulation evoked significant c-Fos activation in the central part of the rostral nTS-activity that was largely absent in the P2X-dbl KO mice. P2X-dbl KO mice, like wild-type mice, did exhibit acid-induced c-Fos activity in the dorsomedial trigeminal brainstem nucleus situated laterally adjacent to the rostral nTS. This dorsomedial nucleus also showed substantial innervation by trigeminal nerve fibers immunoreactive for calcitonin gene-related peptide (CGRP), a marker for polymodal nociceptors, suggesting that trigeminal general mucosal innervation carries information about acids in the oral cavity. J. Comp. Neurol. 525:271-290, 2017. © 2016 Wiley Periodicals, Inc.

Keywords: CGRP; RRID: AB_2040054; RRID: AB_2314042; RRID: AB_518147; RRID: AB_518351; RRID: AB_572253; acid; c-Fos; chemesthesis; esophagus; oropharynx; trigeminal.


Figures

Figure 1
Figure 1. Rostral-caudal boundaries of nTS based on various staining methodologies
A: Nine standard transverse section planes as projected onto a parasagittal section of a mouse brain. B: Nine rostrocaudal nTS levels designated as rostral (r1 – r4) and intermediate (i1- i5). Coordinates from Bregma are listed for each nTS level. For each level the boundary of nTS is indicated to permit comparison between: Column i, the Paxinos Atlas (solid black line); Column ii, fluorescent Nissl staining (dashed red line); Column iii, FluoroMyelin staining (dotted red line); and Column iv, Unstained sections (dotted red line). The location of the dorsomedial trigeminal nucleus (DMSp5) is also indicated. Atlas images modified from 2nd edition of The Mouse Brain in Stereotaxic Coordinates (Paxinos and Franklin, 2001).
Figure 2
Figure 2. nTS Boundaries vary significantly not only between staining methodology, but also between published studies
Photomicrographs of mice (A–C) and rat (D) brainstem sections stained using various methodologies (A. fluorescent nissl; B. FluoroMyelin; C. chromogenic Nissl; D. myelin). For A and B: nTS boundaries are denoted as red dotted lines. For C: nTS boundaries, including nTS subregions are denoted as solid black lines. For D: nTS boundaries are shown as a solid white line. In C and D, images that did not correspond to one of the nine standard nTS levels described in the current study were omitted. Images in C, are reproduced from Ganchrow et al., 2014 (with permission from Wiley Periodicals, Inc. Copyright © 2013) from the following figures: r1 = Fig. 1A; r2 = Fig. 1C; r3 = Fig. 1E; i1 = Fig. 1G; i3 = Fig. 1I; i4 = Fig. 1K; i5 = Fig. 1M). In D, images are reproduced from Corson et al., 2012 (with permission from Wiley-Liss, Inc. Copyright © 2011) from the following figures: r2 = Fig. 3A; r3 = Fig. 3E; r4 = Fig. 3G; i1 = Fig. 4C; i2 = Fig. 4E; i4 = Fig. 4G. Images in D are flipped horizontally from the originals to lie in the same orientation as the other photomicrographs in this figure.
Figure 3
Figure 3. P2X2 (green) immunoreactivity and ChAT-GFP (magenta) within four representative nTS levels (r1, r1, i2, i4)
See supplemental Fig. 1 (S1) for P2X2/ChAT immunoreactivity across all nine nTS levels. For each nTS level, a pair of images is shown, Left: photographs of P2X2 (green), ChAT (magenta), and a Nissl background stain (cyan), with nTS boundaries indicated as white dotted lines; Right: computationally extracted chartings of the image for each pixel greater than 2 S.D. of background staining. r1: In rostral sections, P2X2 immunoreactive fibers (green) label the facial nerve root as it passes medially through the dorsal medulla, terminating within the dorsocentral subnucleus of the nTS (r1 & r3). At more caudal levels (i2 – i4), P2X2 immunoreactive fibers expand medially and ventrally to terminate within the medial two-thirds of the nTS. CHAT- GFP primarily labels brainstem motor nuclei and nerve roots throughout the medulla (including DMX, 12n).
Figure 4
Figure 4. P2X2 (green) and NPY (magenta) immunoreactivity across four representative nTS levels
See supplemental Fig. 2 (S2) for P2X2/NPY immunoreactivity across all nine nTS levels. In rostral nTS, NPY-immunoreactive fibers are distributed in the medial part of the nTS and within the DMX in areas that also contain ChAT-positive cells and processes. In intermediate nTS, NPY staining is densest lining the 4th ventricle (4V), but also occurs within the area postrema (AP). The nTS boundaries and organization of the figure is as described for Fig. 3.
Figure 5
Figure 5. P2X2 (green) and galanin (magenta) immunoreactivity across four representative nTS levels
See supplemental Fig 3. (S3) for P2X2/galanin immunoreactivity across all nine nTS levels. Galanin+ fibers are distributed in a roughly similar pattern to that of NPY, although the peptides do not appear to co-localize within the majority of individual fibers (See Fig. 7). The nTS boundaries and organization of the figure is as described for Fig. 3.
Figure 6
Figure 6. NPY (green) and galanin (magenta) immunoreactivity do not co-localize in fibers, although their distribution is largely coextensive
Photomicrographs of NPY and galanin staining from a rostral (r3) and intermediate (i4) nTS level.
Figure 7
Figure 7. P2X2 (green) and CGRP (magenta) immunoreactivity across four representative nTS levels (r1, r3, i2, i4)
See supplemental Fig. 4 (S4) for P2X2/CGRP immunoreactivity across all nine nTS levels. For each nTS level, a pair of images is shown, Left: photographs of P2X2 (green), CGRP (magenta), and a Nissl background stain (cyan), with nTS boundaries indicated as white dotted lines; Right: computationally extracted charting of the image for each pixel greater than 2 S.D. of background staining. Patterns of P2X2 immunoreactivity are similar to that described in Fig. 3 above. CGRP-immunoreactive fibers appear both within and immediately lateral to the RL subdivision of the nTS. However, a substantial number of CGRP+ fibers also terminate within the RC subdivision of nTS, overlapping the P2X2 terminal field. Moreover, a unique CGRP+ zone occurs laterally beyond the nominal boundaries of the nTS and occupies the DMSp5.
Figure 8
Figure 8. The dorsomedial trigeminal nucleus (DMSp5) lies between the nucleus of the solitary tract (nTS) proper and the junction of the pars oralis (Sp5O) and pars interpolaris (SP5I) of the trigeminal complex
Right: As shown in this photomicrograph of a horizontal section through the brainstemP2X2-immunoreactive fibers (green), mostly originating from the facial and glossopharyngeal nerves, course caudomedially to terminate throughout the nTS. Fibers immunoreactive for CGRP (red) terminate within portions of the rostral and intermediate nTS as well as in components of the brainstem trigeminal complex including DMSp5. Left: Digital reconstruction of the trigeminal complex and nTS modified from the Allen Brain Institute ‘Brain Explorer2’ tool (Lein et al., 2007; http://mouse.brain-map.org/).
Figure 9
Figure 9. Water- evoked c-Fos-like Immunoreactivity (Fos-LI) within the brainstem of ‘Control’ (P2X WT) mice across four representative nTS levels (r1, r3, i2, i4)
Photomicrographs of water-evoked c-Fos (green) and CGRP (magenta) staining, with nTS boundaries indicated as white dotted lines. Water stimulation evoked few c-Fos positive cells both within and outside the nTS, and Fos-LI was widely distributed throughout the brainstem.
Figure 10
Figure 10. Citric acid- evoked c-Fos-like Immunoreactivity (Fos-LI) within the brainstem of ‘Control’ (P2X WT) mice across four representative nTS levels (r1, r3, i2, i4)
Photographs of citric acid-evoked c-Fos (green) and CGRP (magenta) staining, with nTS boundaries indicated as white dotted lines. Citric acid-evoked c-Fos positive cells lie primarily in areas that contain CGRP immunoreactive fibers (blue arrows) or terminals (yellow arrows).
Figure 11
Figure 11. Comparison chartings of citric acid-evoked c-Fos-like Immunoreactivity (Fos-LI) within the brainstem of ‘Control’ (P2X WT) (Left side of each pair) and ‘Taste Blind’ (P2X-dbl KO) (Right side of each charting pair) mice
Across all nTS levels, Fos-LI (green circles) is significantly reduced in the nTS of P2X-dbl KO mice compared to WT. In contrast, in non-nTS areas displaying high levels of CGRP-immunoreactivity (magenta fibers), including the dorsomedial trigeminal nucleus (DMSp5), spinal trigeminal tract (SP5), and the nucleus Ambiguus (Nuc. Amb.), Fos-LI density is similar between P2X WT and P2X-dblKO mice.
Figure 12
Figure 12. Quantitative comparison of citric acid-evoked Fos-LI (raw count – avg. water) within the brainstem of P2X WT and P2X-dblKO mice across the different levels of the nTS and in the DMSp5
A. The number of Fos-LI neurons is significantly reduced across all nTS levels in the nTS of P2X-dbl KO mice, (* = Post hoc Tukey’s HSD results from main Group×nTS level ANOVA interaction is p < 0.05). Note also the paucity of Fos-LI in P2X-dblKO mice in more caudal portions of the nTS (i4, i5) wherein esophageal afferents terminate. B. In contrast, Fos-LI is similar between P2X WT and P2X-dbl KO mice in the dorsomedial trigeminal nucleus (DMSp5).
Figure 13
Figure 13. Spatial pattern ‘heat maps’ comparison of counts of citric acid- specific Fos-LI neurons within the brainstem of P2X WT and P2X-dblKO mice
Left: citric acid- specific (raw count – avg. water) Fos-LI for P2X WT mice. Right: citric acid- specific (raw count – avg. water) Fos-LI for P2X-dblKO mice. Each 3×2 box within each major column represents one level of the nTS subdivided into the component subfields: lateral (L), Mid, medial (M) in dorsal (D) & ventral (V) tiers. Each heat map is color coded so that blue = minimal; red = maximal (> 15). For clarity, negative numbers (i.e. where citric acid Fos-LI was less than water-evoked Fos-LI) are shown as grey. All numbers represent the average value (n= 5 for P2X WT; n = 6 for P2X-dblKO) for each anatomical area (nTS subregion or DMSp5 region). In P2X WT animals, maximal activity in the Mid nTS levels r3 – i3 corresponds approximately to the RC subnucleus described by Ganchrow et al., 2014. In P2X-dbl KO mice, citric acid-specific Fos-LI was substantially reduced in nearly all nTS areas, except the RL division, which receives a substantial trigeminal CGRP input. Similarly, no reduction in Fos-LI occurred in the DMSp5 which also receives trigeminal CGRP inputs.

Similar articles

Cited by

References

    1. Altschuler SM, Bao XM, Bieger D, Hopkins DA, Miselis RR. Viscerotopic representation of the upper alimentary tract in the rat: sensory ganglia and nuclei of the solitary and spinal trigeminal tracts. J Comp Neurol. 1989;283(2):248–268. - PubMed
    1. Archer S, Li TT, Evans AT, Britland ST, Morgan H. Cell reactions to dielectrophoretic manipulation. Biochem Biophys Res Commun. 1999;257(3):687–698. - PubMed
    1. Astrom KE. On the central course of afferent fibers in the trigeminal, facial, glossopharyngeal, and vagal nerves and their nuclei in the mouse. Acta physiol. scand., Suppl. 1953;29:209–320.
    1. Bae YC, Oh JM, Hwang SJ, Shigenaga Y, Valtschanoff JG. Expression of vanilloid receptor TRPV1 in the rat trigeminal sensory nuclei. J Comp Neurol. 2004;478(1):62–71. - PubMed
    1. Bartel DL. Glial responses after chorda tympani nerve injury. J Comp Neurol. 2012;520(12):2712–2729. - PMC - PubMed

Publication types