. 2016 Jun 21;15(12):2719-32.
doi: 10.1016/j.celrep.2016.05.058. Epub 2016 Jun 9.

CD40 Stimulation Obviates Innate Sensors and Drives T Cell Immunity in Cancer

Affiliations

CD40 Stimulation Obviates Innate Sensors and Drives T Cell Immunity in Cancer

Katelyn T Byrne et al. Cell Rep. .

Abstract

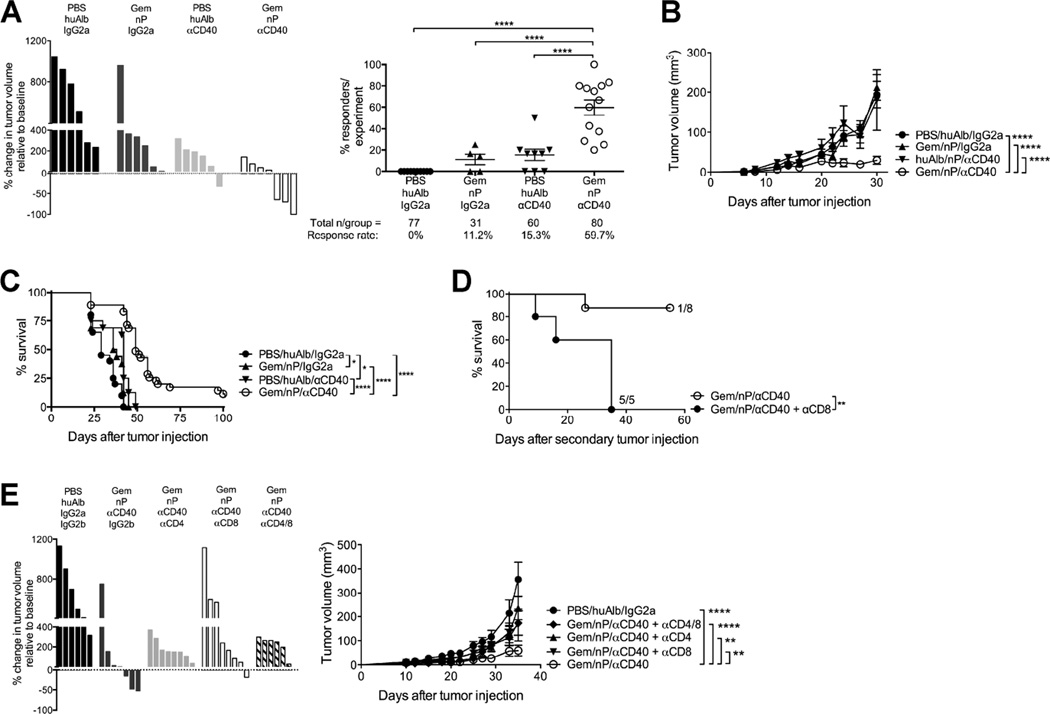
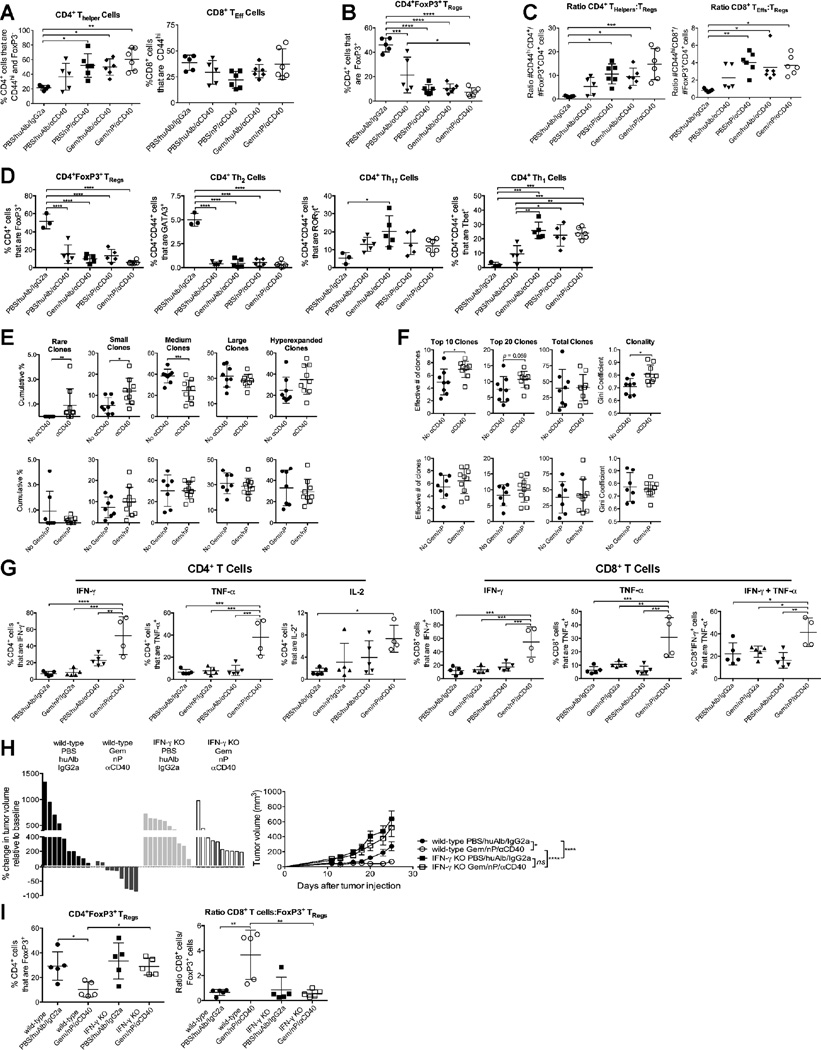
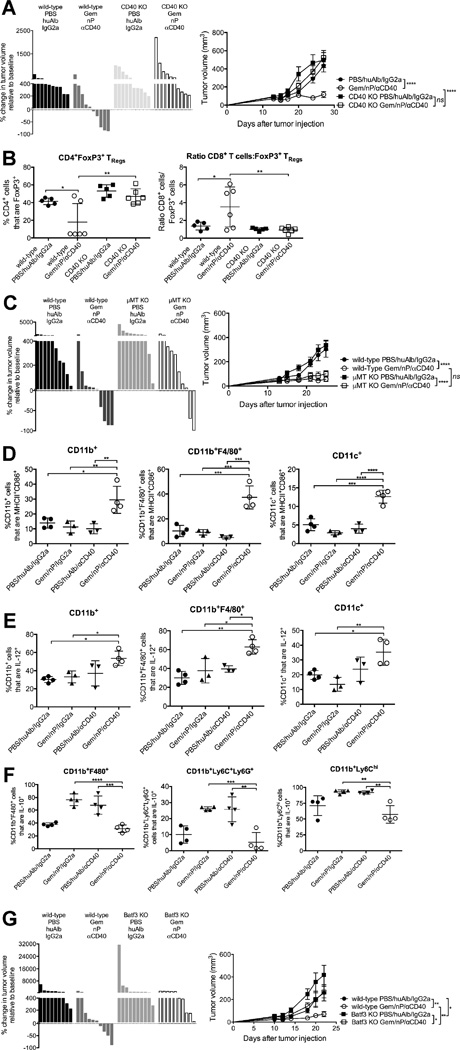
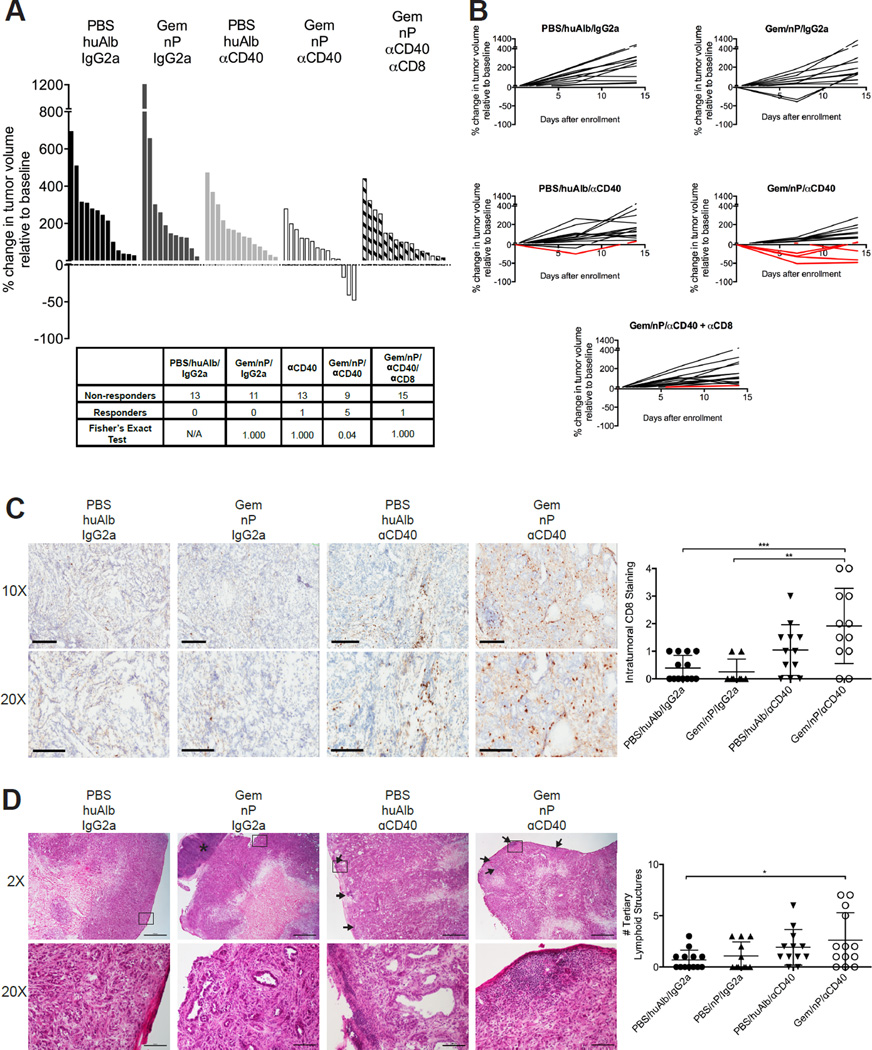
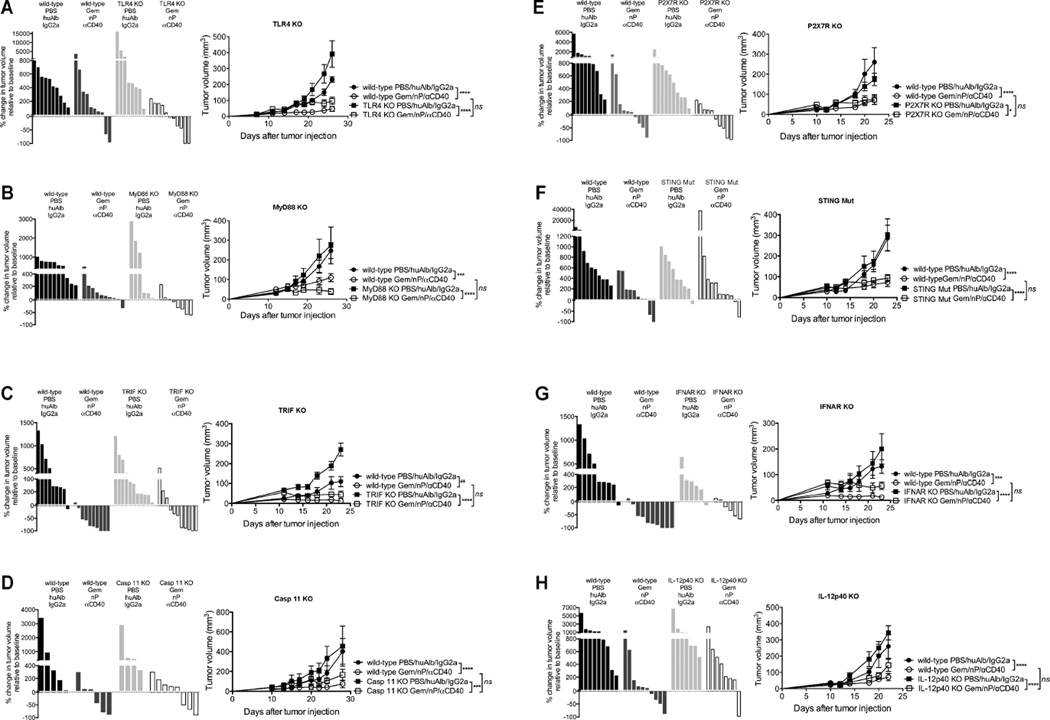
Cancer immunotherapies are more effective in tumors with robust T cell infiltrates, but mechanisms to convert T cell-devoid tumors with active immunosuppression to those capable of recruiting T cells remain incompletely understood. Here, using genetically engineered mouse models of pancreatic ductal adenocarcinoma (PDA), we demonstrate that a single dose of agonistic CD40 antibody with chemotherapy rendered PDA susceptible to T cell-dependent destruction and potentiated durable remissions. CD40 stimulation caused a clonal expansion of T cells in the tumor, but the addition of chemotherapy optimized myeloid activation and T cell function. Although recent data highlight the requirement for innate sensors in cancer immunity, these canonical pathways-including TLRs, inflammasome, and type I interferon/STING-played no role in mediating the efficacy of CD40 and chemotherapy. Thus, CD40 functions as a non-redundant mechanism to convert the tumor microenvironment immunologically. Our data provide a rationale for a newly initiated clinical trial of CD40 and chemotherapy in PDA.


Figures

Figure 1
Figure 1. Gem/nP/αCD40 drives T cell-dependent regressions of PDA
Mice were injected with PDA 4662 cells subcutaneously and after 12 days of growth, tumors were treated with Gem/nP followed by αCD40 2 days later. (A) Left, change in tumor volume on day 24 compared to start of treatment (day 12), representative of 7 independent experiments. Right, the total proportion of regressors/experiment, from 13 individual experiments, total number of mice/group shown below. (B) Tumor growth kinetics for mice from (A). (C) Survival curve for mice treated as described in (A), from 2 combined experiments. (D) Survival after second tumor injection >60 days after primary tumor injection. Some mice received αCD8, representative of 2 independent experiments. (E) Mice were treated as described in (A), and with αCD4 and/or αCD8. Left, change in tumor growth compared to baseline, right, tumor growth kinetics. Data are representative of 3 independent experiments. Each experiment had 4–10 mice/group, each bar represents a single mouse and each symbol represents a group, horizontal line and error bars indicate mean ± SEM. Statistical analyses by one-way ANOVA (A), two-way ANOVA with Tukey’s HSD post-test (B, E), or Log-rank test (C, D). See also Figure S1, S2.
Figure 2
Figure 2. Gem/nP/αCD40 therapy alters T cell subsets, repertoire, and function in PDA tumors in an IFN-γ dependent manner
(A–D) Mice were treated as described in Figure 1A, and tumors were harvested 24 days (A–C) or 19 days (D) after tumor injection (12 and 7 days after initiation of treatment, respectively) and analyzed by flow cytometry with regard to the proportion (A, B, D) of the indicated subsets or the ratios of the absolute number of cells/gram of tumor (C) among live, CD45+ CD3+ cells. (E–F) Tumors were harvested on day 24 and analyzed by TCR deep sequencing. Mice are grouped based on receiving CD40 (top) or Gem/nP (bottom), and the cumulative frequencies of Rare (representing <10−5 total clones), Small (10−5 to <10-4), Medium (10−4 to <10−3), Large (10−3 to <10−2), or Hyperexpanded (10−2 to 1) clones within the total repertoire are indicated (E), or the repertoire diversity (‘true diversity,’ indicating effective number of clones) for the top 10, top 20, or entire population (far left to middle right), or the Gini Coefficient (0 indicating polyclonal, 1 indicating monoclonal) on far right (F). (G) Tumors were harvested at day 24 and analyzed by flow cytometry with regard to the indicated parameters among CD4+ (left) or CD8+ (right) live, CD45+ CD3+ cells. (H, I) IFN-γ KO mice were treated as described in Figure 1A. (H) Change in tumor volume on day 12 (left) with growth kinetics (right). (I) Tumors were analyzed on day 24 by flow cytometry with regard to the indicated subsets or ratios among live, CD45+ CD3+ cells. Each symbol represents an individual mouse, horizontal lines indicate mean ± SD (A–G, I) except for (H) where each bar represents a single mouse and each symbol represents a group with mean ± SEM. Data representative of 3–5 independent experiments with 4–6 mice/group, except TCR deep sequencing data, 1 experiment with 8–9 mice/group. Statistical analysis was performed by one-way ANOVA (A–D, G, I), Mann-Whitney T test (E, F) or two-way ANOVA (H) with Tukey’s HSD post-test. See also Figure S3.
Figure 3
Figure 3. Gem/nP/αCD40 therapy requires host CD40, activates antigen-presenting cells and requires Batf3+ dendritic cells for efficacy
Mice were treated as described in Figure 1A. (A, B) CD40 KO mice. (A) Left, change in tumor volume on day 24 versus day 12 (start of therapy). Right, tumor growth kinetics. (B) Tumors were analyzed on day 24 with regard to the proportions of indicated cells and ratios among live, CD45+ CD3+ cells. (C) µMT KO mice. Left, change in tumor volume on day 24 compared to day 12. Right, tumor growth kinetics. (D–F) Mice were treated as described in Figure 1A, and tumors were harvested on day 15 (24 hours after receiving CD40) and analyzed by flow cytometry with regards to the proportions of indicated subsets among live, CD45+ CD3 cells. CD11c+ cells are also CD11b F4/80. (G) Batf3 KO mice treated as in Figure 1A. Left, the change in tumor volume on day 24 versus day 12, right, tumor growth kinetics. Each bar represents an individual mouse, symbols indicate groups, and horizontal lines indicate mean ± SD (A, C, G) or each symbol represents an individual mouse, with mean ± SEM (B, D–F), data representative of 2–5 independent experiments with 3–10 mice/group. Statistical analysis by one-way ANOVA (A–C) or two-way ANOVA (D) with Tukey’s HSD post-test. See also Figure S4 and Table S1.
Figure 4
Figure 4. Spontaneous tumors in KPC mice respond to Gem/nP/αCD40 therapy in T cell-dependent fashion
KPC mice diagnosed with established tumors received Gem/nP on day 0 and day 7, and αCD40 was given on day 2. Some mice (as indicated) also received αCD8 depletion for the duration of enrollment. (A) The change in tumor volume on day 14 compared to initial tumor volume at diagnosis, responders calculated in table below. (B) Tumor growth curves for indicated groups, responders indicated in red. (C) Representative histological samples from (A) at day 14, stained for CD8, shown on left at two magnifications, quantification of global CD8 staining in tumors on right. Scale bar indicates 200 µm (top) or 300 µm (bottom). (D) Representative H&E samples of tumors from (A) at day 14 shown on left, quantification of tertiary lymphoid structures (TLS) in entire tumor section on right. Top, 2×, Arrowheads point to TLS, asterisk indicated tumor-associated lymph node, and outline indicates field below (20×). Scale bar indicates 1000 µm (top) or 100 µm (bottom). Each bar, line, or symbol represents an individual mouse, horizontal lines indicate mean ± SD. Statistical analysis by one-way ANOVA with Tukey’s HSD post-test (C, D), and Fisher’s Exact Test (A).
Figure 5
Figure 5. Gem/nP/αCD40 therapy bypasses innate immune sensors for treatment efficacy
Mice were treated as outlined in Figure 1A, and for each panel: Left, change in tumor volume on day 24 compared to day 12 (start of therapy), right, tumor growth kinetics. (A) TLR4 KO (B) MyD88 KO (C) TRIF KO (D) Casp 11 KO (E) P2X7R KO (F) STING Mut (G) IFNAR KO and (H) IL-12p40 KO. Each bar represents a single mouse, each symbol represents a group with error bars indicating mean ± SEM, data shown representative of 2–5 independent experiments for each KO strain with 4–10 mice per group. Statistical analysis was by two-way ANOVA with Tukey’s HSD post-test.

References

    1. Ahonen CL, Doxsee CL, McGurran SM, Riter TR, Wade WF, Barth RJ, Vasilakos JP, Noelle RJ, Kedl RM. Combined TLR and CD40 triggering induces potent CD8+ T cell expansion with variable dependence on type I IFN. J. Exp. Med. 2004;199:775–784. - PMC - PubMed
    1. Ahonen CL, Wasiuk A, Fuse S, Turk MJ, Ernstoff MS, Suriawinata AA, Gorham JD, Kedl RM, Usherwood EJ, Noelle RJ. Enhanced efficacy and reduced toxicity of multifactorial adjuvants compared with unitary adjuvants as cancer vaccines. Blood. 2008;111:3116–3125. - PMC - PubMed
    1. Alexandrov LB, Nik-Zainal S, Wedge DC, Aparicio SA, Behjati S, Biankin AV, Bignell GR, Bolli N, Borg A, Borresen-Dale AL, et al. Signatures of mutational processes in human cancer. Nature. 2013;500:415–421. - PMC - PubMed
    1. Alvarez R, Musteanu M, Garcia-Garcia E, Lopez-Casas PP, Megias D, Guerra C, Munoz M, Quijano Y, Cubillo A, Rodriguez-Pascual J, et al. Stromal disrupting effects of nab-paclitaxel in pancreatic cancer. Br. J. Cancer. 2013;109:926–933. - PMC - PubMed
    1. Apetoh L, Ghiringhelli F, Tesniere A, Obeid M, Ortiz C, Criollo A, Mignot G, Maiuri MC, Ullrich E, Saulnier P, et al. Toll-like receptor 4-dependent contribution of the immune system to anticancer chemotherapy and radiotherapy. Nat. Med. 2007;13:1050–1059. - PubMed

MeSH terms