. 2016 Jun 21;15(12):2679-91.
doi: 10.1016/j.celrep.2016.05.048. Epub 2016 Jun 9.

Negative Selection and Chromosome Instability Induced by Mad2 Overexpression Delay Breast Cancer but Facilitate Oncogene-Independent Outgrowth

Affiliations

Negative Selection and Chromosome Instability Induced by Mad2 Overexpression Delay Breast Cancer but Facilitate Oncogene-Independent Outgrowth

Konstantina Rowald et al. Cell Rep. .

Abstract

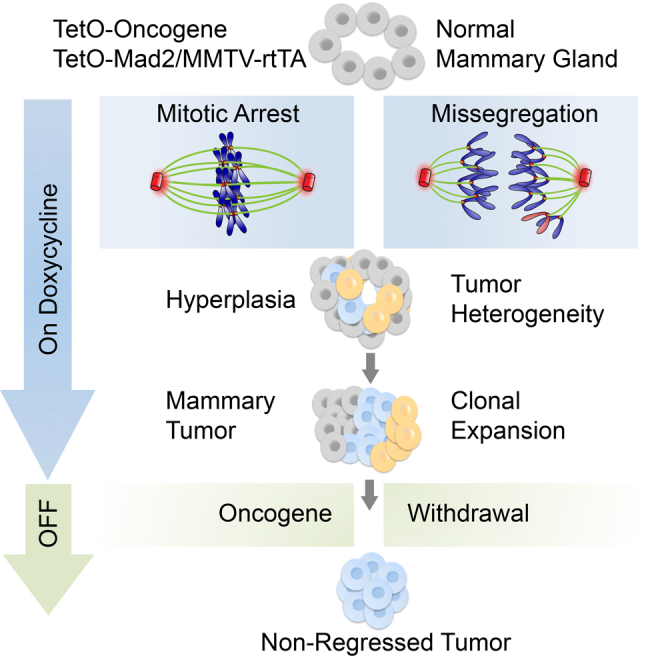
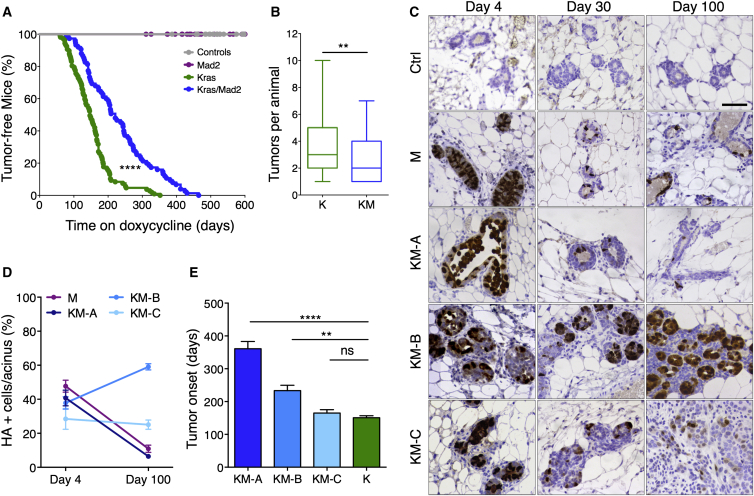
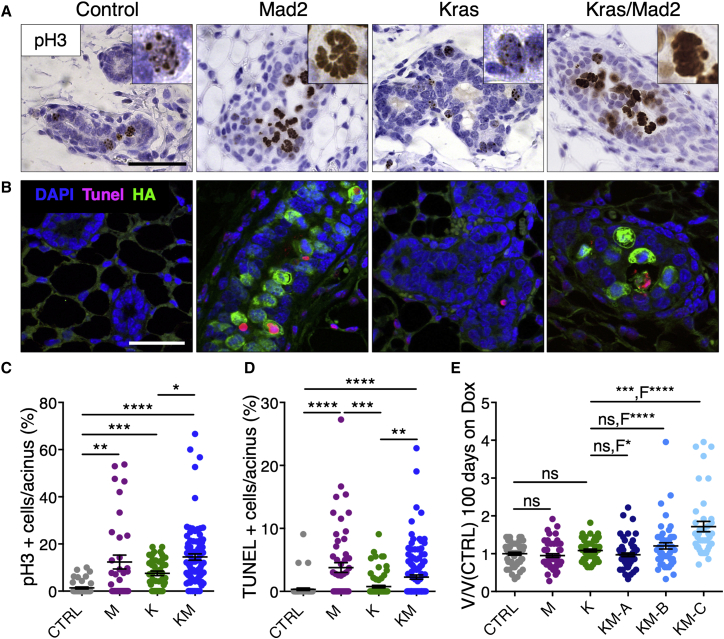
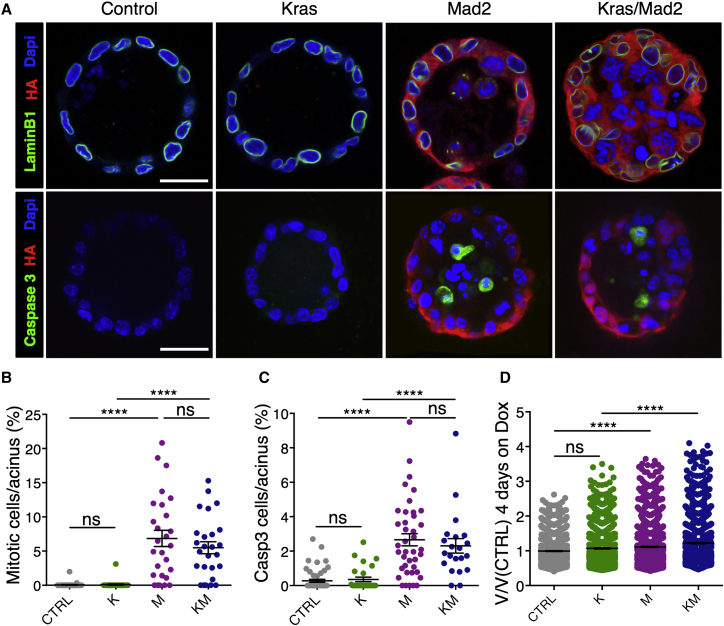
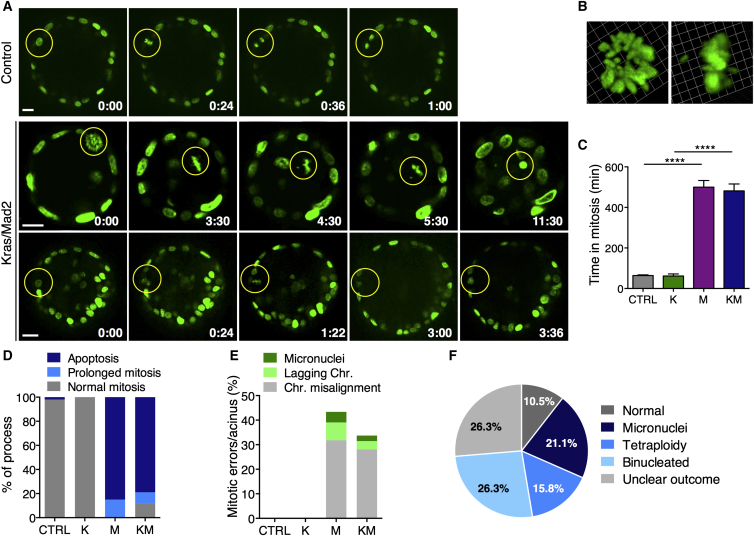
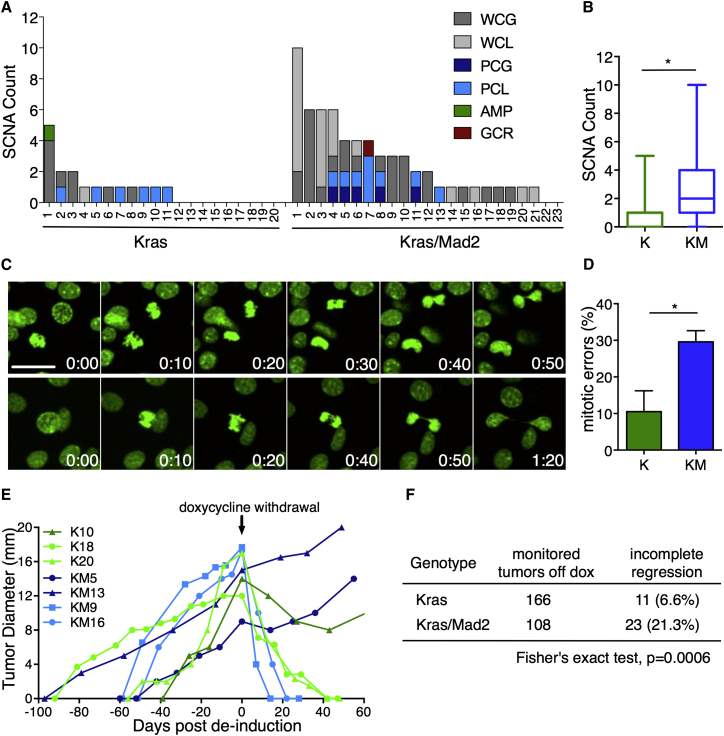
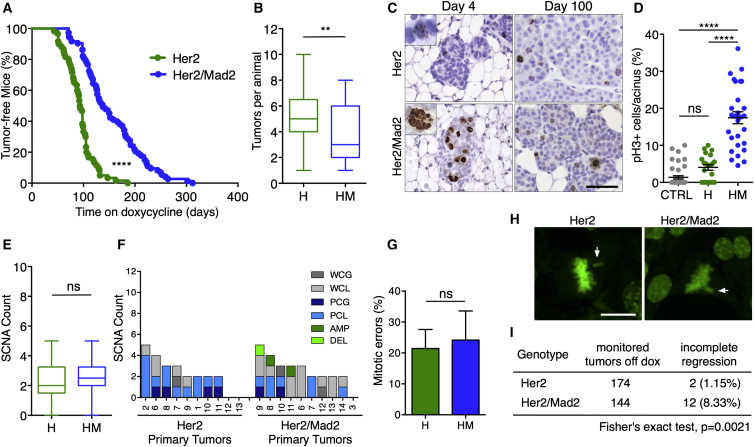
Chromosome instability (CIN) is associated with poor survival and therapeutic outcome in a number of malignancies. Despite this correlation, CIN can also lead to growth disadvantages. Here, we show that simultaneous overexpression of the mitotic checkpoint protein Mad2 with Kras(G12D) or Her2 in mammary glands of adult mice results in mitotic checkpoint overactivation and a delay in tumor onset. Time-lapse imaging of organotypic cultures and pathologic analysis prior to tumor establishment reveals error-prone mitosis, mitotic arrest, and cell death. Nonetheless, Mad2 expression persists and increases karyotype complexity in Kras tumors. Faced with the selective pressure of oncogene withdrawal, Mad2-positive tumors have a higher frequency of developing persistent subclones that avoid remission and continue to grow.


Figures

None
Graphical abstract
Figure 1
Figure 1
Mad2 Overexpression Delays Kras-Driven Tumor Initiation and Leads to Phenotypic Variance (A) Tumor-free survival after doxycycline administration. (control, n = 33; Mad2, n = 33; KrasG12D, n = 107; KrasG12D/Mad2, n = 75), Mantel-Cox test, p < 0.0001. (B) Tumors per animal. Mann-Whitney test, p = 0.0062. (C) Mammary glands after 4, 30, and 100 days on doxycycline stained against HA-Mad2. Scale bar, 50 μm. (D) Quantification of HA-positive cells per acinus after 4 and 100 days on doxycycline (M, n = 7; KM-A, n = 7; KM-B, n = 6; KM-C, n = 5). (E) Tumor onset in K and KM subgroups (K, n = 95; KM-A, n = 14; KM-B, n = 10; KM-C, n = 7). Kruskal-Wallis test, p < 0.0001; Dunn’s multiple comparisons test. ns, not significant. ∗∗p < 0.01, ∗∗∗∗p < 0.0001. See also Figure S1.
Figure 2
Figure 2
Mad2 Overexpression Increases Epithelial Cell Turnover after 4 Days of Transgene Induction In Vivo (A) Phospho-histone 3 staining of mammary glands after 4 days on doxycycline. Scale bar, 50 μm. (B) Double immunofluorescence of TUNEL (red) and HA-Mad2 (green) on mammary glands after 4 days on doxycycline (DAPI, blue). Scale bar, 50 μm. (C and D) Quantification of pH3 (C; CTRL, n = 6; M, n = 5; K, n = 6; KM, n = 13) and TUNEL-positive cells (D; CTRL, n = 6; M, n = 6; K, n = 9; KM, n = 14) per acinus at 4 days on doxycycline. Points represent single acinar measurements. (E) Nuclear volume quantification relative to control cells at 100days on doxycycline (CTRL, n = 6; M, n = 5; K, n = 5; KM-A, n = 6; KM-B, n = 5; KM-C, n = 4). Points represent single nuclear measurements; F-test for size variability. Data were analyzed by Kruskal-Wallis test, p < 0.0001; Dunn’s multiple comparisons test. p < 0.05, ∗∗p < 0.01, ∗∗∗p < 0.001, ∗∗∗∗p < 0.0001. See also Figure S2.
Figure 3
Figure 3
3D Cultures Recapitulate Increased Proliferation and Apoptosis following Mad2 Induction (A) Representative immunofluorescence images on fixed mammary spheroid cultures after 36 hr on doxycycline. Scale bars, 25 μm. (B and C) Quantification of mitotic cells (B; CTRL, n = 7; M, n = 4; K, n = 5; KM, n = 4) and cleaved Caspase 3-positive (C) cells per acinus after 36 hr on doxycycline (CTRL, n = 9; M, n = 6; K, n = 5; KM, n = 4). (D) Nuclear volume quantification in spheroids relative to control cells after 4 days on doxycycline (CTRL, n = 8; M, n = 4; K, n = 3; KM, n = 4). Points represent single nuclear measurements. Data were analyzed by Kruskal-Wallis test, p < 0.0001; Dunn’s multiple comparisons test. ColA1-HA-Mad2 animals were used: 2 in M and 2 in KM. ∗∗∗∗p < 0.0001. See also Figure S3.
Figure 4
Figure 4
Time-Lapse Imaging of Organotypic Cultures Reveals Error-Prone Mitosis because of Elevated Mad2 Levels (A) Time-lapse micrography of control and KrasG12D/Mad2 spheroids in vitro; t = 0 after 30 hr on doxycycline. The yellow circle indicates mitotic cells (H2B-GFP, green). Scale bar, 25 μm. Top: control cell entering mitosis and completing cell division inside the epithelial rim. Center: a KM cell arrests in mitosis, displays misaligned chromosomes, falls into the lumen, and dies after 11 hr. Bottom: KM cell arrests in mitosis, initiates apical extrusion, but reintegrates into the epithelial rim. (B) Representative 3D reconstructions of a KM mitotic cell with misaligned chromosomes. (C) Duration of mitosis in spheroid cultures (CTRL, 30 cells; K, 7 cells; M, 54 cells; KM, 42 cells); Kruskal-Wallis test, p < 0.0001; Dunn’s multiple comparisons test. (D) Fate of mitotic cells during 20-hr time-lapse in vitro (CTRL, 30 cells; K, 7 cells; M, 54 cells; KM, 42 cells). (E) Percentage of mitotic errors per acinus (CTRL, 29 cells; K, 7 cells; M, 45 cells; KM, 35 cells); one-way ANOVA test, p < 0.0001; Holm Sidak’s multiple comparisons test. (F) Outcome of completed cell division after mitotic arrest in Mad2-expressing acini. CTRL, n = 4; K, n = 3; M, n (ColA1-Mad2) = 2 and n (TetO-Mad2) = 1; KM, n (ColA1-Mad2) = 3 and n (TetO-Mad2) = 2. ∗∗∗∗p < 0.0001. See also Figure S4 and Movies S1, S2, S3, S4, and S5.
Figure 5
Figure 5
Mad2 Overexpression Boosts Aneuploidy and Facilitates Tumor Persistence after Oncogene Withdrawal (A) SCNAs in 20 Kras and 23 Kras/Mad2 primary tumors. Shown are whole chromosome gain (WCG) and loss (WCL), partial chromosome gain (PCG) and loss (PCL), focal amplification (AMP), and gross chromosomal rearrangement (GCR, red). x Axis, individual tumors; y axis, SCNAs per tumor. (B) Average SCNAs in K and KM tumors; Fisher’s exact test, p = 0.01039. (C) Representative micrographs of KM tumor cells in vitro (H2B-GFP, green). Scale bar, 25 μm. Top: furrow regression and polyploidization. Bottom: lagging chromosome during anaphase and cytokinesis failure. (D) Percentage of mitotic errors per tumor (K, n = 4, 74 cells; KM, n = 5, 84 cells); Mann-Whitney test, p = 0.0317. (E) Representative examples of tumor development in K and KM tumors. The arrow indicates doxycycline withdrawal (day 0). (F) Status of tumor regression in K and KM cohorts 2 months after doxycycline withdrawal. p < 0.05. See also Figures S5 and S6.
Figure 6
Figure 6
Elevated Levels of Mad2 Delay Her2-Driven Breast Tumorigenesis without Affecting Aneuploidy (A) Tumor-free survival after doxycycline administration (Her2, n = 60; Her2/Mad2, n = 73); Mantel-Cox test, p < 0.0001. (B) Number of tumors per animal; Mann-Whitney test, p = 0.0062. (C) Representative images of phospho-Histone 3 staining of mammary glands at 4 and 100 days on doxycycline. Scale bar, 50 μm. (D) Quantification of pH3-positive cells per acinus at 4 days on doxycycline. Points represent single acinar measurements (CTRL, n = 6; H, n = 3; HM, n = 4); Kruskal-Wallis test, p < 0.0001; Dunn’s multiple comparisons test. (E) Average SCNAs in H and HM tumors; Fisher’s exact test, p = 1. (F) Percentage of primary tumors of Her2 (left) and Her2/Mad2 cohort (right) containing specific structural variants per individual chromosome. (G) Percentage of mitotic errors per tumor (H, n = 5; HM, n = 4); Mann-Whitney test, p = 0.125. (H) Representative images showing misaligned chromosomes (arrows) in H and HM tumor cells in vitro (H2B-GFP, green). Scale bar, 20 μm. (I) Status of tumor regression in H and HM cohort 2 months after doxycycline withdrawal. ∗∗p < 0.01, ∗∗∗∗p < 0.0001. See also Figure S6.

References

    1. Boveri T. ANTON DOHBN. Science. 1912;36:453–468. - PubMed
    1. Carter S.L., Eklund A.C., Kohane I.S., Harris L.N., Szallasi Z. A signature of chromosomal instability inferred from gene expression profiles predicts clinical outcome in multiple human cancers. Nat. Genet. 2006;38:1043–1048. - PubMed
    1. Cerami E., Gao J., Dogrusoz U., Gross B.E., Sumer S.O., Aksoy B.A., Jacobsen A., Byrne C.J., Heuer M.L., Larsson E. The cBio cancer genomics portal: an open platform for exploring multidimensional cancer genomics data. Cancer Discov. 2012;2:401–404. - PMC - PubMed
    1. Chen G., Rubinstein B., Li R. Whole chromosome aneuploidy: big mutations drive adaptation by phenotypic leap. BioEssays. 2012;34:893–900. - PMC - PubMed
    1. Chen G., Mulla W.A., Kucharavy A., Tsai H.-J., Rubinstein B., Conkright J., McCroskey S., Bradford W.D., Weems L., Haug J.S. Targeting the adaptability of heterogeneous aneuploids. Cell. 2015;160:771–784. - PMC - PubMed

MeSH terms

LinkOut - more resources