. 2016 Jun 30;166(1):63-76.
doi: 10.1016/j.cell.2016.05.035. Epub 2016 Jun 9.

Mitochondrial Dynamics Controls T Cell Fate through Metabolic Programming

Affiliations

Mitochondrial Dynamics Controls T Cell Fate through Metabolic Programming

Michael D Buck et al. Cell. .

Abstract

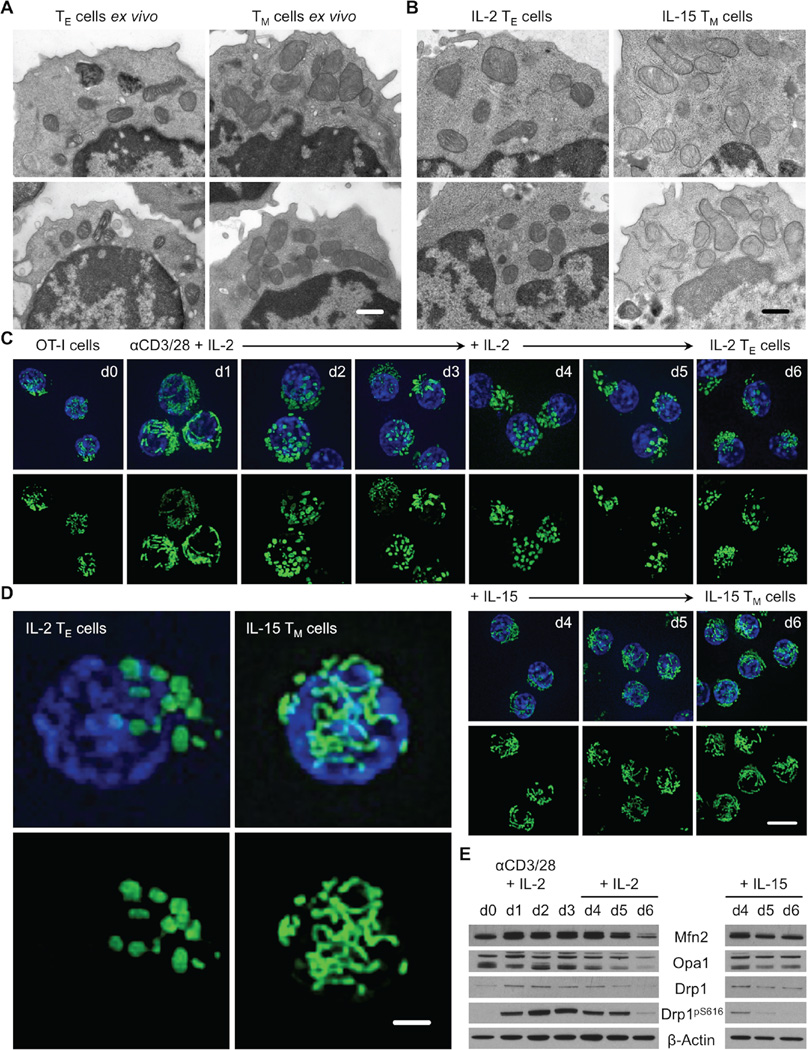
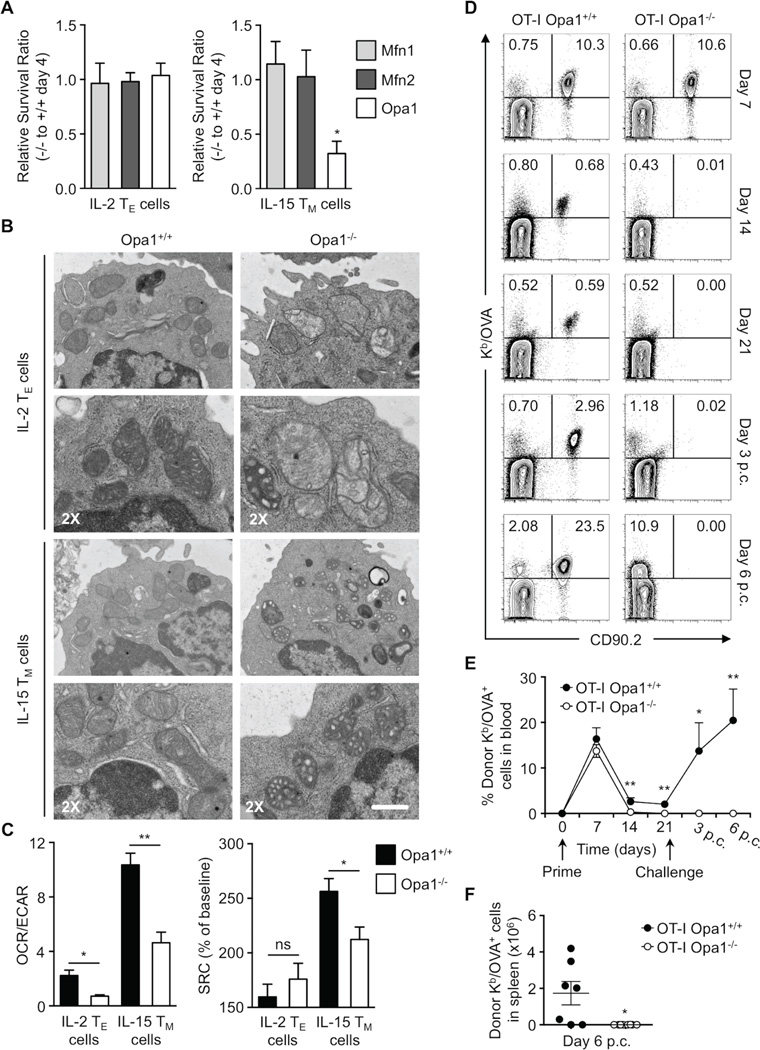
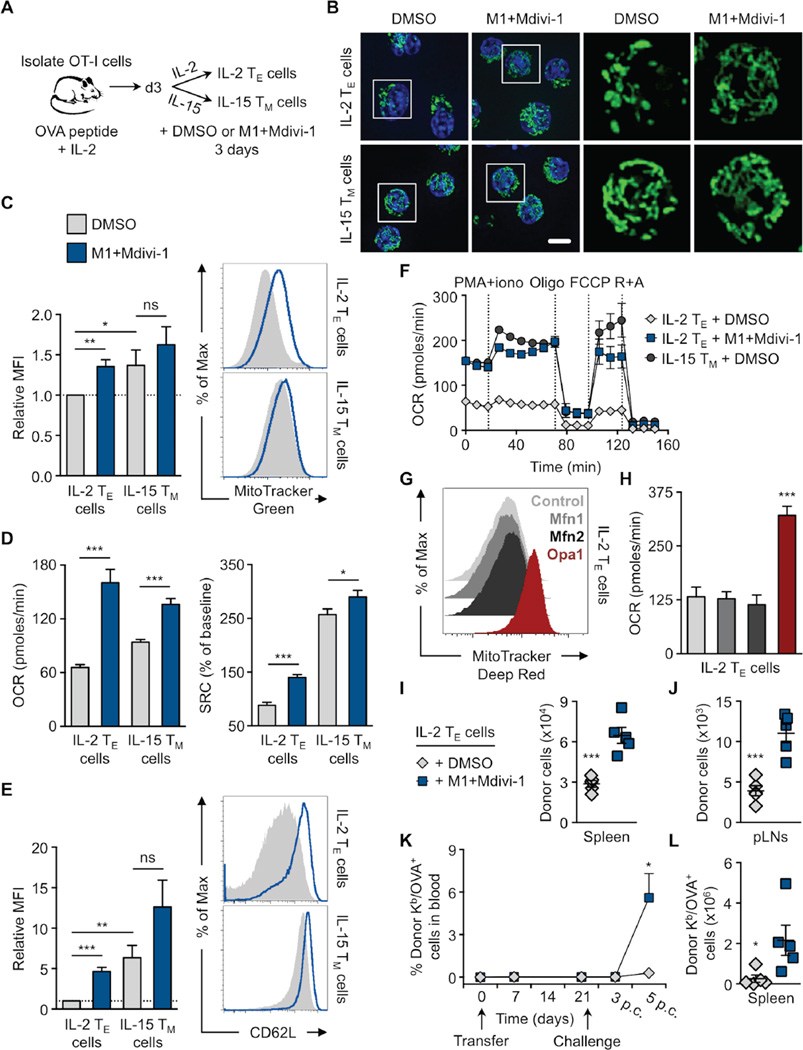
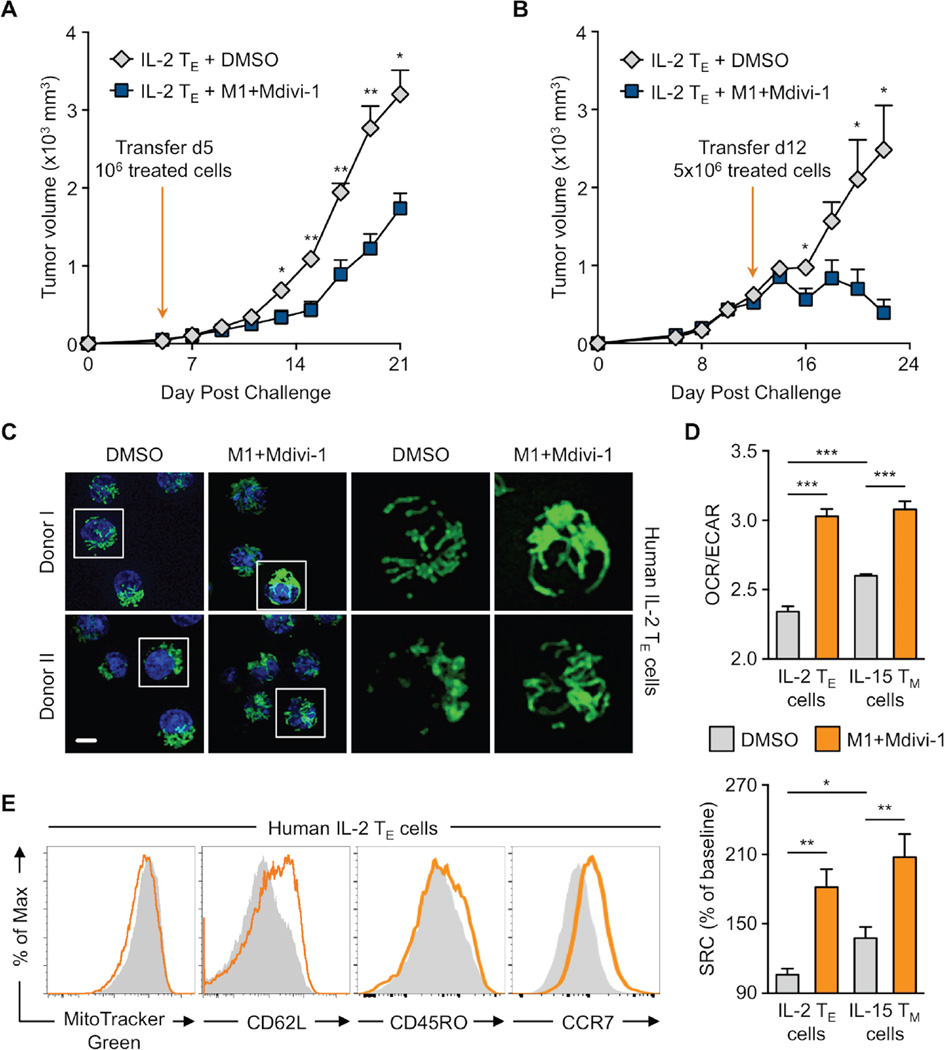
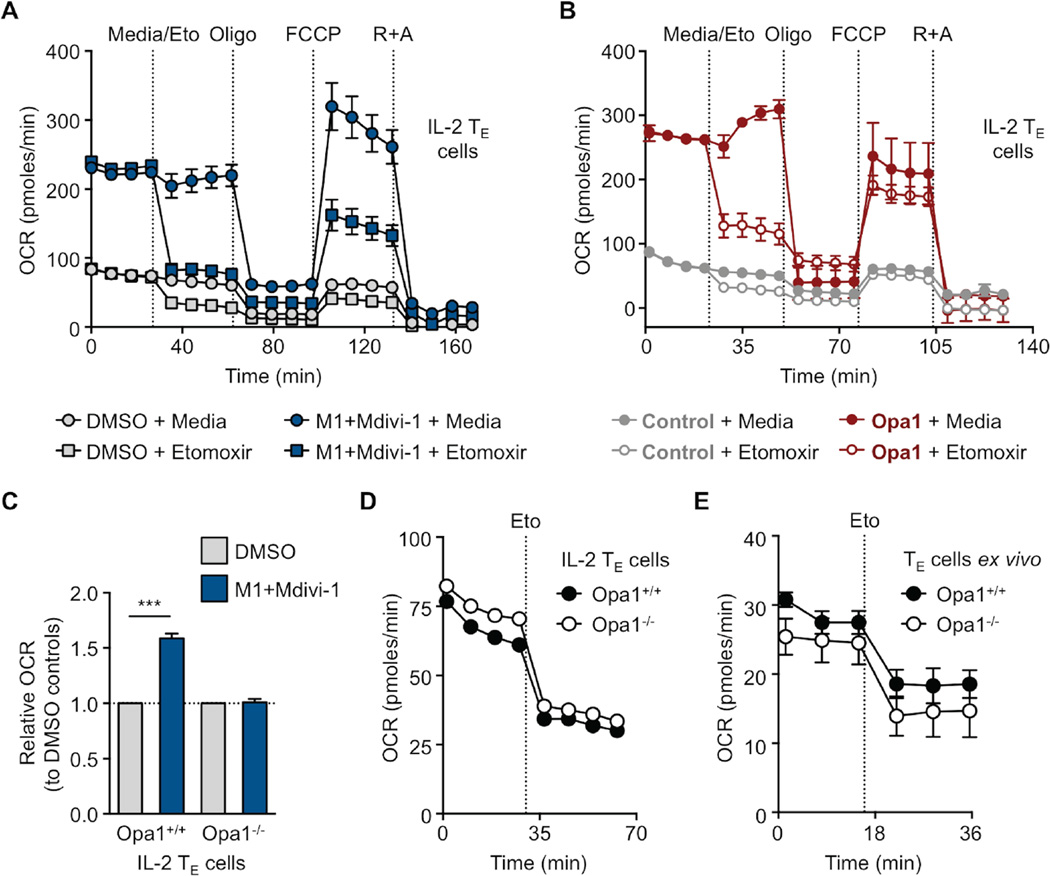
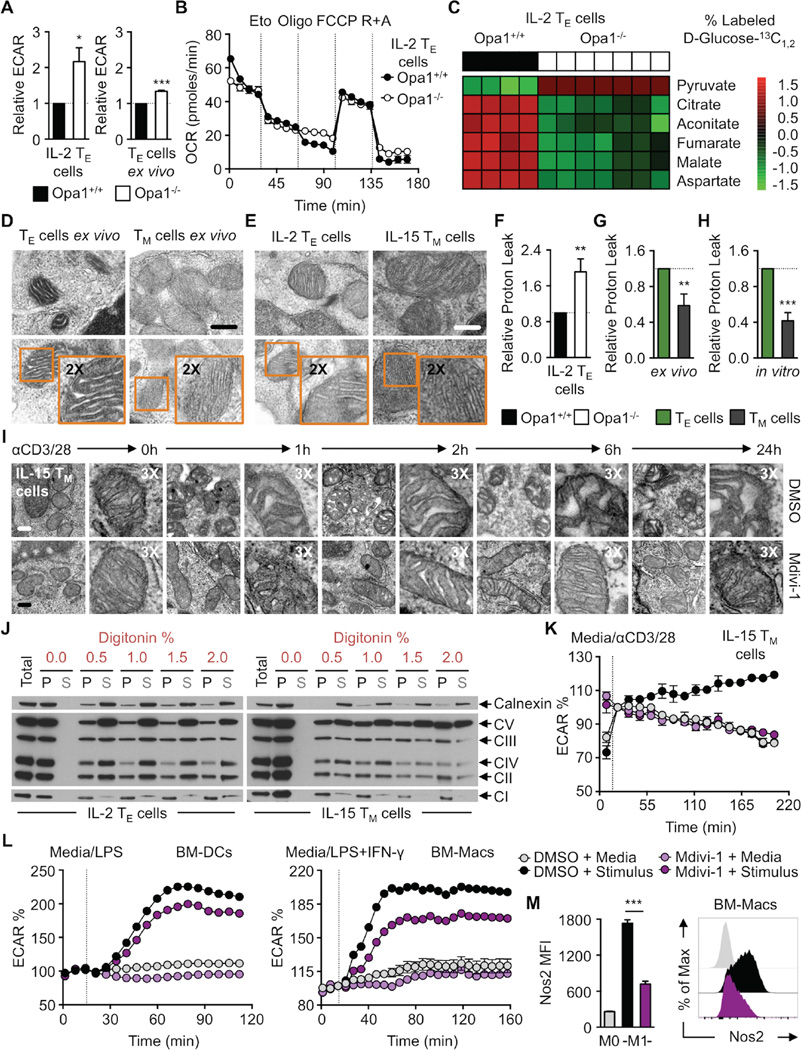
Activated effector T (TE) cells augment anabolic pathways of metabolism, such as aerobic glycolysis, while memory T (TM) cells engage catabolic pathways, like fatty acid oxidation (FAO). However, signals that drive these differences remain unclear. Mitochondria are metabolic organelles that actively transform their ultrastructure. Therefore, we questioned whether mitochondrial dynamics controls T cell metabolism. We show that TE cells have punctate mitochondria, while TM cells maintain fused networks. The fusion protein Opa1 is required for TM, but not TE cells after infection, and enforcing fusion in TE cells imposes TM cell characteristics and enhances antitumor function. Our data suggest that, by altering cristae morphology, fusion in TM cells configures electron transport chain (ETC) complex associations favoring oxidative phosphorylation (OXPHOS) and FAO, while fission in TE cells leads to cristae expansion, reducing ETC efficiency and promoting aerobic glycolysis. Thus, mitochondrial remodeling is a signaling mechanism that instructs T cell metabolic programming.


Figures

Figure 1
Figure 1. Effector and memory T cells possess distinct mitochondrial morphologies
(A) Effector (TE, CD44hi CD62Llo, 7 days post infection) and memory T (TM, CD44hi CD62Lhi, 21 days post infection) cells sorted from C57BL/6 mice infected i.p. with 107 CFU LmOVA and (B) IL-2 TE and IL-15 TM cells generated from differential culture of OT-I cells activated with OVA peptide and IL-2 using IL-2 or IL-15 analyzed by EM, scale bar = 0.5 µm. (C–D) Mitochondrial morphology in live OT-I PhAM cells before and after αCD3/CD28 activation and differential cytokine culture by spinning disk confocal microscopy. Mitochondria are green (GFP) and nuclei are blue (Hoechst), (C) scale bar = 5 µm, (D) scale bar = 1 µm. (E) Immunoblot analysis of cell protein extracts from (C), probed for Mfn2, Opa1, Drp1, phosphorylated Drp1 at Ser616 (Drp1pS616), and β-actin. (A–E) Representative of 2 experiments. See also Figure S1.
Figure 2
Figure 2. Memory T cell development and survival, unlike effectors, requires mitochondrial fusion
(A) Relative in vitro survival ratios of Mfn1, Mfn2, or Opa1 deficient (CD4 Cre+, −/−) to wild-type (CD4 Cre-, +/+) OT-I IL-2 TE and IL-15 TM cells (*p=0.0465). Data normalized from 2–3 independent experiments shown as mean ± SEM. (B) Mitochondrial morphology of OT-I Opa1 wild-type and Opa1−/− IL-2 TE and IL-15 TM cells analyzed by EM (scale bar = 0.5 µm, represents one experiment) and (C) Seahorse EFA. (Left) bar graph represents ratios of O2 consumption rates (OCR, indicator of OXPHOS) to extracellular acidification rates (ECAR, indicator of aerobic glycolysis) at baseline and (right) spare respiratory capacity (SRC) (% max OCR after FCCP injection of baseline OCR) of indicated cells (*p<0.03, **p=0.0079). Data from 3 experiments shown as mean ± SEM. (D–F) 104 OT-I Opa1+/+ or Opa1−/− T cells were transferred i.v. into C57BL/6 CD90.1 mice infected i.v. with 107 CFU LmOVA. Blood analyzed by flow cytometry at indicated times post infection. After 21 days, mice were challenged i.v. with 5×10⁷ CFU LmOVA and blood analyzed post challenge (p.c.). (D) % Donor Kb/OVA+ CD90.2+ cells shown in representative flow plots and (E) line graph with mean ± SEM (*p=0.0238, **p<0.005). (F) Number of donor Kb/OVA+ cells from spleens of infected mice shown with mean ± SEM (*p=0.0126). (D–F) Representative of 2 experiments (n=9–11/ group). See also Figure S2.
Figure 3
Figure 3. Enhancing mitochondrial fusion promotes the generation of memory-like T cells
(A–F, I–L) OVA peptide and IL-2 activated OT-I cells differentiated into IL-2 TE or IL-15 TM cells for 3 days in the presence of DMSO or 20 µM fusion promoter M1 and 10 µM fission inhibitor Mdivi-1 (M1+Mdivi-1) as shown (A) pictorially. (B) Representative spinning disk confocal images from 3 experiments of live cells from OT-I PhAM mice. Mitochondria are green (GFP) and nuclei are blue (Hoechst), scale bar = 5 µm. (C) Cells stained with MitoTracker Green and analyzed by flow cytometry. Relative MFI (left) from 6 experiments (*p=0.0394, **p=0.0019) with representative histograms (right). (D) Baseline OCR and SRC from 3–4 experiments (*p=0.0485, ***p<0.0001) and (E) CD62L expression analyzed by flow cytometry of indicated cells. Relative MFI (left) from 7 experiments (*p=0.0325, **p=0.0019, ***p<0.0001) with representative histograms (right). (F) OCR of indicated cells at baseline and in response to PMA and ionomycin stimulation (PMA+iono), oligomycin (Oligo), FCCP, and rotenone plus antimycin A (R+A). Represents 2 experiments. (C–F) Shown as mean ± SEM. (G–H) OT-I cells were transduced with either empty (Control), Mfn1, Mfn2, or Opa1 expression vectors, sorted, and cultured to generate IL-2 TE cells. (G) Representative histograms of MitoTracker Deep Red staining from 4 experiments and (H) basal OCR from 2 experiments of transduced cells. (I–L) 1–2×10⁶ IL-2 TE cells cultured with DMSO (gray diamonds) or M1+Mdivi-1 (blue squares) were transferred into congenic C57BL/6 recipient mice. Cell counts of donor cells recovered 2 days later from the (I) spleen (***p=0.005) and (J) peripheral lymph nodes (pLNs, ***p=0.0006). Dots are individual mice. (K) Blood from recipient mice analyzed for % donor Kb/OVA+ cells post transfer and challenge with 107 CFU LmOVA by flow cytometry (*p=0.0150, n=5/group). (L) Donor Kb/OVA+ cells recovered from recipient spleens 6 days p.c. (*p=0.0383). Dots are individual mice (I–L) Represents 2 experiments shown with mean ± SEM. See also Figure S3.
Figure 4
Figure 4. Mitochondrial fusion improves adoptive cellular immunotherapy against tumors
(A–B) C57BL/6 mice inoculated s.c. with 106 EL4-OVA cells. (A) After 5 or (B) 12 days, 106 or 5×10⁶ OT-I IL-2 TE cells cultured with DMSO or M1+Mdivi-1 were transferred i.v. into recipients and tumor growth assessed. Represents 2 experiments shown as mean ± SEM (n=5/group, *p<0.05, **p<0.005). (C-E) Human CD8+ PBMCs activated with αCD3/CD28 + IL-2 to generate IL-2 TE cells. (C) Confocal images of indicated cells where mitochondria are green (MitoTracker) and nuclei are blue (Hoechst). Representative images from 2 of 4 biological donors, scale bar = 5 µm. (D) OCR/ECAR ratios and SRC of indicated cells from 2 separate donors shown as mean ± SEM (*p=0.0303, **p<0.005, ***p<0.0001). (E) MitoTracker Green staining and CD62L, CD45RO, and CCR7 expression analyzed by flow cytometry shown with representative histograms from 4–6 biological replicates. See also Figure S4.
Figure 5
Figure 5. Fusion promotes memory T cell metabolism, but Opa1 is not required for FAO
(A–E) OCR measured at baseline and in response to media, etomoxir (Eto) and other drugs as indicated of (A) IL-2 TE cells cultured in DMSO or M1+Mdivi-1, (B) control or Opa1 transduced IL-2 TE cells, (C) Opa1+/+ and Opa1−/− IL-2 TE cells cultured in DMSO or M1+Mdivi-1 (D) or without drugs, and (E) ex vivo donor OT-I Opa1+/+ and Opa1−/− day 7 TE cells derived from LmOVA infection. (A-E) Representative of 2 experiments shown as mean ± SEM (***p<0.0001). See also Figure S5.
Figure 6
Figure 6. Mitochondrial cristae remodeling signals metabolic pathway engagement
(A) Basal ECAR of OT-I Opa1+/+ and Opa1−/− IL-2 TE cells (left) and day 7 TE cells isolated ex vivo after adoptive transfer from LmOVA infection (right). Data combined from 2–3 experiments (*p=0.0412, ***p<0.0001). (B) OCR at baseline and with indicated drugs, representative of 2 experiments shown as mean ± SEM and (C) D-Glucose-13C1,2 trace analysis of OT-I Opa1+/+ and Opa1−/− IL-2 TE cells. Each lane represents separate mice with a technical replicate. (D) EM analysis of mitochondrial cristae from TE and TM cells isolated after LmOVA infection and (E) in vitro cultured IL-2 TE and TM cells. Representative of 2 experiments, scale bar = 0.25 µm. Relative proton leak (ΔOCR after oligomycin and subsequent injection of rotenone plus antimycin A) of (F) Opa1+/+ and Opa1−/− IL-2 TE, (G) infection elicited TE and TM, and (H) IL-2 TE and IL-15 TM cells. (F–H) Combined from 2–4 experiments shown as mean ± SEM (p**<0.005, ***p<0.0001). (I) EM analysis of IL-15 TM cell-mitochondrial cristae before and after αCD3/CD28 bead stimulation over hours. Scale bar = 0.2 µm, represents one experiment. (J) Immunoblot analysis of Calnexin and ETC complexes (CI-NDUFB8, CII-SDHB, CIII-UQCRC2, CIV-MTC01, CV-ATP5A). Equivalent numbers of IL-2 TE and IL-15 TM cells lysed in native lysis buffer followed by digitonin solubilization of intracellular membranes with pellet (P) and solubilized supernatant (S) fractions resolved on a denaturing gel, representative of 2 experiments. (K) IL-15 TM cell, (L) BM-DCs and BM-Macs % ECAR measured at baseline and after media, αCD3/CD28 bead, LPS, or LPS+IFN-γ injection as indicated. Data baselined prior to or right after injection with stimuli. (M) BM-Macs stained for intracellular Nos2 protein by flow cytometry with MFI values (left) and representative histogram (right). (K–M) Shown as mean ± SEM and represent 2–3 experiments (***p<0.0001). See also Figure S6.

Comment in

Similar articles

Cited by

References

    1. Archer SL. Mitochondrial fission and fusion in human diseases. N Engl J Med. 2014;370:1074. - PubMed
    1. Baixauli F, Martin-Cofreces NB, Morlino G, Carrasco YR, Calabia-Linares C, Veiga E, Serrador JM, Sanchez-Madrid F. The mitochondrial fission factor dynamin-related protein 1 modulates T-cell receptor signalling at the immune synapse. EMBO J. 2011;30:1238–1250. - PMC - PubMed
    1. Benard G, Bellance N, James D, Parrone P, Fernandez H, Letellier T, Rossignol R. Mitochondrial bioenergetics and structural network organization. J Cell Sci. 2007;120:838–848. - PubMed
    1. Buck MD, O’Sullivan D, Pearce EL. T cell metabolism drives immunity. J Exp Med. 2015;212:1345–1360. - PMC - PubMed
    1. Campello S, Lacalle RA, Bettella M, Manes S, Scorrano L, Viola A. Orchestration of lymphocyte chemotaxis by mitochondrial dynamics. J Exp Med. 2006;203:2879–2886. - PMC - PubMed

Publication types