. 2016 Jul 14;166(2):369-379.
doi: 10.1016/j.cell.2016.05.054. Epub 2016 Jun 9.

Forces Driving Chaperone Action

Affiliations

Forces Driving Chaperone Action

Philipp Koldewey et al. Cell. .

Abstract

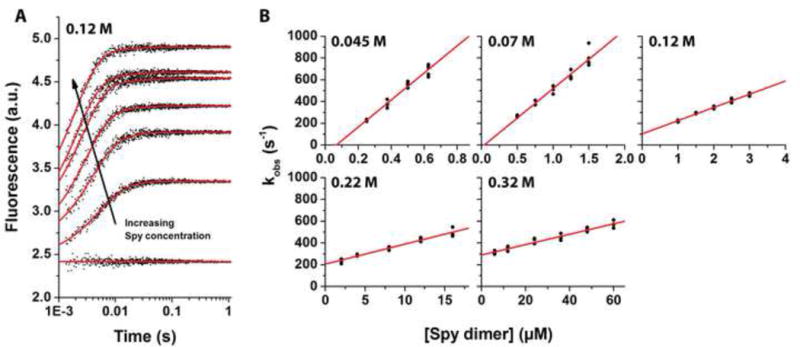
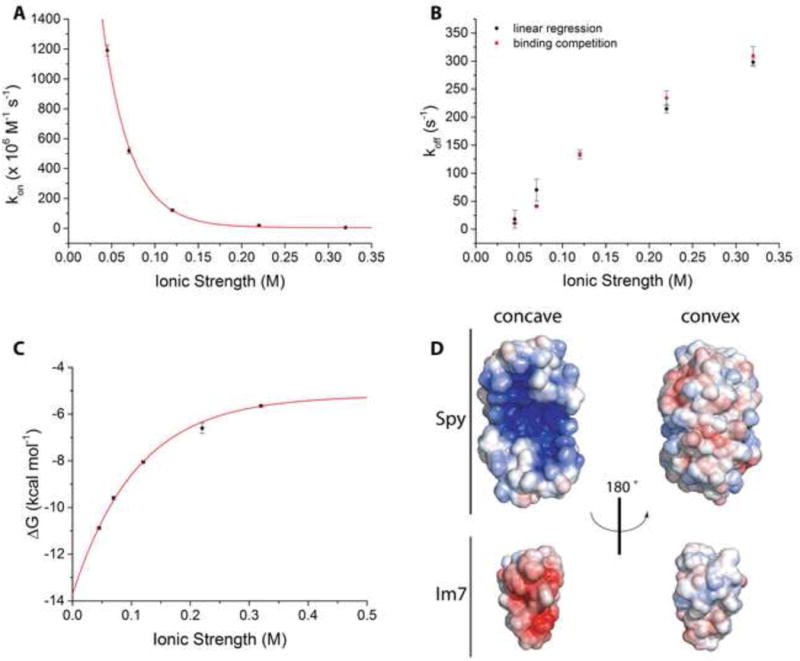
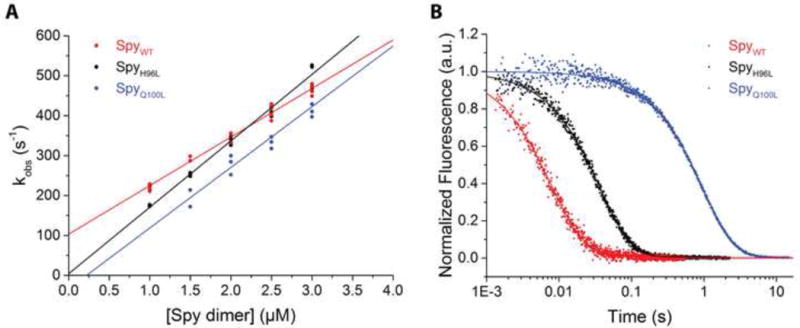
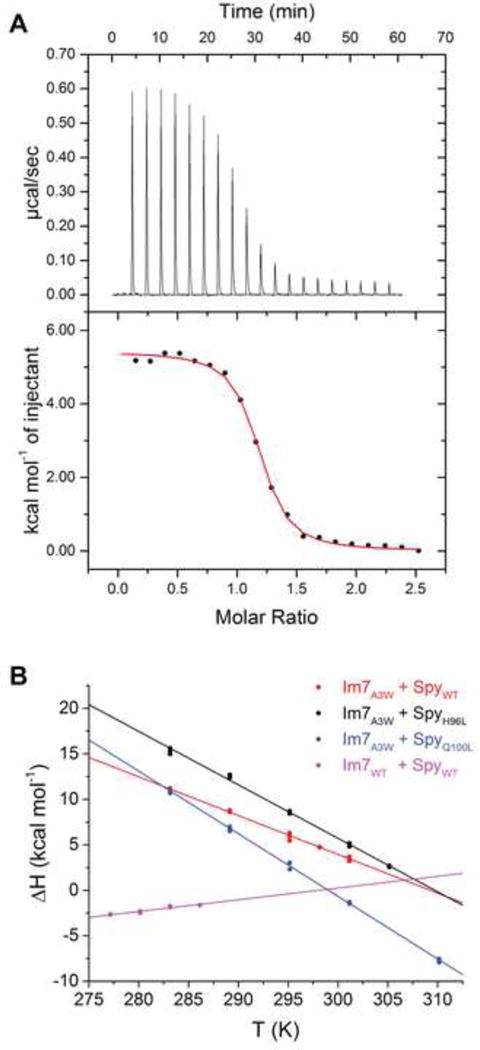
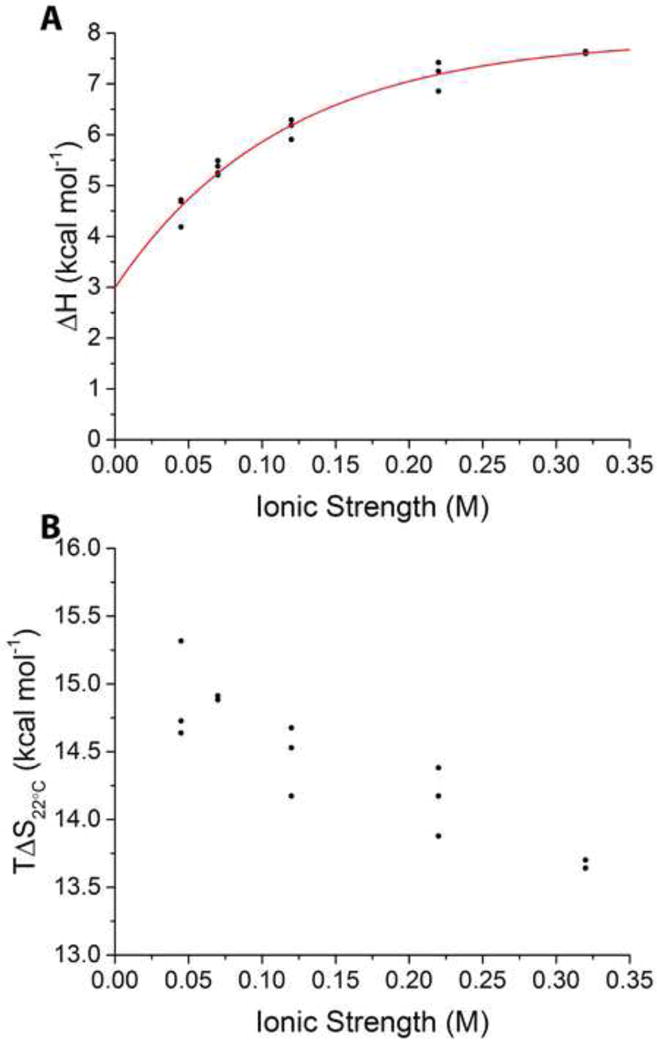
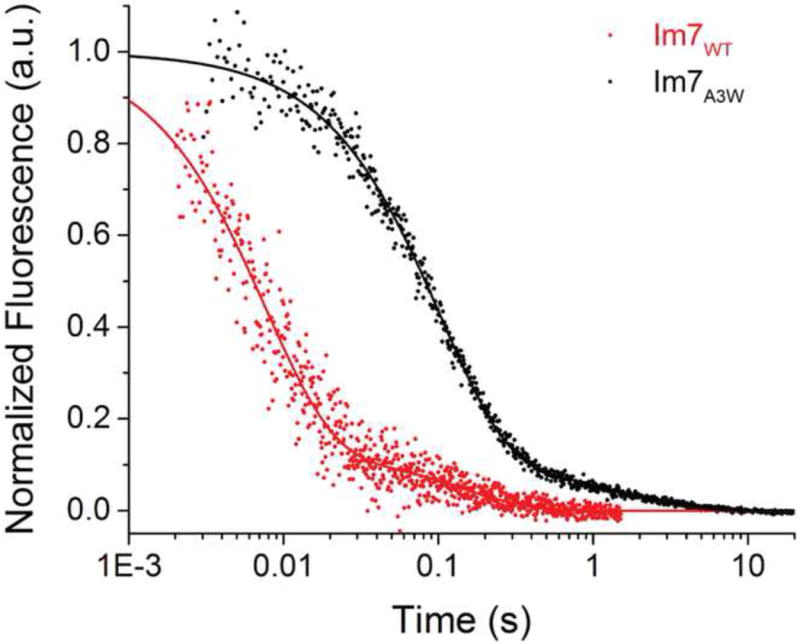
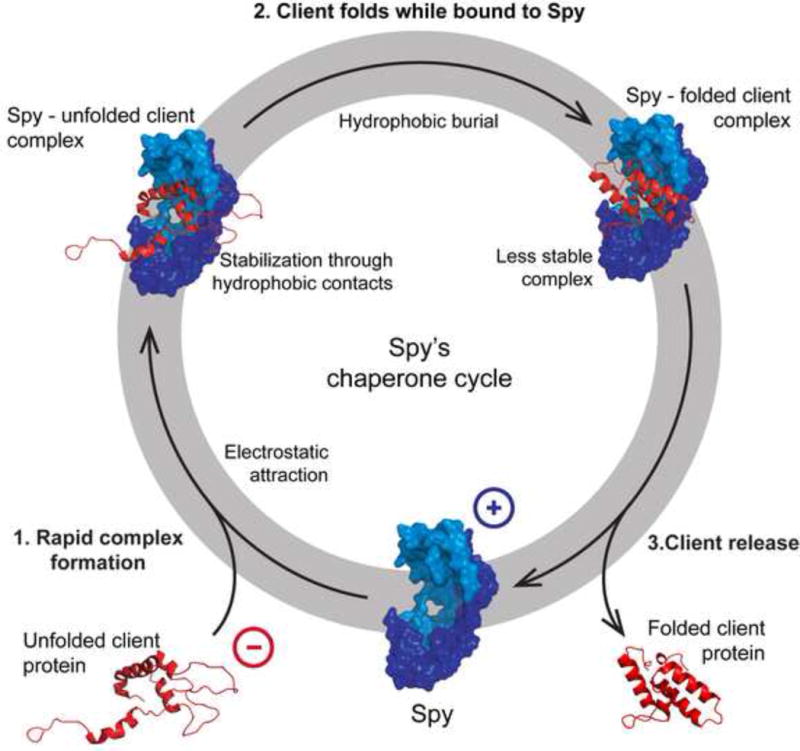
It is still unclear what molecular forces drive chaperone-mediated protein folding. Here, we obtain a detailed mechanistic understanding of the forces that dictate the four key steps of chaperone-client interaction: initial binding, complex stabilization, folding, and release. Contrary to the common belief that chaperones recognize unfolding intermediates by their hydrophobic nature, we discover that the model chaperone Spy uses long-range electrostatic interactions to rapidly bind to its unfolded client protein Im7. Short-range hydrophobic interactions follow, which serve to stabilize the complex. Hydrophobic collapse of the client protein then drives its folding. By burying hydrophobic residues in its core, the client's affinity to Spy decreases, which causes client release. By allowing the client to fold itself, Spy circumvents the need for client-specific folding instructions. This mechanism might help explain how chaperones can facilitate the folding of various unrelated proteins.


Figures

Figure 1
Figure 1. Complex Formation between Spy and Im7A3W Slows Down with Increasing Salt Concentrations as Determined by Stopped-Flow Fluorescence
(A) Representative raw transients for 250 nM Im7A3W mixed with increasing concentrations of Spy at an ionic strength of 0.12 M in the stopped-flow fluorimeter. Traces were fitted with a double exponential function to obtain observed rate constants (kobs). The kinetic traces are averages of four replicates. (B) kobs of the bimolecular step of Spy-Im7 interaction were plotted as a function of Spy dimer concentration to determine the binding (kon) and release (koff) rate constant at increasing ionic strengths and 22°C: 0.0625 μM Im7A3W (0.045 M), 0.125 μM Im7A3W (0.07 M), 0.250 μM Im7A3W (0.12 M), 0.5 μM Im7A3W (0.22 M), and 1.5 μM Im7A3W (0.32 M) were mixed with increasing concentrations of SpyWT· kobs at low ionic strength (< 0.12 M) were derived from single exponential fits of the raw fluorescence transients, whereas at ionic strength ≥ 0.12 M, double exponential fits were used (see Figure S3). A linear fit of kobs as a function of Spy concentration yielded kon from the slope and koff from the intercept (Table S1). At an ionic strength of 0.12 M, Spy binds to Im7A3W with a kon of 1.2 ± 0.4 × 10⁸ M−1 s−1, which is consistent with what was shown for the interaction of Spy with Im7A3 (Stull et al., 2016), demonstrating that the tryptophan substitution does not affect the kinetics of Spy-Im7 interaction. The ionic strength was adjusted with sodium chloride in 40 mM Hepes (pH 7.5). The kobs of four experiment per Spy concentration were plotted to show the experimental error.
Figure 2
Figure 2. Spy-Im7A3W Binding Is Salt-Dependent
(A and B) Stopped-flow binding experiments were conducted in 40 mM Hepes, pH 7.5 of different ionic strengths, adjusted with 0.025 to 0.30 M sodium chloride (see Figure 1). (A) The binding rate constant kon of Spy-Im7A3W interaction as a function of ionic strength was derived from the slope of the linear fits of the observed rate constants (see Figure 1B). Errors are propagated fitting standard errors of four independent data points. (B) The release rate constant koff was derived either from the corrected y-intercepts of linear fits (black, see Figure 1B) or competition experiments (red) (see Figure S3). The binding and release rate constants are affected differently by the ionic strength. Whereas kon decreases exponentially with increasing ionic strength (A), koff increases exponentially (B). Note that at all ionic strengths tested, the release rate constant obtained by binding competition is, within error, identical to the koff determined from the corrected y-intercept. Errors are propagated fitting standard errors of three independent data points. (C) The binding free energy (ΔG) of Spy-Im7A3W interaction increases exponentially with ionic strength. The ΔG was derived from the kinetic dissociation constant (Kd) (see Experimental Procedures and Table S1). At infinite ionic strength, ΔG = −5.2 kcal mol−1, suggesting that hydrophobic interactions contribute to complex stability. Errors are propagated fitting standard errors of three independent data points. (D) Distribution of positive and negative surface charge on Spy (PDB: 3O39) and folded Im7 (PDB 1CEI). Whereas positive charges (blue) outweigh negative charges (red) on the concave side of Spy, the convex side reveals a more even charge distribution. In contrast, Im7 contains a hot-spot of condensed negative charge at the site where it binds to its in vivo binding partner E7 (Ko et al., 1999). The electrostatic surface potential was calculated via PyMol using the APBS tools2.1 plugin (a color scale for the charge distribution from −5 to 5 was chosen). The respective .pqr file was generated on the PDB2PQR website for a pH of 7.5 (http://www.poissonboltzmann.org) (Unni et al., 2011).
Figure 3
Figure 3. Super Spy Variants Q100L and H96L Bind Im7A3W Tighter than SpyWT Due to a Slower Release Rate Constant
(A) Observed rate constants (kobs) of the binding step were derived from single (SpyH96L) double (SpyWT) or triple (SpyQ100L) exponential fits of the raw transients (Figure S3) and are plotted as a function of Spy concentration: 0.25 μM Im7A3W mixed with SpyWT, 1st phase (red), SpyH96L (black), or SpyQ100L, 1st phase (blue). Data were fit to a line to yield the binding rate constant of Spy to Im7 (see Table S1). Three independent data points per Spy concentration were collected to show the experimental error. Note that the kobs of the additional phases can be found in Figure S3. (B) Binding competition experiments in which 0.25 μM Im7A3W in complex with the respective Spy variant (2 μM SpyWT (red), 2 μM SpyH96L (black), 0.5 μM SpyQ100L (blue)) was mixed with the tryptophan-free, unfolded Im7 variant, Im7A3W75F (see also Figure S3). All traces show a small second phase and had to be fit to a double exponential function. All experiments were performed in 40 mM Hepes, pH 7.5, 100 mM sodium chloride. See also Table S1. The kinetic traces are averages of four replicates.
Figure 4
Figure 4. Spy-Im7 Interaction Is an Entropy-Driven Process Due to Hydrophobic Interactions in the Complex
(A) Representative ITC binding isotherm of SpyWT + Im7A3W at 22°C. Integrated thermograms (bottom graph) are fitted to a single site-binding model. (B) Binding enthalpy (ΔH) of Spy-Im7 complex formation as a function of temperature measured via ITC. The heat capacity changes (ΔCp) were derived from the slope of a linear fit. Im7A3W binding to SpyWT (red), Spy H96L (black), or Spy Q100L (blue) resulted in a negative ΔCp, whereas Im7WT titrated with SpyWT (magenta) resulted in a positive ΔCp. All experiments were performed in 40 mM Hepes (pH 7.5), 100 mM sodium chloride. Three independent data points per Spy concentration were collected to show the experimental error.
Figure 5
Figure 5. Screening of Ionic Interactions Enthalpically Disfavors Complex Formation
(A and B) ITC binding titrations of Spy-Im7A3W with SpyWT at 22°C were performed in 40 mM Hepes (pH 7.5) containing 25 to 300 mM sodium chloride to obtain thermodynamic parameters: enthalpy (ΔHb) (A) and entropy (ΔSb) (B). Three independent data points per sodium chloride concentration were collected to show the experimental error.
Figure 6
Figure 6. Native State of Im7 Is Released from Spy 13-Fold Faster than Unfolded State
Binding competition experiments were performed: 2.5 μM Im7WT in complex with 4 μM SpyWT dimer was mixed with 50 μM of Im7A3W75F to determine the release rate constant of natively folded Im7 (red); 0.25 μM Im7A3W in complex with 0.5 μM SpyWT dimer was mixed with 25 μM of Im7A3W75F to determine the release rate constant of the unfolded state of Im7 (black). In both cases, a double exponential fit was used (see also Figure S7). The second, slow phase observed for Im7WT is caused by either refolding or release of a subpopulation of partially unfolded Im7WT, whereas the fast phase is due to the release of the bound native state of Im7, as revealed by double mixing experiments (see Figure S7). This experiment was performed at 4°C in 40 mM Hepes (pH 7.5) and 25 mM sodium chloride to slow down the release of Im7WT. The kinetic traces are averages of four replicates.
Figure 7
Figure 7. Mechanistic Scheme of Spy-Client Interaction
(1) Client binding rates are maximized through long-range electrostatic attraction, which allows Spy (blue) to effectively compete with aggregation of the unfolded client protein (red). Client release, on the other hand, is energetically disfavored mainly by the solvation of hydrophobic surface area on the client and Spy, which are buried in the complex. (2) Folding of the client results in the burial of hydrophobic residues in the client’s core, which decreases its affinity to Spy, and therefore (3) favors release of the client protein. The electrostatic interactions, however, allow the client to stay bound to Spy while it folds.

Similar articles

Cited by

References

    1. Baldwin RL. Temperature Dependence of the Hydrophobic Interaction in Protein Folding. Proc Natl Acad Sci. 1986;83:8069–8072. - PMC - PubMed
    1. Bardwell JCA, Jakob U. Conditional disorder in chaperone action. Trends Biochem Sci. 2012;37:517–525. - PMC - PubMed
    1. Berg OG, von Hippel PH. Diffusion-controlled macromolecular interactions. Annu Rev Biophys Biophys Chem. 1985;14:131–160. - PubMed
    1. Capaldi AP, Shastry MCR, Kleanthous C, Roder H, Radford SE. Ultrarapid mixing experiments reveal that Im7 folds via an on-pathway intermediate. Nat Struct Biol. 2001;8:68–72. - PubMed
    1. Capaldi AP, Kleanthous C, Radford SE. Im7 folding mechanism: misfolding on a path to the native state. Nat Struct Biol. 2002;9:209–216. - PubMed

Publication types

MeSH terms