. 2016 Jun 30;166(1):193-208.
doi: 10.1016/j.cell.2016.05.020. Epub 2016 Jun 9.

Restricted Location of PSEN2/γ-Secretase Determines Substrate Specificity and Generates an Intracellular Aβ Pool

Affiliations

Restricted Location of PSEN2/γ-Secretase Determines Substrate Specificity and Generates an Intracellular Aβ Pool

Ragna Sannerud et al. Cell. .

Abstract

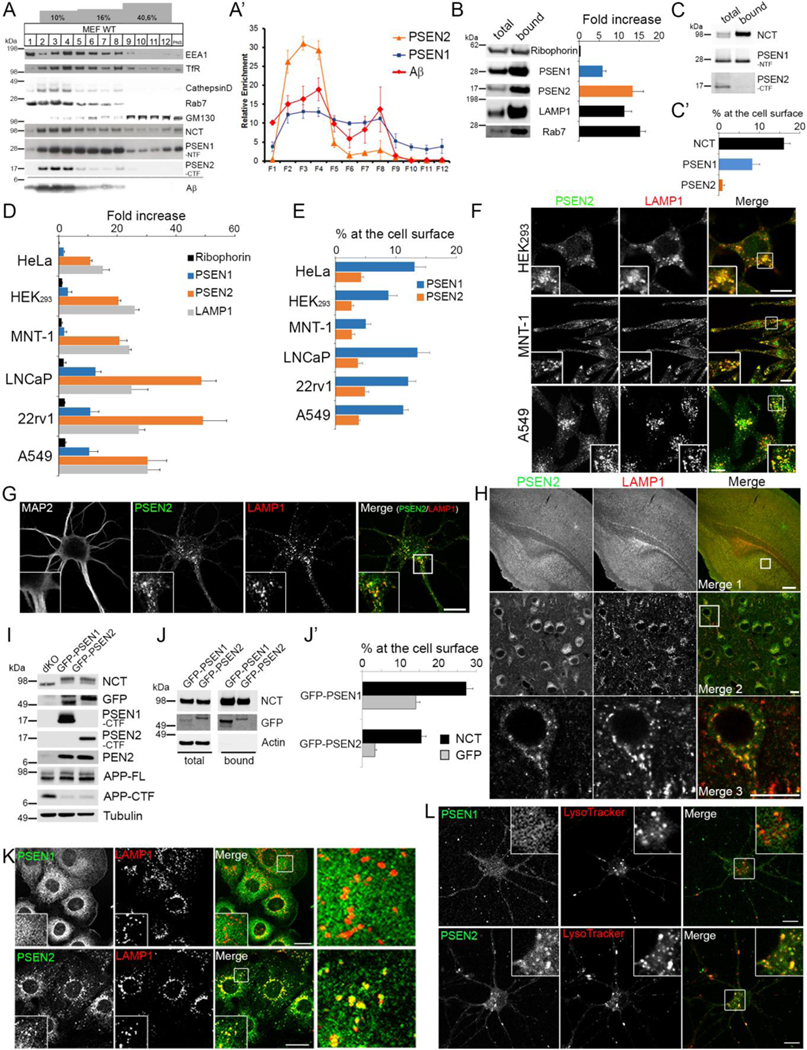
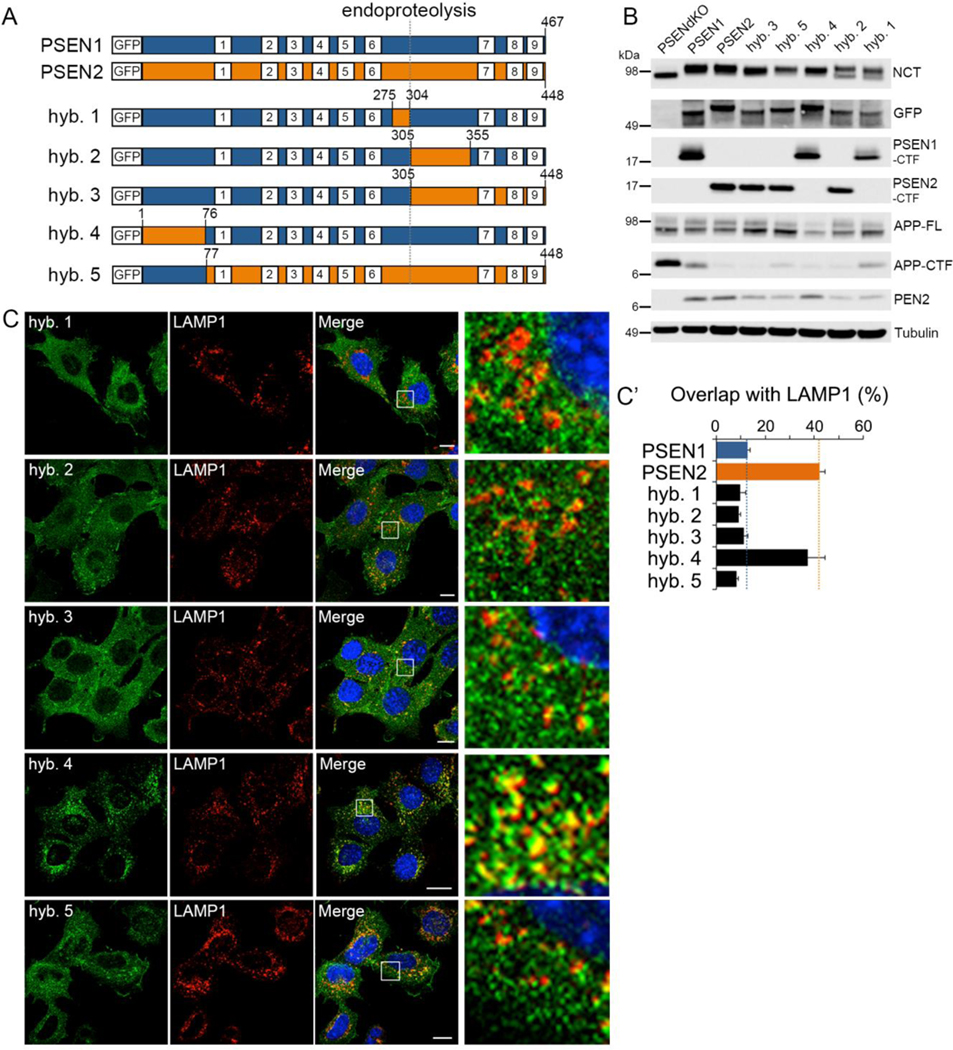
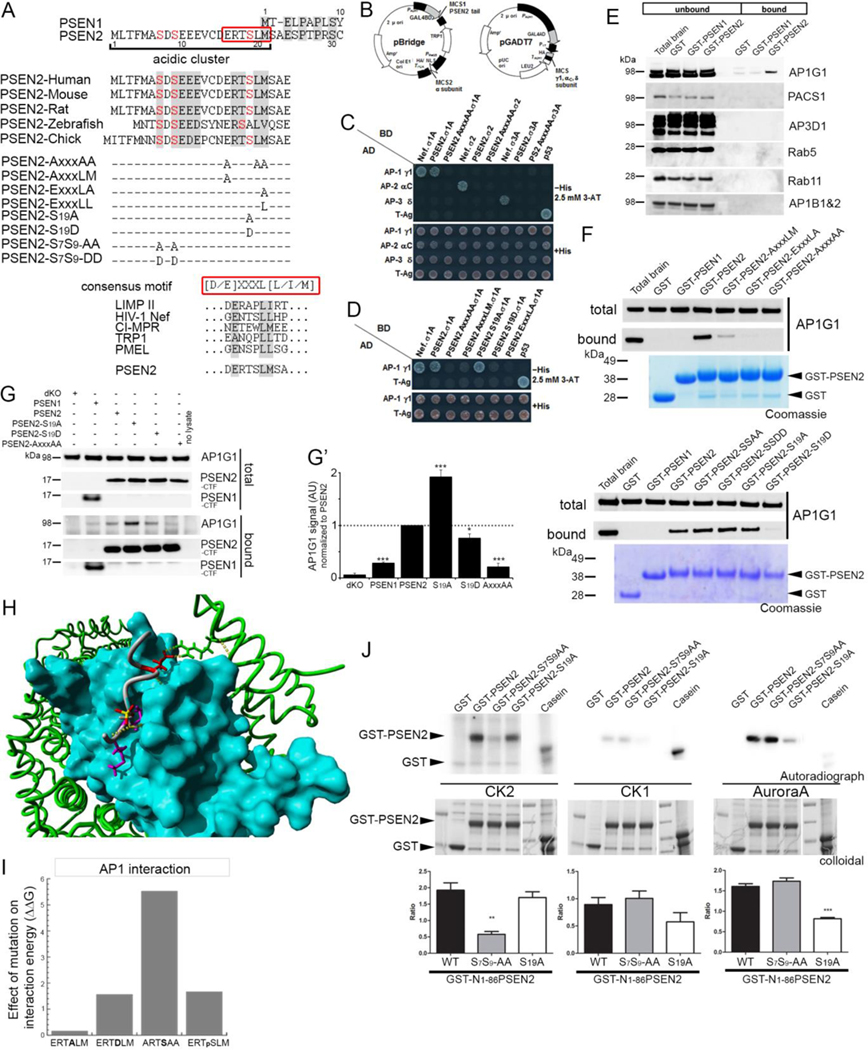
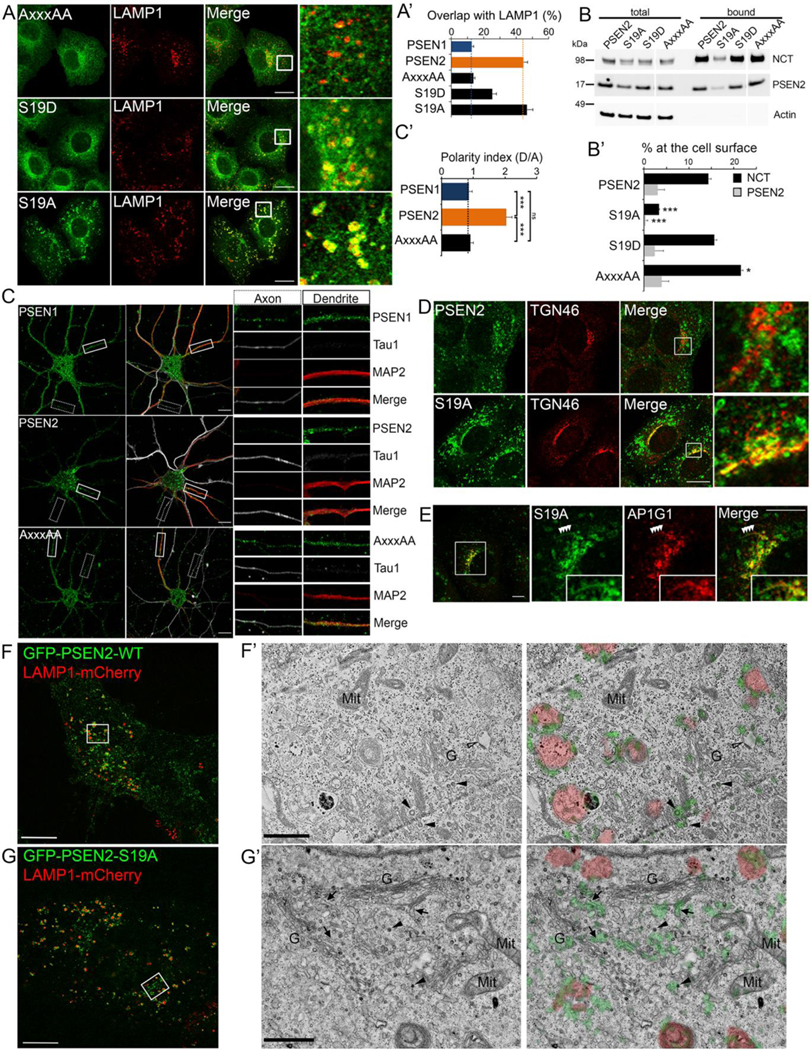
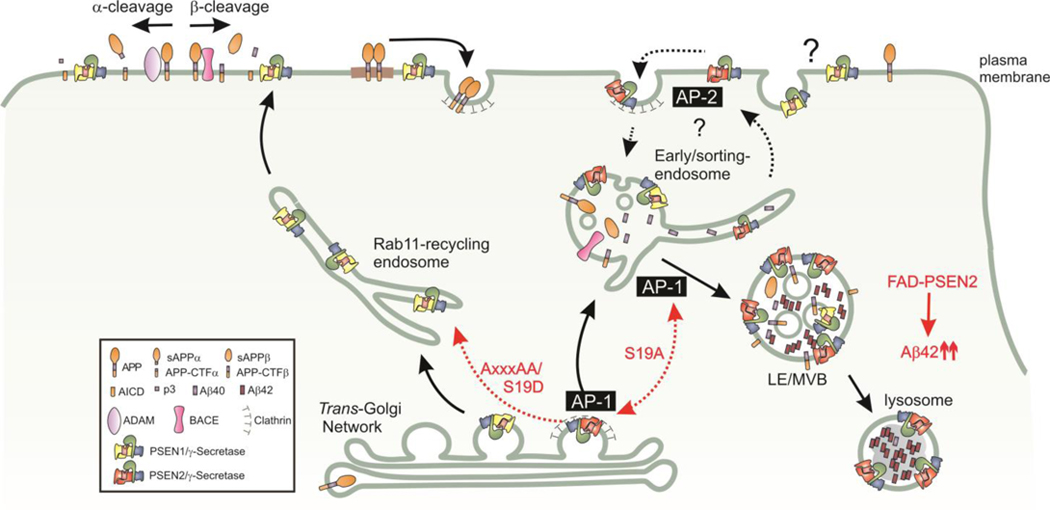
γ-Secretases are a family of intramembrane-cleaving proteases involved in various signaling pathways and diseases, including Alzheimer's disease (AD). Cells co-express differing γ-secretase complexes, including two homologous presenilins (PSENs). We examined the significance of this heterogeneity and identified a unique motif in PSEN2 that directs this γ-secretase to late endosomes/lysosomes via a phosphorylation-dependent interaction with the AP-1 adaptor complex. Accordingly, PSEN2 selectively cleaves late endosomal/lysosomal localized substrates and generates the prominent pool of intracellular Aβ that contains longer Aβ; familial AD (FAD)-associated mutations in PSEN2 increased the levels of longer Aβ further. Moreover, a subset of FAD mutants in PSEN1, normally more broadly distributed in the cell, phenocopies PSEN2 and shifts its localization to late endosomes/lysosomes. Thus, localization of γ-secretases determines substrate specificity, while FAD-causing mutations strongly enhance accumulation of aggregation-prone Aβ42 in intracellular acidic compartments. The findings reveal potentially important roles for specific intracellular, localized reactions contributing to AD pathogenesis.


Figures

Figure 1:
Figure 1:. PSEN1 and PSEN2 have distinct subcellular distributions.
(A) Discontinuous sucrose/D2O flotation gradient of WT MEF postnuclear supernatant analyzed by Western blot using compartment specific antibodies. De novo Aβ production measured using a cell free assay. (A’) Quantification of the enrichments from (A) for PSEN1 (blue), PSEN2 (orange) and γ-secretase activity (Aβ, red, mean ± SEM, n=2 for PSENs, n=4 for Aβ). (B-C) Quantitative Western blot of LE/LYS isolated using SPIONs (B) and cell surface biotinylated PSENs and nicastrin (NCT). (B-C’) (mean ± SEM, n=3). (D-E) as in (B-C) for the indicated cell lines (mean ±SEM, n=2–4). (F) Double immunostaining of endogenous PSEN2 and LAMP1 confirming LE/LYS enrichment for PSEN2 in indicated cell lines. Bar= 10 μm. (G-H) Endogenous PSEN2 co-localizes with LAMP1 in murine primary hippocampal neurons (DIV 7, G) and in brain cerebral cortex area (P10, H). Inset in G: zoomed area. Bar= 10 μm. (H) Merge 2 (subicular area) and 3: respective zoomed area of the square in merge 1 and 2. Merge 1: Bar= 200 μm, merge 2, 3: Bar= 10 μm. (I) Western blot analysis of PSEN dKO MEFs and dKO MEFs stably rescued with GFP-PSEN1 or GFP-PSEN2 demonstrates restored γ-secretase assembly and activity. (J-J’) Quantitative Western blot of cell surface biotinylated GFP-PSEN1 and -PSEN2 shows more GFP-PSEN1 at the cell surface (mean ± SEM, n=4). (K) Co-localization of GFP-PSEN1 (top) and GFP-PSEN2 (bottom) with endogenous LAMP1. Insets and right panel: zoomed areas. Bar=10 μm. (L) Primary hippocampal neurons (DIV7) expressing GFP-PSEN1 (green, top), or GFP-PSEN2 (green, bottom) labeled with Lysotracker red (50 nM). Inset: GFP-PSEN2 co-localizes with Lysotracker. Bar=10 μm. See also Figure S1.
Figure 2:
Figure 2:. Cytosolic N-terminus of PSEN2 is responsible for its localization to LE/LYS.
(A) Scheme of GFP-PSEN1 (blue) and GFP-PSEN2 (orange) WT and hybrids (1 to 5, see supplemental info), with nine transmembrane domains (white squares) and endoproteolytic cleavage site (dotted line). (B) Western blot of dKO MEFs rescued with GFP-PSEN hybrids. All hybrids rescue γ-secretase assembly and activity. (C) Co-localization of GFP-PSEN hybrids with endogenous LAMP1. Right: zoomed area. Bar=10 μm. (C’) Quantification of (C) using Manders’ coefficient (mean ± SEM, n=3, ≥30 cells per experiment).
Figure 3:
Figure 3:. Adaptor complex AP-1 binds the N-terminal conserved E16RTSLM21 motif in PSEN2.
(A) Alignment of human PSEN1 and PSEN2 N-termini (top). PSEN2 N-terminus includes an acidic cluster with a conserved ERTSLM sequence (red box and lower panel) resembling the consensus [D/E]XXXL[L/I/M] and three conserved phosphorylatable serines (red). Scheme shows point mutations used in this study. (B) Two vectors used in Y3H. (C) Y3H shows that PSEN2 tail interacts with AP-1 γ1-σ1A but not with AP-2 αC-σ2 or AP-3 δ-σ3A. This interaction is impaired by combined replacement of Glu16, Leu20 and Met21 for Ala (PSEN2-AxxxAA). Note selective interaction of the control Nef dileucine signal with AP-1 γ1-σ1A, AP-2 αC-σ2 and AP-3 δ-σ3A and not with mismatched combinations of AP subunits. (D) PSEN2 tail-AP-1 γ1-σ1A interaction is impaired by individual Ala substitution in the PSEN2 motif. While the S19A substitution is inconsequential, the phosphorylation-mimicking S19D substitution abolishes interaction. (E) Western blot analysis of pull-downs of rat brain extracts with recombinant GST, GST-N1–81PSEN1 and GST-N1–86PSEN2. (F) Same as in (E) but for single or triple Ala substitutions in the ERTSLM motif (top) and Ser to Ala/Asp mutations in N-terminus (bottom) of GST-N1–86PSEN2. Coomassie staining shows equal loading of GST-fusion proteins. (G-G’) Co-immunoprecipitation of CHAPSO-extracts from dKO MEFs (control) and rescued cells using anti-GFP antibody. Western blot (G, quantified in G’) with anti-AP-1-γ1 shows increased binding to GFP-PSEN2-S19A compared to PSEN2 WT (mean ± SEM n=3, *** p<0.001, *p<0.05). (H) Surface representation of the σ1 subunit (blue) and γ1subunit (green) of AP-1 hemicomplex with the VCDERTSLMS peptide from PSEN2 (gray) in the binding groove of the σ1 subunit. Glu (red) and Leu/Met (purple) interact with the γ1 and σ1 subunit, respectively. The phospho group on Ser19 which disfavors interaction, is marked in yellow/red. (I) Theoretical effect of mutations on the interaction energy between the ‘CDERTSLMS’ motif and the AP-1 hemicomplex calculated using FoldX forcefield. All mutations, except S19A, strongly destabilize interaction (high (>1) positive ΔΔG (kcal.mol-1)). (J) In vitro kinase assays using purified GST-PSEN2 WT and mutants as substrates incubated with CKII, CKI or Aurora A. Top: autoradiograph of phosphorylated GST fusion proteins. Note very low labeling of fusion proteins by CK1 compared to control (Casein). Middle: colloidal staining shows equal loading. Bottom: quantification of 32P incorporation in GST-fusion proteins as a ratio to colloidal gold staining (mean ± SEM n=3, *** p<0.001). See also Figures S2.
Figure 4:
Figure 4:. E16RTSLM21 motif in PSEN2 is sufficient for its LE/LYS localization.
(A) Double immunostaining shows strong overlap of GFP-PSEN2-S19A but not -AxxxAA with LAMP1. Right: zoomed area. Bar=10 μm. (A’) Quantification using Mander’s coefficient (mean ± SEM, n=3, ≥30 cells per experiment). (B-B’) Quantitative Western blot of cell surface biotinylated NCT and PSEN2-CTF for GFP-PSEN2 WT and mutant rescued cells shows low amount of S19A at the cell surface (mean ± SEM, n=4, *p<0.05, ***p<0.001). (C) Triple fluorescent labeling of primary hippocampal neurons (DIV7) shows PSEN1 localization in axons (tau1) and dendrites (MAP2) while PSEN2 (but not PSEN2-AxxxAA) is solely present in dendrites. Bar=10μm. (C’) Polarity index (axonal/dendritic signal) calculated for GFP-PSEN1 (n=28), GFP-PSEN2 (n=31) and GFP-PSEN-AxxxAA (n=22) (mean ± SEM, ***p<0.001). (D) Partial co-localization of GFP-PSEN2-S19A with TGN46. Right: Zoomed area. Bar=10 μm. (E) GFP-PSEN2-S19A co-localizes with endogenous AP-1 (AP1G1) at the TGN and on emanating tubular structures (inset). Bar= 5 μm. SIM image of GFP-PSEN2-WT (F) and -S19A cells (G) co-transfected with LAMP1-mCherry: area indicated by a square is analyzed by CLEM (F’ and G’). G: Golgi; Mit: mitochondria; arrowheads: clathrin coated vesicles; empty arrowhead: endosome with flat clathrin-coated domain; arrows: tubular structures. (F, G) Bar= 10 μm (F,G) and 1 μm (F’, G’). See also Figure S3, Movies S1 and S2.
Figure 5:
Figure 5:. Subcellular localization of γ-secretase regulates substrate accessibility.
(A-A’) Quantitative Western blot of siRNA-treated MNT-1 cells (mean ± SEM, n=3). (B) Transmission EM of WT and PSEN2-siRNA treated MNT-1 cells. I to IV indicate different stages of melanosome maturation. PSEN2 knockdown results in more immature stages. Arrows in insets specify stage II melanosomes containing normal and very thin fibrils in WT (Ctrl), and PSEN2 knockdown cells, respectively. Bar=1μm. (C) Western blot analysis of WT MNT-1 (Ctrl) and single PSEN2 (two clones) and PSEN1 (one clone) KO cells generated using CRISPR/Cas9. (D) Transmission EM of WT (Ctrl) and PSEN2-KO (clone 18) MNT-1 cells. Insets: round shaped unstructured immature melanosomes (arrows) accumulate in PSEN2-KO cells at the expense of mature stage II, III and IV melanosomes. Bar=500nm. (D’) Quantification of (D) as percentage of each compartment relative to total compartments. (E-G) Western blot demonstrating ICD production from endogenous N-cadherin-, APP- and Notch1-CTFs from membrane fractions of dKO MEFs rescued with GFP-PSEN1 or -PSEN2 as indicated. (E’-G’) Quantification of (E-G) (mean ± SEM, n=4–5). (H-I) Western blot of intracellular and secreted A from total lysate (bottom) and conditioned media (top) (quantified in I). (J-K) ELISA of intracellular and extracellular A 40 and 42, including Aβ42/40 (mean ± SEM, n=7). For all graphs: *p<0.05, *p<0.01, ***p<0.001. See also Figure S4.
Figure 6:
Figure 6:. Most intracellular Aβ is generated by PSEN2 γ-secretase.
(A-B) FAD mutations do not affect co-localization of PSEN2 with LAMP1 in LE/LYS. Bottom: zoomed area. Bar=10 μm. (B) Overlap quantified using Mander’s coefficient (mean ± SEM, n=3, ≥30 cells per experiment). (C) Quantification of ICD production from indicated substrates starting from membrane fractions of PSEN2 WT or PSEN2-FAD rescued cell lines (mean ± SEM; n=5). (D) Quantitative Western blot of total secreted and intracellular Aβ from PSEN2-WT and -FAD rescued cells (mean ± SEM; n=6). (E) as in (D) but using ELISA to quantify secreted and intracellular Aβ40 and −42 as well as Aβ42/40 ratios (F) (mean ± SEM; n=6). (G-H) as in (A-B) but for GFP-PSEN1 WT and FAD mutants. (I) as in (C): Note that FAD PSEN1-L166P and G384A are unable to process N-cadherin CTF. (J-L) as in (D-F). PSEN1 mutations most strongly increase intracellular 42/40 ratio with highest ratio for L166P and G384A. (C, D, E, I, J, K) *p<0.05; **p<0.01; ***p<0.001. See also Figures S5.
Figure 7:
Figure 7:. Distinct endosomal transport itineraries of PSEN1 and PSEN2.
PSEN1 (yellow) complexes are sorted from the TGN to the cell surface likely via the Rab11-positive recycling compartments. In contrast, interaction with AP-1 via a conserved ERTSLM-motif allows PSEN2 (red) complexes to be sorted to LE/LYS, probable via early/sorting endosomes. Phosphorylation of Ser19 affects PSEN2 sorting. Mutation to Ala confers a more strict localization in LE/LYS and TGN. Substituting Ser19 to Asp (phosphomimetic) decreases binding and results in a more randomized distribution. Changing critical residues in the motif (AxxxAA) fully prevents AP-1 binding, resulting in “default” sorting of PSEN2/γ-secretase along the PSEN1/γ-secretase transport route (red dashed arrow). LE/LYS Localization of PSEN2/γ-secretase accounts for a major pool of intracellular Aβ, wherein relative Aβ42 levels become strongly increased by FAD mutations.

Comment in

Similar articles

Cited by

References

    1. Acx H, Chavez-Gutierrez L, Serneels L, Lismont S, Benurwar M, Elad N, and De Strooper B (2014). Signature amyloid beta profiles are produced by different gamma-secretase complexes. The Journal of biological chemistry 289, 4346–4355. - PMC - PubMed
    1. Almeida CG, Takahashi RH, and Gouras GK (2006). Beta-amyloid accumulation impairs multivesicular body sorting by inhibiting the ubiquitin-proteasome system. The Journal of neuroscience : the official journal of the Society for Neuroscience 26, 4277–4288. - PMC - PubMed
    1. Bayer TA, and Wirths O (2011). Intraneuronal Abeta as a trigger for neuron loss: can this be translated into human pathology? Biochemical Society transactions 39, 857–861. - PubMed
    1. Bentahir M, Nyabi O, Verhamme J, Tolia A, Horre K, Wiltfang J, Esselmann H, and De Strooper B (2006). Presenilin clinical mutations can affect gamma-secretase activity by different mechanisms. Journal of neurochemistry 96, 732–742. - PubMed
    1. Bonifacino JS (2014). Adaptor proteins involved in polarized sorting. The Journal of cell biology 204, 7–17. - PMC - PubMed

Publication types

MeSH terms