. 2016 Jul 14;166(2):358-368.
doi: 10.1016/j.cell.2016.05.025. Epub 2016 Jun 9.

Enhancer Control of Transcriptional Bursting

Affiliations

Enhancer Control of Transcriptional Bursting

Takashi Fukaya et al. Cell. .

Abstract

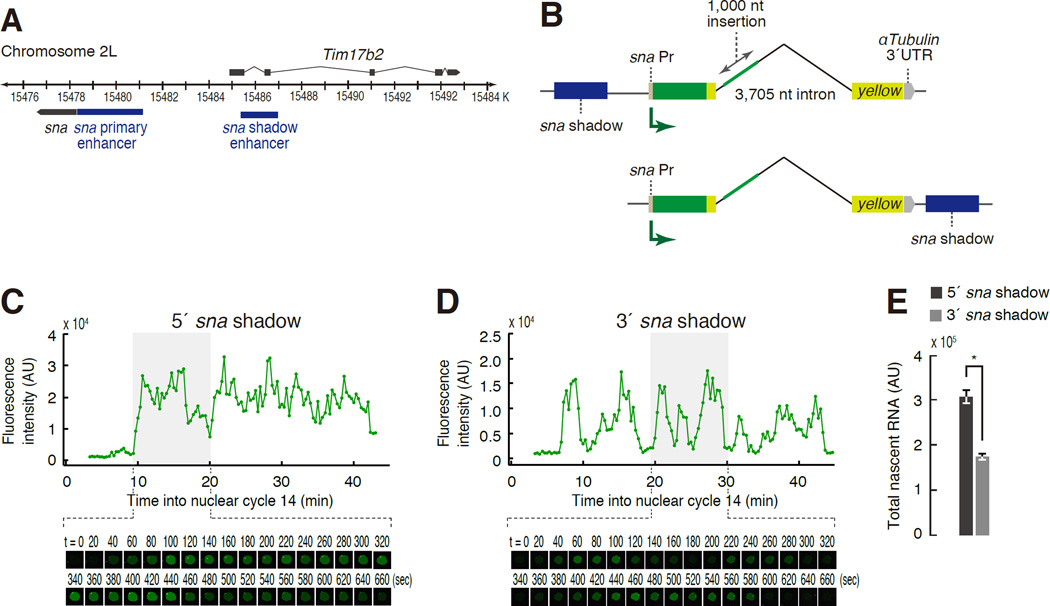
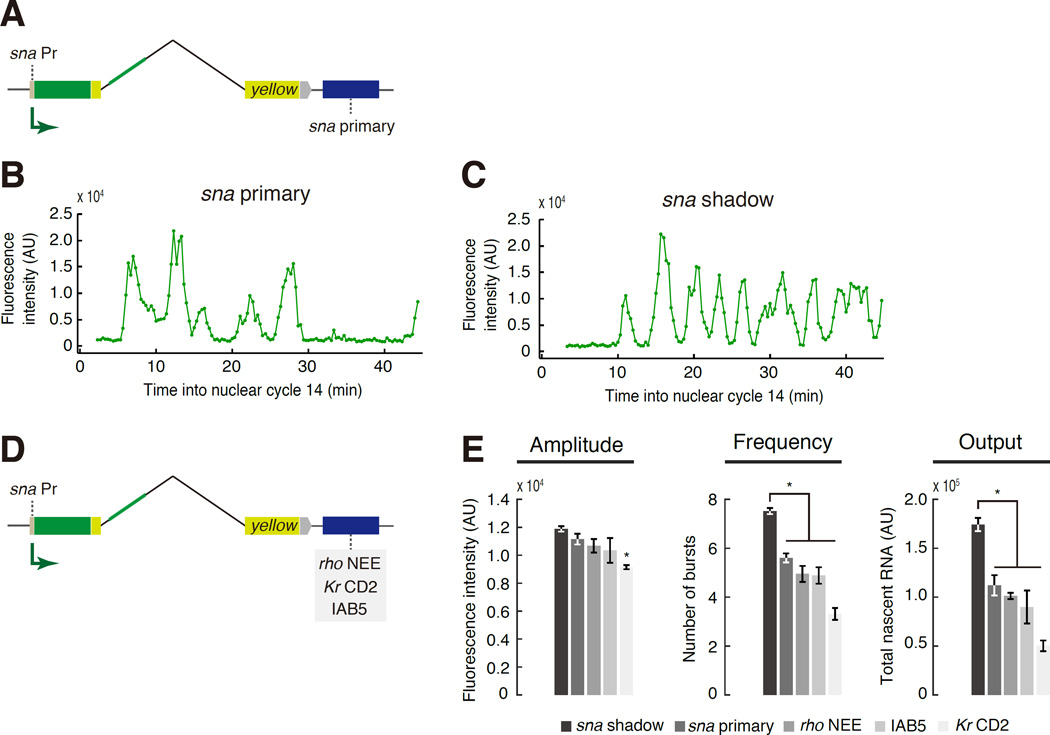
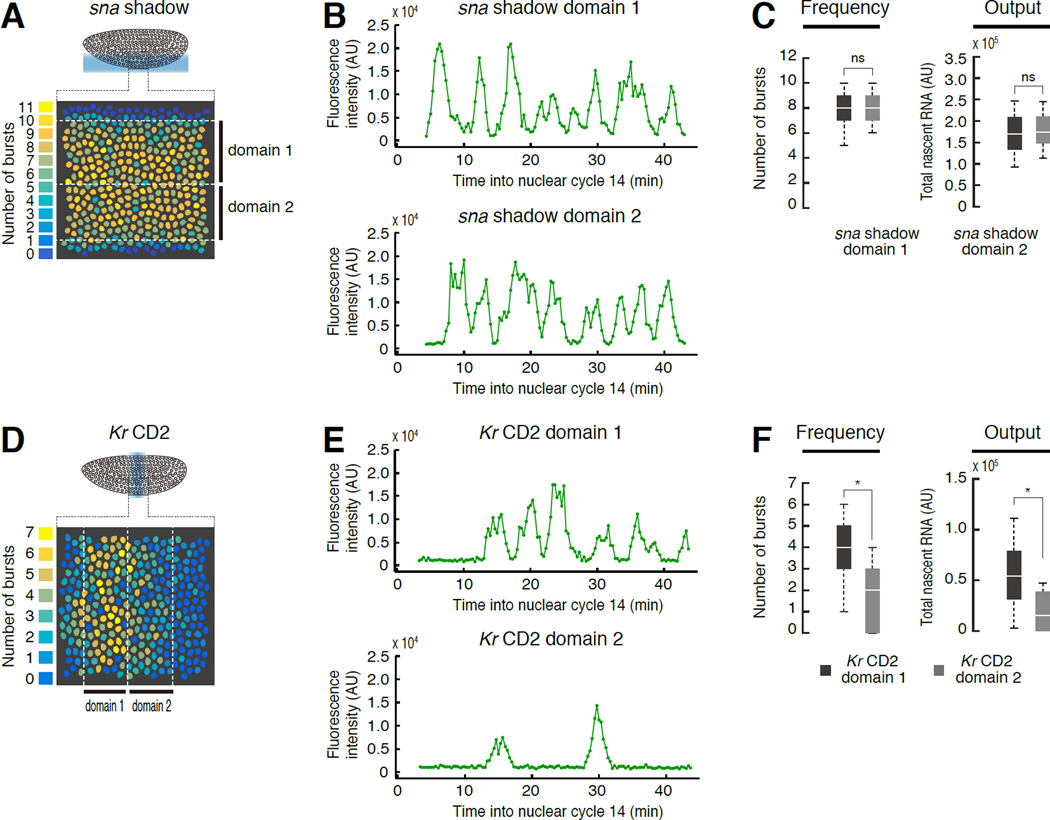
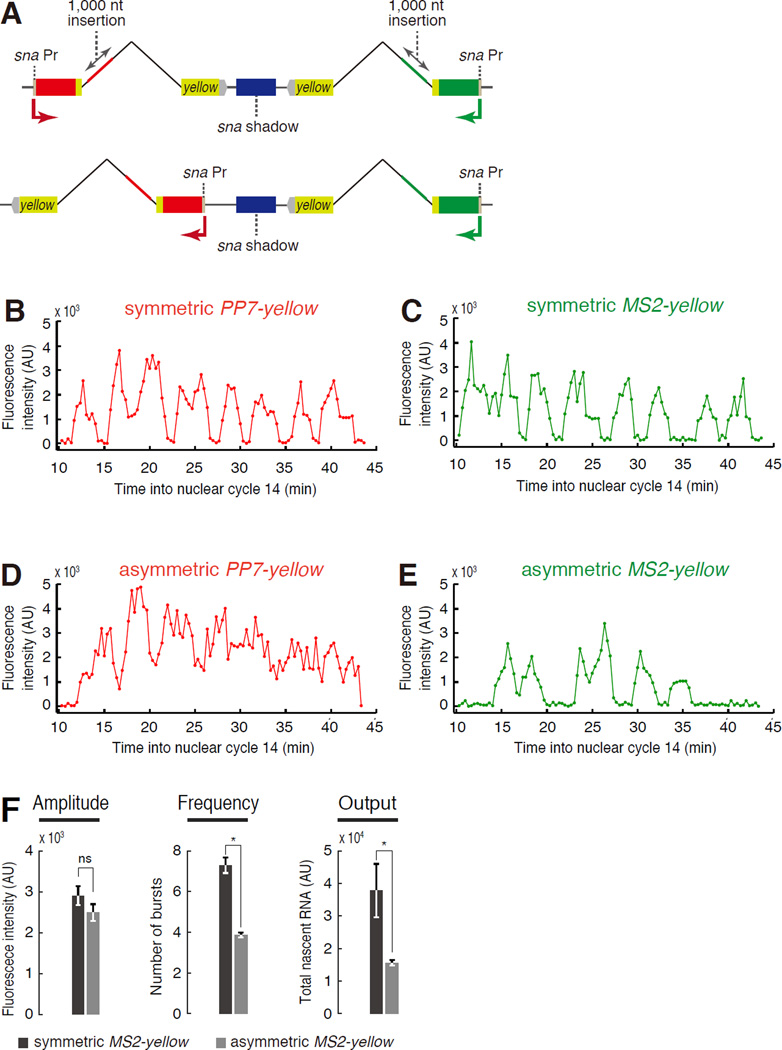
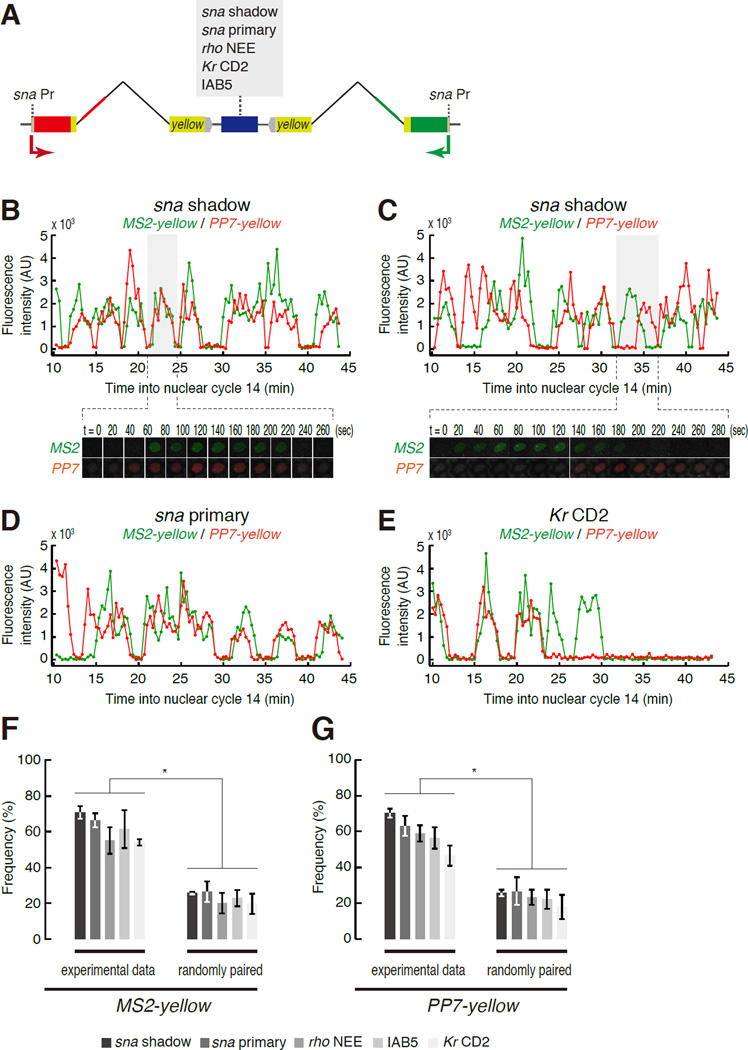
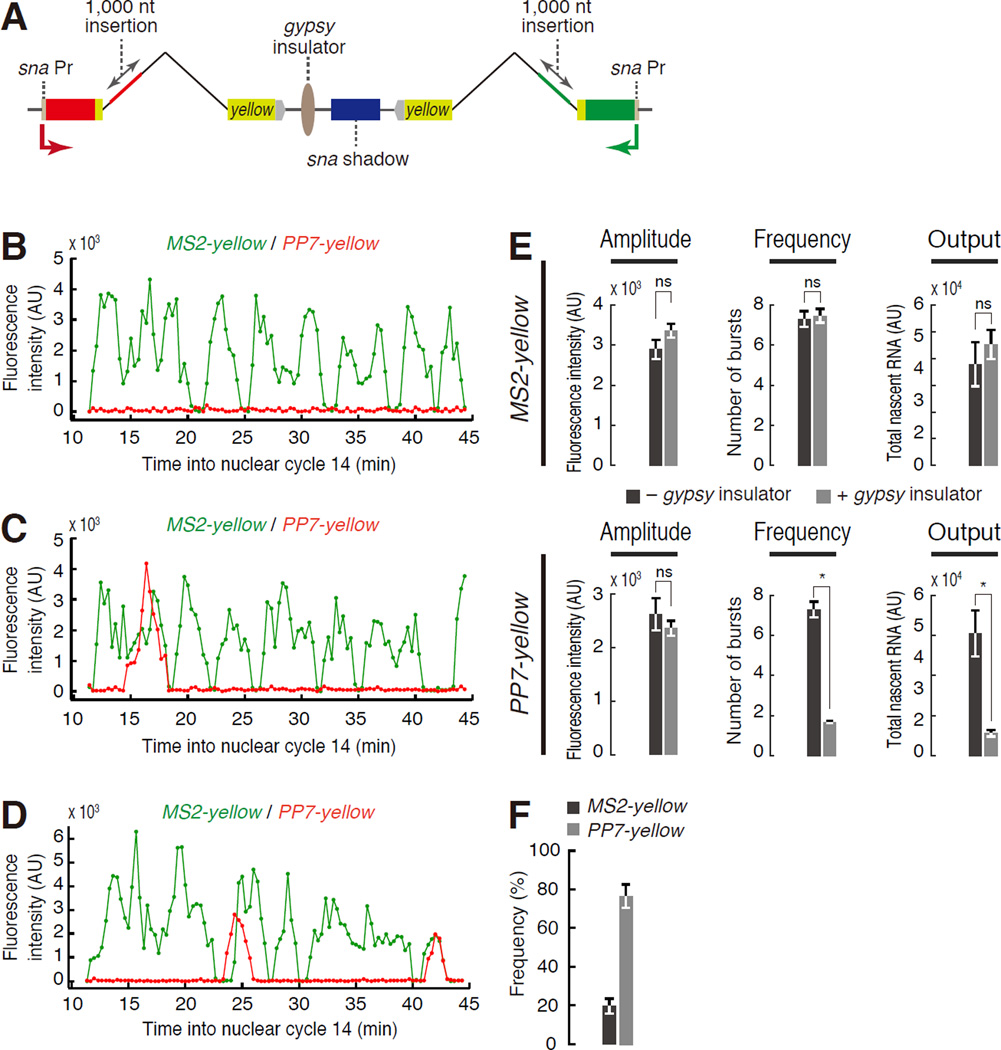
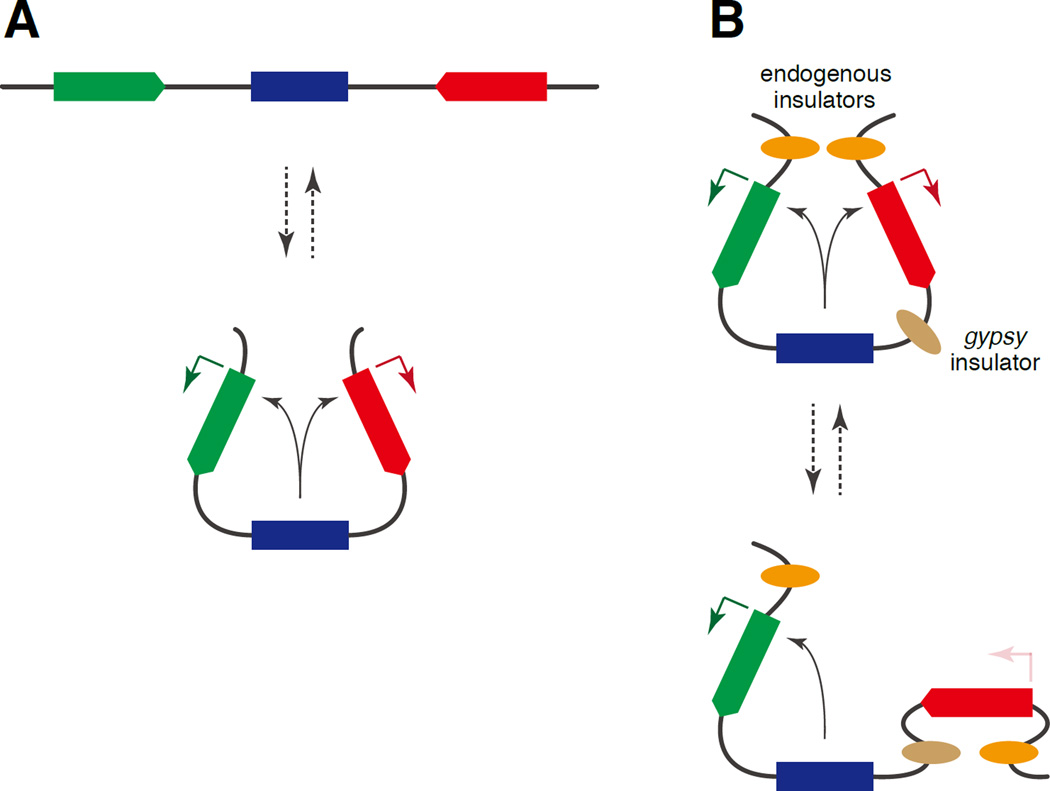
Transcription is episodic, consisting of a series of discontinuous bursts. Using live-imaging methods and quantitative analysis, we examine transcriptional bursting in living Drosophila embryos. Different developmental enhancers positioned downstream of synthetic reporter genes produce transcriptional bursts with similar amplitudes and duration but generate very different bursting frequencies, with strong enhancers producing more bursts than weak enhancers. Insertion of an insulator reduces the number of bursts and the corresponding level of gene expression, suggesting that enhancer regulation of bursting frequency is a key parameter of gene control in development. We also show that linked reporter genes exhibit coordinated bursting profiles when regulated by a shared enhancer, challenging conventional models of enhancer-promoter looping.


Figures

Figure 1
Figure 1. Enhancer location influences transcriptional dynamics
(A) The sna locus contains the proximal primary enhancer adjacent to the promoter, as well as a distal shadow enhancer located in the neighboring Tim17b2 locus. (B) Schematic representation of yellow reporter gene containing the 100 bp minimal sna promoter and 24× MS2 RNA stem loops within the 5´ UTR. 1.5 kb sna shadow enhancer was placed either 1 kb upstream (5´ sna shadow enhancer; top) or 7.5 kb downstream (3´ sna shadow enhancer; bottom) of the promoter. This reporter gene also contains a linked snaPr-PP7-yellow in symmetric location that will be discussed in Figures 4 and 5. (C, D) Representative traces of transcription activity in individual nuclei. Snapshots are taken from the nucleus that was used to measure the corresponding traces. The intensity of green false-color is proportional to the signal strength of the transcription focus at a given time. (E) Average values of total transcripts produced per nucleus. The output was measured by quantifying the area under the curve for individual traces. A total of 614 and 907 nuclei, respectively, were measured from three individual embryos for the reporter genes with 5´ and 3´ sna shadow enhancer. The error bars represent the standard deviation of the mean of three biological replicates. Asterisk indicates p < 0.01. See also Figure S1.
Figure 2
Figure 2. Bursting frequencies correlate with enhancer strength
(A) Schematic representation of MS2-yellow reporter gene containing the 2.8 kb sna primary enhancer. The enhancer is located 7.5 kb downstream of the sna promoter. (B, C) A representative trace of transcription activity of MS2-yellow reporters with sna primary (B) and sna shadow (C) enhancers. (D) Schematic representation of MS2-yellow reporter genes with rho NEE, Kr CD2, and IAB5 enhancers. In all cases, the enhancer is located 7.5 kb downstream of the sna promoter. (E) Average values of amplitude, frequency, and output per nucleus. Totals of 907, 788, 450, 799, 413 nuclei from three independent embryos were analyzed for the reporter genes containing the sna shadow, sna primary, rho NEE, IAB5, and Kr CD2 enhancers, respectively. The error bars represent the standard deviation of the mean of three biological replicates. Output of sna shadow enhancer is the same as the plot in Figure 1E. Asterisk indicates p < 0.01 compared to sna shadow enhancer. (Note that these transgenes also contain a linked snaPr-PP7-yellow reporter gene in symmetric location; see Figure 5). See also Figure S2 and S3.
Figure 3
Figure 3. Differential bursting frequencies of segmentation genes
(A) Distribution of bursting frequencies in transgenic embryo expressing snaPr-MS2-yellow with the 3´ sna shadow enhancer (Figure 1B; bottom). Each nucleus is colored with respect to the total number of transcriptional bursts detected throughout nc 14. The image is oriented with anterior to the left and ventral view facing up. (B) Representative traces of transcription activity in individual nuclei from each domain shown in (A). Each domain spans about half the total limits of the sna expression pattern. (C) Boxplots showing the distribution of burst frequencies and output per nucleus in each domain shown in (A). 149 and 152 nuclei were analyzed in domains 1 and 2, respectively. The box indicates the lower (25 %) and upper (75 %) quantile and the solid line indicates the median. Whiskers extend to 10 th and 90 th percentile of each distribution. (D) Distribution of bursting frequencies in the embryo expressing snaPr-MS2-yellow with the Kr CD2 enhancer (Figure 2D). The image is oriented with anterior to the left and dorsal up. (E) Representative traces of transcription activity in individual nuclei from each domain shown in (D). Each domain spans about half the total limits of the Kr expression pattern. (F) Boxplots showing the distribution of burst frequencies and output in each domain shown in (D). 110 and 114 nuclei were analyzed in domains 1 and 2, respectively. The box indicates the lower (25 %) and upper (75 %) quantile and the solid line indicates the median. Whiskers extend to 10 th and 90 th percentile of each distribution. Asterisk indicates p < 0.01. See also Figure S4 and S5.
Figure 4
Figure 4. Promoter competition diminishes bursting frequencies
(A) Schematic representation of snaPr-MS2-yellow and snaPr-PP7-yellow reporter genes with the sna shadow enhancer. snaPr-PP7-yellow is located either 7.6 kb (symmetric; top) or 1 kb (asymmetric; bottom) from the enhancer. In both cases, the shared enhancer is located 7.5 kb from the snaPr-MS2-yellow reporter. (B, C) Representative traces of transcription activity of PP7-yellow and MS2-yellow in symmetric configuration. (D, E) Representative traces of transcription activity of PP7-yellow and MS2-yellow in asymmetric configuration (e.g., the shared enhancer is located near the PP7-yellow reporter). (F) Average amplitude, frequency and output per nucleus in the symmetric and the asymmetric reporter constructs. Totals of 604 and 332 nuclei from three independent embryos were analyzed for MS2-yellow signals in symmetric and asymmetric configurations, respectively The error bars represent the standard deviation of the mean of three biological replicates. Asterisk indicates p < 0.01.
Figure 5
Figure 5. Coordinated transcriptional bursts by a shared enhancer
(A) Schematic representation of the symmetric snaPr-MS2-yellow and snaPr-PP7-yellow reporters with different enhancers (sna shadow, sna primary, rho NEE, Kr CD2, and IAB5). (B, C) Representative traces of transcription activity in the reporter gene with the sna shadow enhancer. Snapshots are taken from the nucleus that corresponds to the indicated traces. The intensity of green (MS2-yellow) and red (PP7-yellow) false-coloring is proportional to the signal strength of transcription focus at a given time. (D, E) Representative traces of transcription activity of MS2-yellow and PP7-yellow reporters with sna primary (D) and Kr CD2 enhancers (E). (F, G; left) Frequency of the coordinate transcriptional burst among total MS2-yellow (F) and PP7-yellow bursts (G). The error bars represent the standard deviation of the mean of three biological replicates. 613, 502, 382, 369, and 803 nuclei were analyzed for sna shadow, sna primary, IAB5, rho NEE, and Kr CD2 enhancers, respectively. (F, G; right) Frequency of coordinate bursts among randomly paired traces. From a pool of MS2 and PP7 traces in a given embryo, traces with comparable bursting frequency were randomly paired and the number of coordinate bursts was counted. The error bars represent the standard deviation of the mean of three biological replicates. Totals of 613, 477, 310, 249 and 365 nuclei were analyzed for sna shadow, sna primary, IAB5, rho NEE, and Kr CD2 enhancers, respectively. Asterisk indicates p < 0.01. See also Figure S6 and S7.
Figure 6
Figure 6. The gypsy insulator alters bursting frequencies
(A) Schematic representation of the symmetric snaPr-MS2-yellow and snaPr-PP7-yellow reporter genes with the gypsy insulator inserted between the sna shadow enhancer and snaPr-PP7-yellow. (B–D) Representative traces of transcription activity of MS2-yellow and PP7-yellow. (E) Average amplitude, frequency and output per nucleus in the reporter constructs with or without the insulator. Total of 604 and 579 nuclei from three independent embryos were analyzed for the reporters without and with the insulator, respectively. The plot shown in Figure 4F (symmetric MS2-yellow) was used for the reporter without the insulator. The error bars represent the standard deviation of the mean of three biological replicates. Asterisk indicates p < 0.01. (F) Frequency of coordinate transcriptional bursts among total MS2-yellow and PP7-yellow bursts. The error bars represent the standard deviation of the mean of three biological replicates and 579 nuclei were analyzed.
Figure 7
Figure 7. A model for dynamic transitions in chromosome topology
(A) A model for the coordinated activation of two-linked reporter genes by a shared enhancer. A higher order chromosomal loop domain positions the shared enhancer near both target promoters. (B) We propose that the gypsy insulator blocks enhancer-promoter interactions by forming a chromosomal loop domain by pairing with a nearby endogenous insulator (bottom). The occasional coordinated bursts that are observed can be explained by dynamic conformational changes in chromosomal loop domains.

Comment in

Similar articles

Cited by

References

    1. Ardehali MB, Lis JT. Tracking rates of transcription and splicing in vivo. Nat Struct Mol Biol. 2009;16:1123–1124. - PubMed
    1. Bertrand E, Chartrand P, Schaefer M, Shenoy SM, Singer RH, Long RM. Localization of ASH1 mRNA particles in living yeast. Mol Cell. 1998;2:437–445. - PubMed
    1. Boettiger AN, Levine M. Rapid transcription fosters coordinate snail expression in the Drosophila embryo. Cell reports. 2013;3:8–15. - PMC - PubMed
    1. Bothma JP, Garcia HG, Esposito E, Schlissel G, Gregor T, Levine M. Dynamic regulation of eve stripe 2 expression reveals transcriptional bursts in living Drosophila embryos. Proc Natl Acad Sci U S A. 2014;111:10598–10603. - PMC - PubMed
    1. Bothma JP, Garcia HG, Ng S, Perry MW, Gregor T, Levine M. Enhancer additivity and non-additivity are determined by enhancer strength in the Drosophila embryo. Elife. 2015;4 - PMC - PubMed

Publication types

Substances