

The Shape of the Glucose Response Curve During an Oral Glucose Tolerance Test Heralds Biomarkers of Type 2 Diabetes Risk in Obese Youth
- PMID: 27293201
- PMCID: PMC4955931
- DOI: 10.2337/dc16-0352
The Shape of the Glucose Response Curve During an Oral Glucose Tolerance Test Heralds Biomarkers of Type 2 Diabetes Risk in Obese Youth
Abstract
Objective: The shape of the glucose response curve during an oral glucose tolerance test (OGTT), monophasic versus biphasic, identifies physiologically distinct groups of individuals with differences in insulin secretion and sensitivity. We aimed to verify the value of the OGTT-glucose response curve against more sensitive clamp-measured biomarkers of type 2 diabetes risk, and to examine incretin/pancreatic hormones and free fatty acid associations in these curve phenotypes in obese adolescents without diabetes.
Research design and methods: A total of 277 obese adolescents without diabetes completed a 2-h OGTT and were categorized to either a monophasic or a biphasic group. Body composition, abdominal adipose tissue, OGTT-based metabolic parameters, and incretin/pancreatic hormone levels were examined. A subset of 106 participants had both hyperinsulinemic-euglycemic and hyperglycemic clamps to measure in vivo insulin sensitivity, insulin secretion, and β-cell function relative to insulin sensitivity.
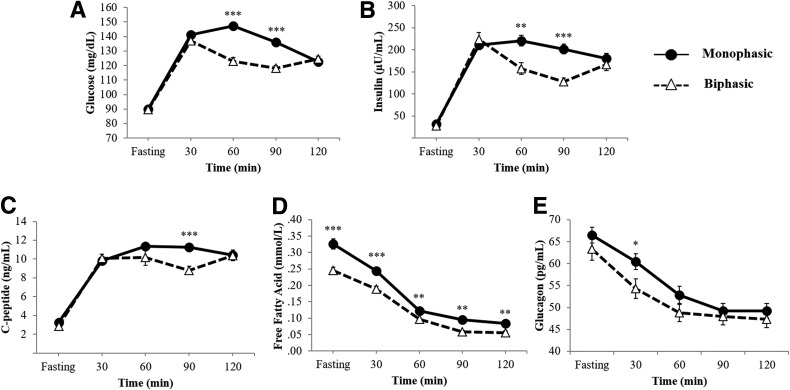
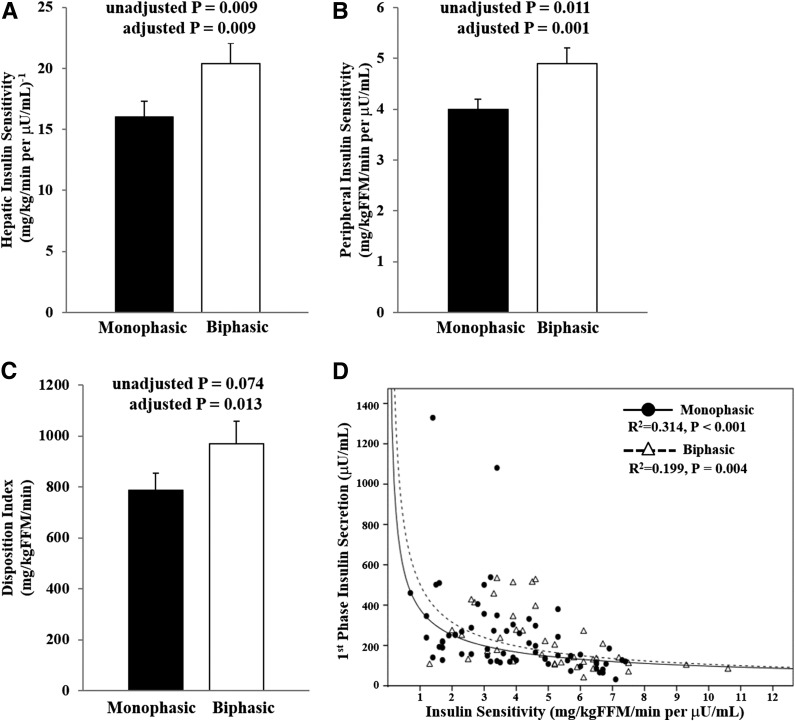
Results: Despite similar fasting and 2-h glucose and insulin concentrations, the monophasic group had significantly higher glucose, insulin, C-peptide, and free fatty acid OGTT areas under the curve compared with the biphasic group, with no differences in levels of glucagon, total glucagon-like peptide 1, glucose-dependent insulinotropic polypeptide, and pancreatic polypeptide. Furthermore, the monophasic group had significantly lower in vivo hepatic and peripheral insulin sensitivity, lack of compensatory first and second phase insulin secretion, and impaired β-cell function relative to insulin sensitivity.
Conclusions: In obese youth without diabetes, the risk imparted by the monophasic glucose curve compared with biphasic glucose curve, independent of fasting and 2-h glucose and insulin concentrations, is reflected in lower insulin sensitivity and poorer β-cell function, which are two major pathophysiological biomarkers of type 2 diabetes in youth.
© 2016 by the American Diabetes Association. Readers may use this article as long as the work is properly cited, the use is educational and not for profit, and the work is not altered.
Figures
References
-
- American Diabetes Association Diagnosis and classification of diabetes mellitus. Diabetes Care 2014;37(Suppl. 1):S81–S90 - PubMed
-
- Stern MP, Williams K, Haffner SM. Identification of persons at high risk for type 2 diabetes mellitus: do we need the oral glucose tolerance test? Ann Intern Med 2002;136:575–581 - PubMed
-
- Reinehr T, Wabitsch M, Kleber M, de Sousa G, Denzer C, Toschke AM. Parental diabetes, pubertal stage, and extreme obesity are the main risk factors for prediabetes in children and adolescents: a simple risk score to identify children at risk for prediabetes. Pediatr Diabetes 2009;10:395–400 - PubMed
-
- Tschritter O, Fritsche A, Shirkavand F, Machicao F, Häring H, Stumvoll M. Assessing the shape of the glucose curve during an oral glucose tolerance test. Diabetes Care 2003;26:1026–1033 - PubMed
-
- Abdul-Ghani MA, Lyssenko V, Tuomi T, Defronzo RA, Groop L. The shape of plasma glucose concentration curve during OGTT predicts future risk of type 2 diabetes. Diabetes Metab Res Rev 2010;26:280–286 - PubMed
MeSH terms
Substances
Grants and funding
LinkOut - more resources
Full Text Sources
Other Literature Sources
Medical
