. 2015:9:563-571.
doi: 10.1038/nphoton.2015.140. Epub 2015 Aug 27.

Guidestar-assisted wavefront-shaping methods for focusing light into biological tissue

Affiliations

Guidestar-assisted wavefront-shaping methods for focusing light into biological tissue

Roarke Horstmeyer et al. Nat Photonics. 2015.

Abstract

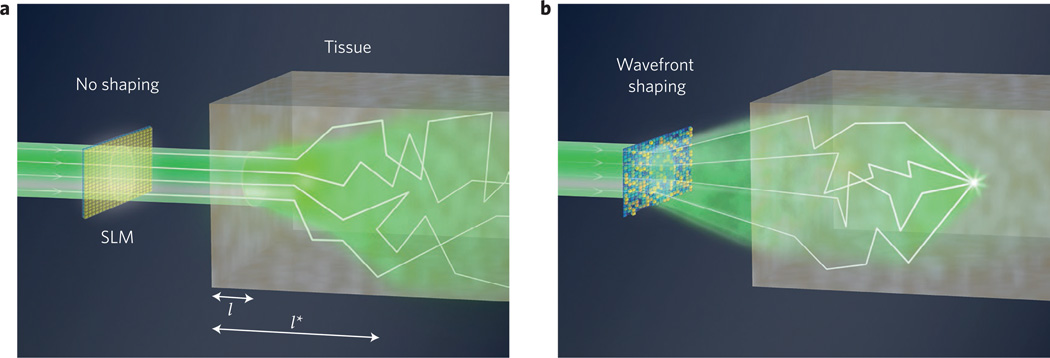
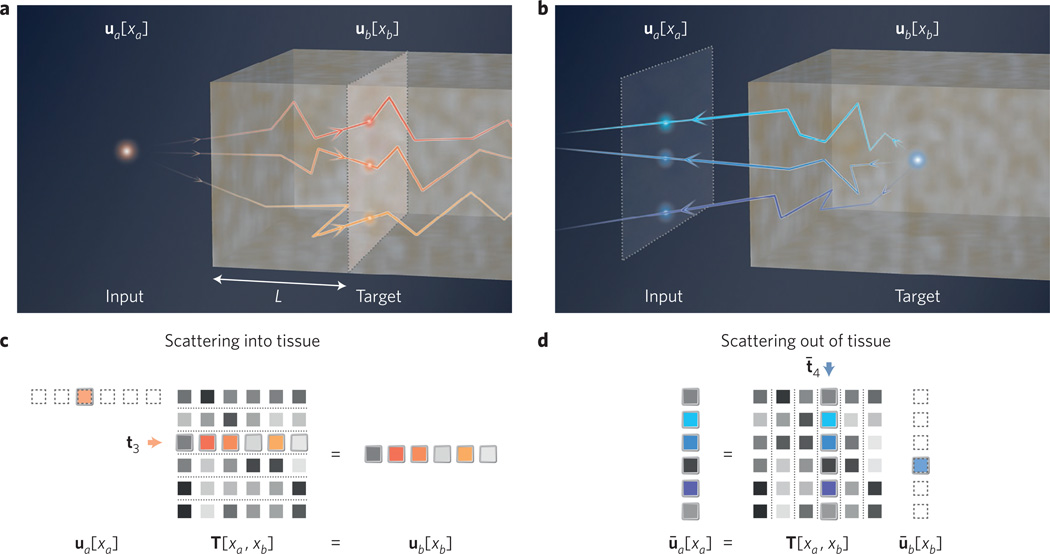
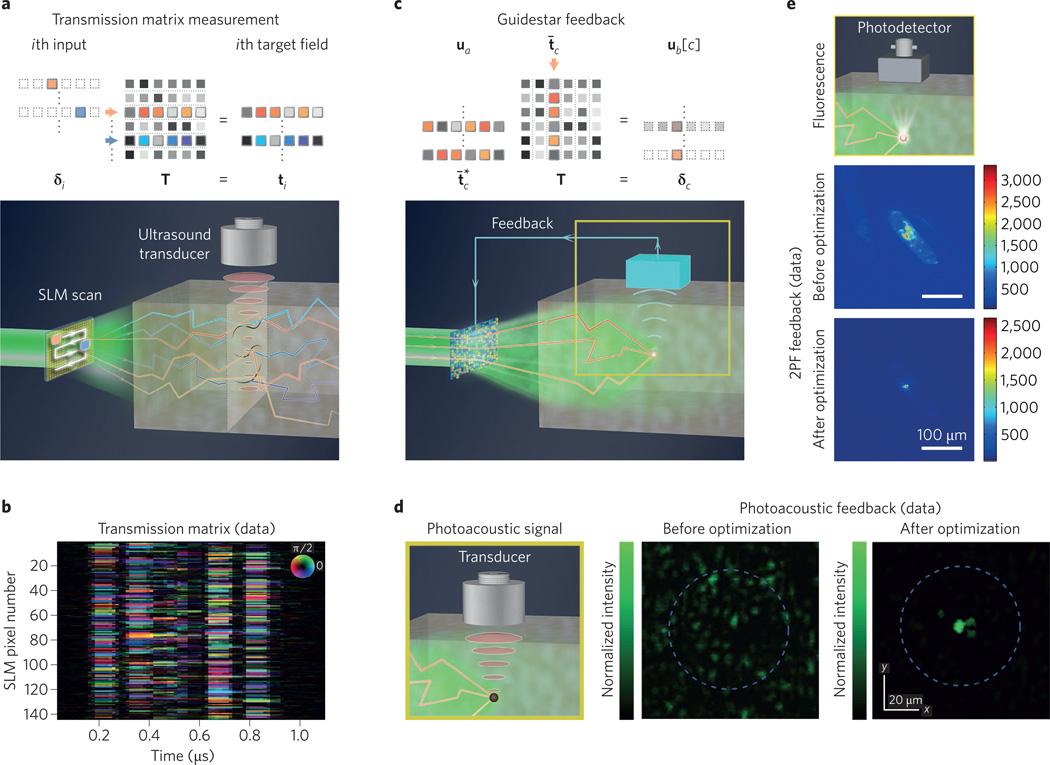
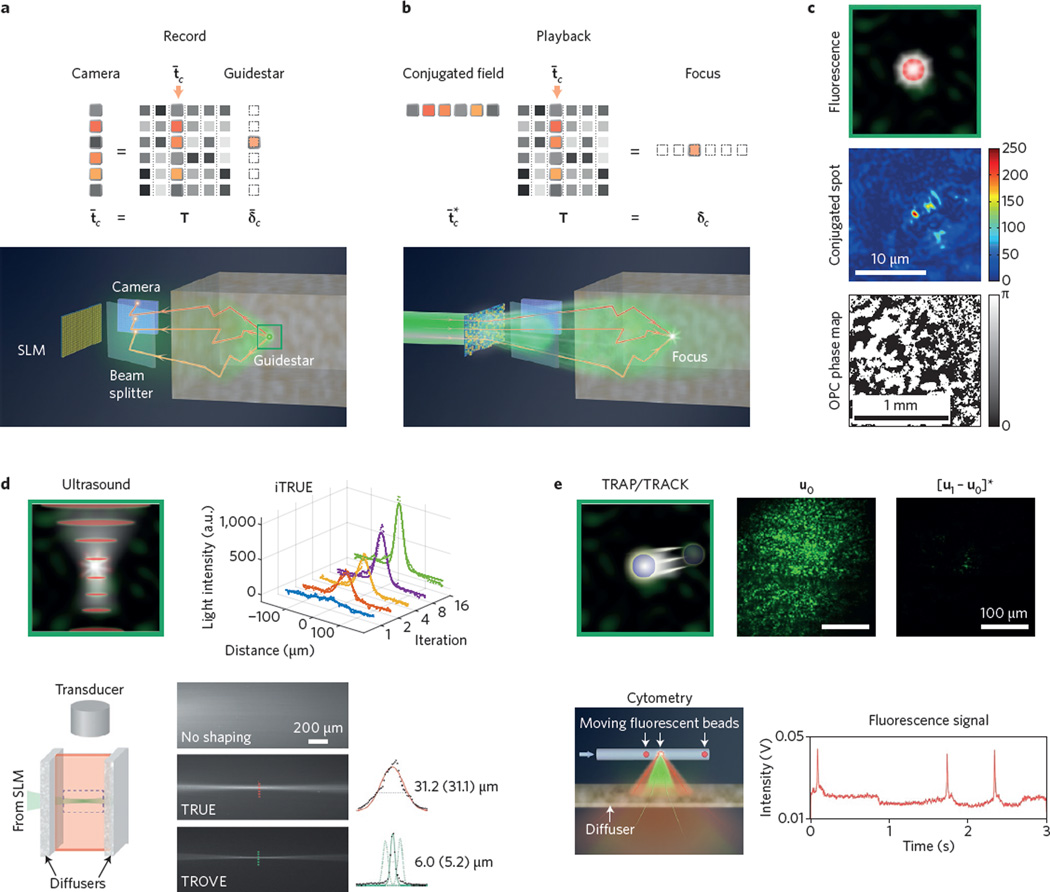
In the field of biomedical optics, optical scattering has traditionally limited the range of imaging within tissue to a depth of one millimetre. A recently developed class of wavefront-shaping techniques now aims to overcome this limit and achieve diffraction-limited control of light beyond one centimetre. By manipulating the spatial profile of an optical field before it enters a scattering medium, it is possible to create a micrometre-scale focal spot deep within tissue. To successfully operate in vivo, these wavefront-shaping techniques typically require feedback from within the biological sample. This Review summarizes recently developed 'guidestar' mechanisms that provide feedback for intra-tissue focusing. Potential applications of guidestar-assisted focusing include optogenetic control over neurons, targeted photodynamic therapy and deep tissue imaging.


Figures

Figure 1
Figure 1. Principle of wavefront shaping
a, An unmodified coherent beam of light travels one mean free path (l) with minimal scattering into tissue. A fraction of beam directionality is preserved up to the transport mean free path length, l*. b, By wavefront-shaping the incident field with an SLM, it is possible to focus within tissue beyond l*.
Figure 2
Figure 2. Matrix model of scattering in tissue
a, Forward optical scattering into tissue (distance L, input to target plane). b, Reverse optical scattering out of tissue (target to input plane). c, Transmission matrix model for forward scattering. A discrete input point source at position 3 sets ua[xa] = δ3, the third unit vector. The target field is then t3, the third transmission matrix row. d, Matrix model for scattering from an embedded guidestar point, which sets ūb[xb] = δ̄4 (column vector). Assuming time-reversal symmetry, the input plane field becomes 4, the fourth transmission matrix column.
Figure 3
Figure 3. Feedback guidestars
a, Measuring the optical transmission matrix. Rows of T are sampled by scanning one transparent pixel across an input SLM and detecting each target field. From within tissue, an external transducer obtains indirect measurements via the photo-acoustic effect. b, Compiled together, these photo-acoustic measurements form an optical transmission matrix. c, Feedback guidestar matrix model, with measurements from one discrete location within tissue, ub[3]. d, Photo-acoustic feedback measured via an ultrasound transducer optimizes light delivery to a tight focus. e, Fluorescence feedback, such as two-photon fluorescence (2PF). After optimization, 2PF feedback focuses light through L = 1 mm of brain tissue. Figure reproduced with permission from: e, ref. , OSA.
Figure 4
Figure 4. Conjugation guidestars
a, Matrix model and set-up for detecting an embedded guidestar field. Light from target field spot δ̄3 forms the speckle field 3 at the input plane camera. b, Matrix model and set-up for conjugation guidestar focusing. SLM-shaping an incident wavefront into conjugate field t¯3* refocuses to δ3. c, Fluorescent conjugation guidestar experiment (0.2 µm bead), with resulting focus and conjugate phase map. d, Ultrasound conjugation guidestar experiments. iTRUE sharpens the conjugated spot size by a factor of three. TROVE reduces the focal spot width from 31 µm to 5 µm. e, Kinematic target conjugation guidestar experiments (TRAP/TRACK). The resulting focus enables particle counting. Figure reproduced with permission from: c, ref. , AIP; e, ref. , OSA.
Figure 5
Figure 5. Tissue motion dims an OPC focus
a, Diagram of OPC decorrelation experiment, where wavefront shaping forms a tight focus through pinched, in vivo mouse tissue. b, Focusing light through partially immobilized dorsal skin. Both the speckle autocorrelation (g2(t), black) and OPC focal spot intensity (F(t), red) decay in magnitude over the course of several seconds, with fitted curves. c, In unconstrained skin, decorrelation occurs on a much faster (sub-second) timescale. Figure reproduced with permission from ref. , OSA.

References

    1. Huang Z. A review of progress in clinical photodynamic therapy. Technol. Cancer Res. T. 2005;4:283–293. - PMC - PubMed
    1. Ellis-Davies GCR. Caged compounds: photorelease technology for control of cellular chemistry and physiology. Nature Methods. 2007;4:619–628. - PMC - PubMed
    1. Zhang F, et al. Optogenetic interrogation of neural circuits: technology for probing mammalian brain structures. Nature Protoc. 2010;5:439–456. - PMC - PubMed
    1. Lichtman JW, Conchello JA. Fluorescence microscopy. Nature Methods. 2005;2:910–919. - PubMed
    1. Thompson MA, Lew MD, Moerner WE. Extending microscopic resolution with single-molecule imaging and active control. Annu. Rev. Biophys. 2012;41:321–342. - PubMed