Review
. 2016 Jun;8(6):1356-65.
doi: 10.21037/jtd.2016.04.55.

Lung B-line artefacts and their use

Affiliations
Review

Lung B-line artefacts and their use

Christoph F Dietrich et al. J Thorac Dis. 2016 Jun.

Abstract

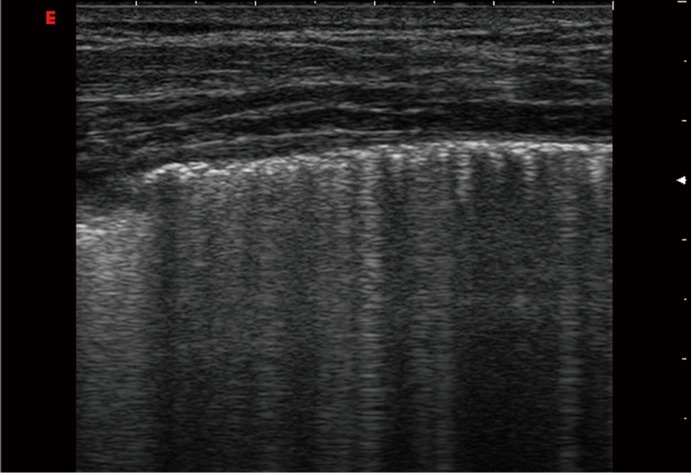
Background: The analysis of lung artefacts has gained increasing importance as markers of lung pathology. B-line artefact (BLA), caused by a reverberation phenomenon, is the most important lung artefact. In this review, we discuss the current role of BLA in pneumology and explore open questions of the published consensus.

Methods: We summarized current literature about BLA. Also, we presented observations on healthy subjects and patients with interstitial syndrome (pulmonary fibrosis and edema), to investigate technical factors influencing BLA visualization.

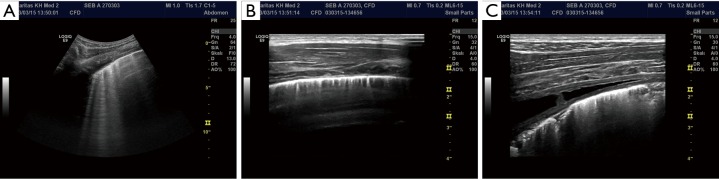
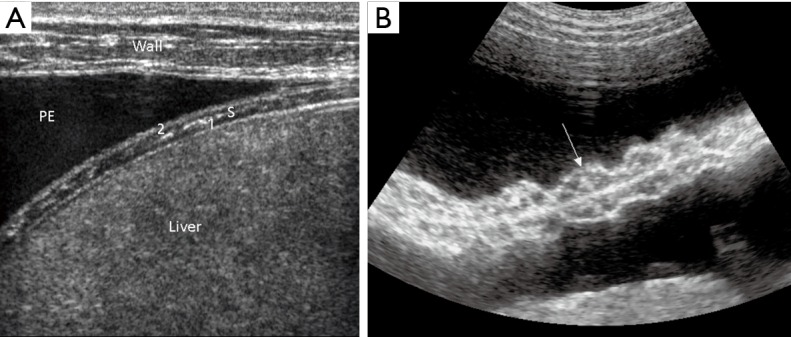
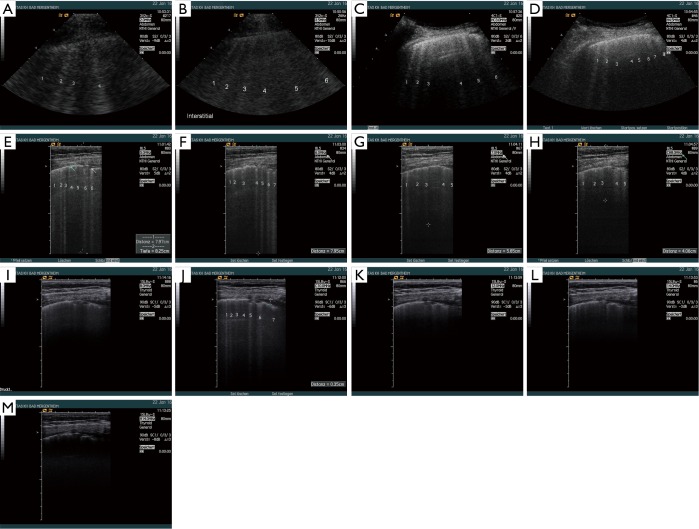
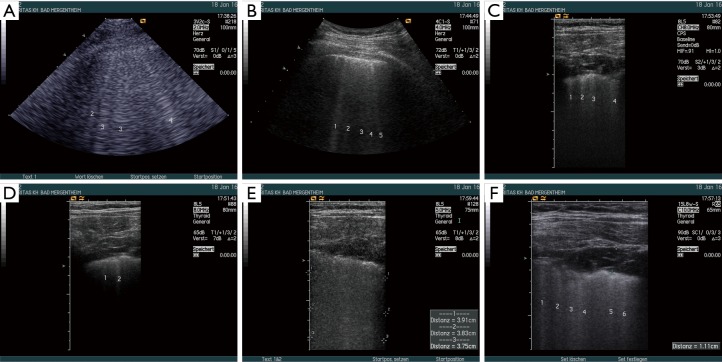
Results: BLA imaging is influenced by more factors than recently assumed. When multiple BLA is visualized in the lung, they represent a sign of increased density due to the loss of aeration in the lung periphery. This condition may indicate different diseases including cardiogenic pulmonary edema, diffuse or focal interstitial lung diseases (ILD), infections and acute respiratory distress syndrome (ARDS). Correct interpretation of BLA in lung ultrasound is strongly influenced by associated sonographic signs and careful integration of all relevant clinical information.

Conclusions: BLA is useful to monitor clinical response, and may become crucial in directing the diagnostic process. Further research is warranted to clarify technical adjustments, different probe and machine factors that influence the visualization of BLA.

Keywords: Guidelines; atelectasis; consolidations; interstitial syndrome; malignancies; pleural effusion (PE); pneumonia; pulmonary thromboembolism.


Conflict of interest statement

Conflicts of Interest: The authors have no conflicts of interest to declare.

Figures

Figure 1
Figure 1
Pneumonia. The value of direct sonographic signs is shown in a young boy with pneumonia. The infiltration resembles the liver (so-called hepatisation, right side of the image). Small abscesses can be identified using contrast enhanced ultrasound (CEUS) (left side, non-enhancing areas).
Figure 2
Figure 2
Pneumonia. The figure illustrates the need for a sequential approach for obtaining all the imaging information available. The value of indirect sonographic signs is shown in the same young boy with pneumonia as described in Figure 1. The overview with a curved array transducer shows BLA to a depth of 12 cm. A more detailed view with a high frequency transducer shows artifacts similar to BLA with much less depth penetration and additionally ALA. Examination with the same high frequency transducer then focuses on the direct ultrasound findings including pleural effusion, pleural thickening of the parietal and visceral pleura subpleural consolidations and additional the accompanying artefacts. BLA, B-line artifact; ALA, A-line artifact.
Figure 3
Figure 3
The anatomy of the parietal pleura and diaphragm is shown in a patient with a pleural effusion (PE). Note the thoracic wall (wall), two muscle layers of the diaphragm [1,2] next to the liver, separated by a fibrous septum (S) (A). The parts of the diaphragm are displayed using a curved array transducer (B, arrow).
Figure 4
Figure 4
The influence of ultrasound transducers and transducer frequency on BLA was examined in a patient with rheumatoid arthritis and lung fibrosis being treated with methotrexate. The examinations were performed using Acuson Sequoia with different multifrequency transducers, 3V2c-S (cardiac), 4C1-S (curved array abdominal), 8L5 (linear), 15L8w-S (linear), using tissue equalisation modus (TEQ) for all sequences. The sequences allow comparison of findings using these different techniques. The fibrotic changes of the pleura could be delineated only using high frequency transducers. Influencing factors examined were the transducer itself, the frequency used, harmonic imaging (HI), depth penetration, focus zone, location, and others (not shown). Both, 3V2c-S [2 MHz (A) and 3.5 MHz (B)] and 4C1-S [3 MHz (C) and 4.5 MHz (D)] showed multiple BLA indicating typical signs of lung fibrosis. The size, shape, depth penetration and other features were somewhat comparable similar to the findings with the 8L5 transducer examined with 5 (E), 6 (F), 7 (G), and 8 MHz (H). The higher the frequency, the lower the penetration. The 15L8w-S transducer with 8, 10, 12 and 14.0 MHz without and with HI revealed significant lower depth penetration and different amounts of BLA (I-M). Less BLA was observed in the higher frequencies. The figures illustrate that high frequency transducer information on direct pleura findings is important for correct interpretation since pleural irregularities, subpleural consolidation and the very small amount of pleural effusion could only be seen using high frequency transducers. BLA, B-line artifact.
Figure 5
Figure 5
The influence of ultrasound transducers and transducer frequency on BLA visualization was examined in a patient with mixed lung fibrosis and edema and focal pleural irregularities. The examinations were performed using Acuson Sequoia with different multifrequency transducers, 3V2c-S (cardiac), 4C1-S (curved array abdominal), 8L5 (linear), 15L8w-S (linear). The images demonstrate that the focal pleural irregularity was only detected using the high frequency probes, which might influence the imaging characteristics and accompanying signs in BLA patterns. The sequence demonstrates that not all transducers show the same findings. Influencing factors were the transducer itself, frequency used, harmonic imaging (HI), depth penetration, focus zone. The 3V2c-S (2 MHz) (A) and 4C1-S (4 MHz) (B) transducers showed multiple BLA indicating both fibrosis and edema. The amount of BLA and the surrounding artefacts were different. Multiple BLA were detected using 8.0 MHz with harmonic imaging (C) and less without harmonic (D). The “sound of lung water” (pulmonary edema) is best shown by 8L5 using 5.0 MHz (E). The 15L8w-S transducer revealed multiple BLA with 10.0 MHz (F). BLA, B-line artifact.
Figure 6
Figure 6
Sarcoidosis. A 26-year-old man got a cold by biking. Dry cough, left sided pleuritic pain and dry rales on auscultation was observed. Ultrasound shows an interrupted visceral pleura reflex with small subpleural consolidations and multiple irregular BLA. Extrapulmonary manifestations of sarcoidosis are often observed. BLA, B-line artifact.

Similar articles

Cited by

References

    1. Volpicelli G, Elbarbary M, Blaivas M, et al. International evidence-based recommendations for point-of-care lung ultrasound. Intensive Care Med 2012;38:577-91. 10.1007/s00134-012-2513-4 - DOI - PubMed
    1. Volpicelli G. Lung sonography. J Ultrasound Med 2013;32:165-71. - PubMed
    1. Dietrich CF, Gebhard Mathis G, Cui XW, et al. Ultrasound of the pleurae and lungs. Ultrasound Med Biol 2015;41:351-65. 10.1016/j.ultrasmedbio.2014.10.002 - DOI - PubMed
    1. Mathis G. Why look for artifacts alone when the original is visible? Chest 2010;137:233; author reply 233-4. 10.1378/chest.08-2601 - DOI - PubMed
    1. Gargani L, Pang PS, Frassi F, et al. Persistent pulmonary congestion before discharge predicts rehospitalization in heart failure: a lung ultrasound study. Cardiovasc Ultrasound 2015;13:40. 10.1186/s12947-015-0033-4 - DOI - PMC - PubMed

LinkOut - more resources