. 2016:2016:3137010.
doi: 10.1155/2016/3137010. Epub 2016 May 17.

Para-Phenylenediamine Induces Apoptotic Death of Melanoma Cells and Reduces Melanoma Tumour Growth in Mice

Affiliations

Para-Phenylenediamine Induces Apoptotic Death of Melanoma Cells and Reduces Melanoma Tumour Growth in Mice

Debajit Bhowmick et al. Biochem Res Int. 2016.

Abstract

Melanoma is one of the most aggressive forms of cancer, usually resistant to standard chemotherapeutics. Despite a huge number of clinical trials, any success to find a chemotherapeutic agent that can effectively destroy melanoma is yet to be achieved. Para-phenylenediamine (p-PD) in the hair dyes is reported to purely serve as an external dyeing agent. Very little is known about whether p-PD has any effect on the melanin producing cells. We have demonstrated p-PD mediated apoptotic death of both human and mouse melanoma cells in vitro. Mouse melanoma tumour growth was also arrested by the apoptotic activity of intraperitoneal administration of p-PD with almost no side effects. This apoptosis is shown to occur primarily via loss of mitochondrial membrane potential (MMP), generation of reactive oxygen species (ROS), and caspase 8 activation. p-PD mediated apoptosis was also confirmed by the increase in sub-G0/G1 cell number. Thus, our experimental observation suggests that p-PD can be a potential less expensive candidate to be developed as a chemotherapeutic agent for melanoma.


Figures

Figure 1
Figure 1
Cytotoxic effect of para-phenylenediamine and ortho-phenylenediamine (o-PD) on melanoma cells. A375 (a) and B16-F10 (b) cells grown in a 96-well (5000 cells in each well) plate were treated with p-PD of indicated concentrations for 16, 24, and 48 hours at 37°C. (c) In a similar manner, A375 cells were also treated with o-PD for 24 and 48 hours with indicated concentrations. Four wells were used for each concentration in every time point. One set of untreated cells (0.1% DMSO) was kept as control for each time point. The absorbance reading (OD) for each set obtained from the microplate reader was used to compute the percent change in viable cell in treated sets over respective controls using the expression {(ODControl − ODExperimental) × 100/ODControl}. The % viable cell over control was plotted against respective concentrations of p-PD. Error bars represent SD; n = 4.
Figure 2
Figure 2
Body weight gain of the mice treated with or without p-PD. (a) Effect of p-PD on tumour development in mice. Initially, right flanks of two sets of Swiss-Albino mice were given subcutaneous injection with only PBS (A) and B16-F10 cells (B) as mentioned in the Materials and Methods. These mice were kept for 2 weeks until visible tumour in the set (B) is formed. The mice from set (B) were divided into three groups: one (C) was treated with 2 and the other (D) was treated with 4 mg/kg of p-PD for 10 days. One (B) set was left untreated as control. Photographs of representative mouse from each set are shown here. Each set comprised 6 mice except for set (B) where initially 18 mice were used for the experiment. (b) Body weights of untreated mice (set (A) above) (■), mice treated with 4 mg/kg of p-PD (⧫), mice having tumour (- - -) (set (B)), and mice having tumour treated with 2 (▲) (set (C)) and 4 () mg/kg (set (D)) of p-PD are plotted against the days of treatment. Arrows indicate the time of peritoneal p-PD administration. Error bars represent SD; n = 6. indicates the two-tailed p value ≤ 0.018. By conventional criteria, this difference is considered to be statistically significant.
Figure 3
Figure 3
p-PD mediates apoptosis in melanoma cells. (a) A375 cells were treated with p-PD as indicated. After treatment, cells were lysed with protein loading buffer (Materials and Methods). 30 μg of total protein lysate was loaded in each lane and subjected to western blot and probed for activation of PARP. Cells that were not treated with p-PD (0) but with 0.1% DMSO served as control (lanes 1, 5, and 9). These blots are representative of three independent analyses. β-actin is used as a loading control for all time points. (b) Both A375 and B16-F10 cells were treated for 48 hours with indicated amounts of p-PD and were subjected to flow cytometry analysis using Annexin V-FITC assay. DAPI was used as the DNA stain.
Figure 4
Figure 4
Cell cycle arrest at S phase imposed by p-PD. (a) Cell cycle distribution of A375 cells treated with p-PD as indicated was determined by PI staining using flow cytometry. The number of cells in S phase for each set was determined and plotted against indicated concentration of p-PD. Error bars represent SD; n = 3. (b) Flow cytometric analysis of BrdU incorporation by A375 cells treated with indicated concentrations of p-PD. The BrdU positive cell cultures at the S phase are gated in pink. Respective percent cell numbers are shown next to the gated cell clusters representing cell cycle phases.
Figure 5
Figure 5
p-PD activates extrinsic apoptotic pathways earlier than the intrinsic ones in human melanoma cells. (a) A375 cells were treated with p-PD as indicated. Cells treated for 6 and 24 hours were lysed with protein loading buffer (Materials and Methods). 30 μg of total protein lysate (same as described in Figure 3(a)) was loaded in each lane and subjected to western blot and probed for activated caspase 3, activated caspase 8, activated caspase 9, and Bid as indicated. Arrow and “⧫” indicate the cleaved fragments of caspase 8 and caspase 9, respectively. Cells that were not treated with p-PD (0) but with 0.1% DMSO served as controls. (b) Cells treated for 48 hours were lysed and analysed by western blot as mentioned above by probing with antibodies against active caspase 9 and Bid. “⧫” indicates both cleaved fragments of caspase 9. β-actin is used as a loading control for both panels. These blots are representative of three independent analyses.
Figure 6
Figure 6
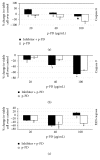
Caspase 8 inhibitor decreases the number of dead A375 cells. Cells were pretreated with the inhibitors of caspase 8 (a), caspase 9 (b), and PAN caspase (c) for two hours and subsequently treated with p-PD for 24 hours. Percent change in viable cells in sets with inhibitor pretreatment was computed as described in the Materials and Methods. The net protective effect (‡) is either the |value of white bar + value of black bar| or the decrease in dead cell number as denoted by ▲. By conventional criteria, this difference is considered to be extremely statistically significant. indicates the two-tailed p value ≤ 0.005. Each set was performed in triplicate.
Figure 7
Figure 7
p-PD depolarizes mitochondrial membrane potential of both melanoma cells. p-PD treated (as indicated for two hours) and untreated (0 μg/mL) melanoma cells were subjected to JC 1 staining for the measurement of MMP. For both cell lines, cell clusters which are high in PE fluorescence are gated in the top of each dot plot (red and green for B16-F10 and A375 cells, resp.) presenting the healthy cell population. Cell clusters that are gated for low PE fluorescence in the bottom part of each dot plot (green and blue for B16-F10 and A375 cells, resp.) are representing the cells with depolarized mitochondria. Cell percentage values of the gated population are stating the effect of p-PD in the polarization of mitochondria. One piece of the representative experimental data is shown here. Each set was performed in triplicate.
Figure 8
Figure 8
p-PD treatment increases the level of ROS in A375 cells. Control cells and cells treated with p-PD for 16 hours were subjected to DCFH-DA stain. Flow cytometric analyses of the stained cells were done as described in the Materials and Methods. One experimental data set is shown here. The percentage change of ROS was calculated using the expression (ROSExperiment − ROSControl) × 100/ROSControl. Each set was performed in triplicate.

Similar articles

Cited by

References

    1. Soengas M. S., Lowe S. W. Apoptosis and melanoma chemoresistance. Oncogene. 2003;22(20):3138–3151. doi: 10.1038/sj.onc.1206454. - DOI - PubMed
    1. Guida M., Pisconte S., Colucci G. Metastatic melanoma: the new era of targeted therapy. Expert Opinion on Therapeutic Targets. 2012;16(2):S61–S70. doi: 10.1517/14728222.2011.645807. - DOI - PubMed
    1. Kyrgidis A., Valasidis A., Bourlidou E., Andreadis C. Better targeting melanoma: options beyond surgery and conventional chemotherapy. Recent Patents on Endocrine, Metabolic & Immune Drug Discovery. 2011;5(2):147–159. doi: 10.2174/187221411799015363. - DOI - PubMed
    1. Pinon A., Limami Y., Micallef L., et al. A novel form of melanoma apoptosis resistance: melanogenesis up-regulation in apoptotic B16-F0 cells delays ursolic acid-triggered cell death. Experimental Cell Research. 2011;317(12):1669–1676. doi: 10.1016/j.yexcr.2011.04.014. - DOI - PubMed
    1. Stanley L. A., Skare J. A., Doyle E., Powrie R., D'Angelo D., Elcombe C. R. Lack of evidence for metabolism of p-phenylenediamine by human hepatic cytochrome P450 enzymes. Toxicology. 2005;210(2-3):147–157. doi: 10.1016/j.tox.2005.01.019. - DOI - PubMed

LinkOut - more resources