. 2016 May 1;6(5):937-56.
eCollection 2016.

Therapeutic evaluation of monoclonal antibody-maytansinoid conjugate as a model of RON-targeted drug delivery for pancreatic cancer treatment

Affiliations

Therapeutic evaluation of monoclonal antibody-maytansinoid conjugate as a model of RON-targeted drug delivery for pancreatic cancer treatment

Hang-Ping Yao et al. Am J Cancer Res. .

Abstract

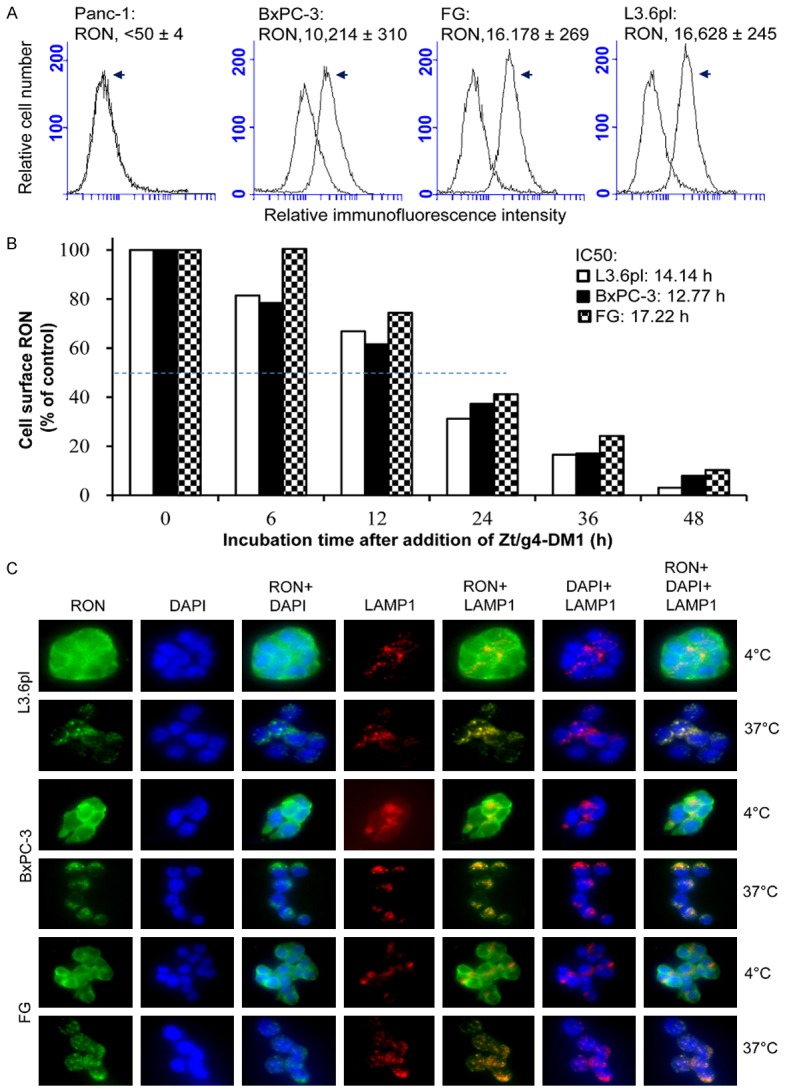
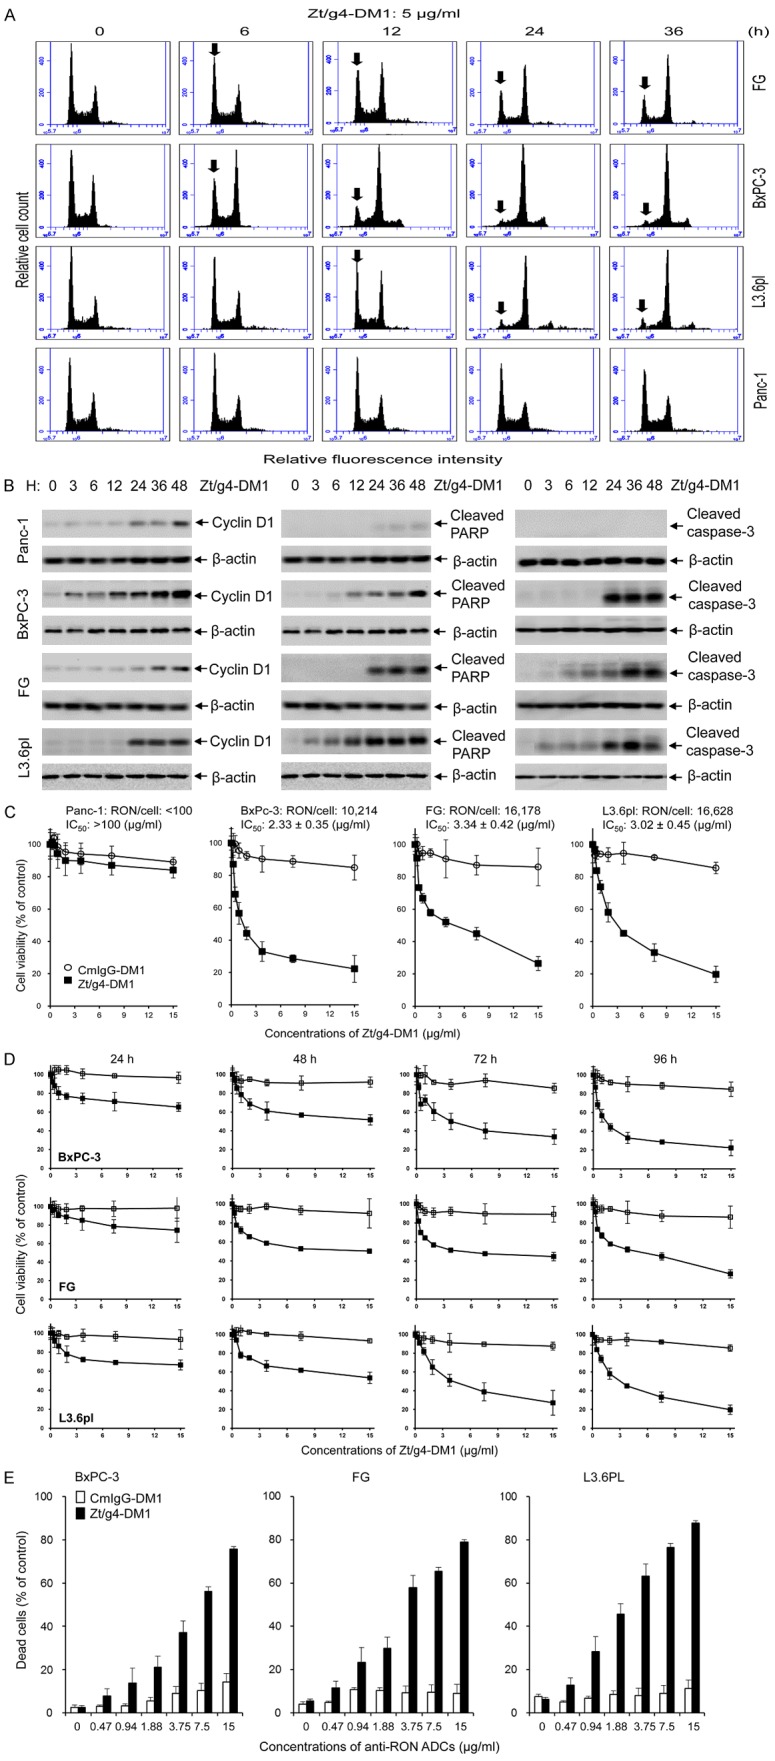
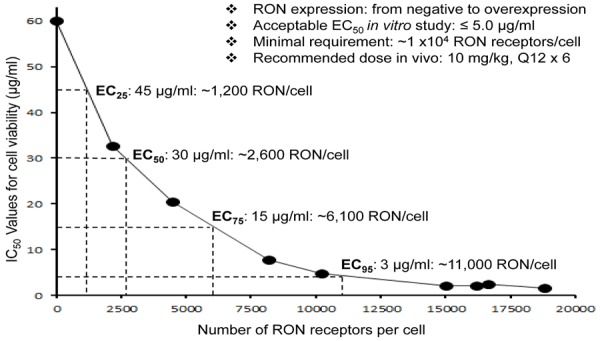
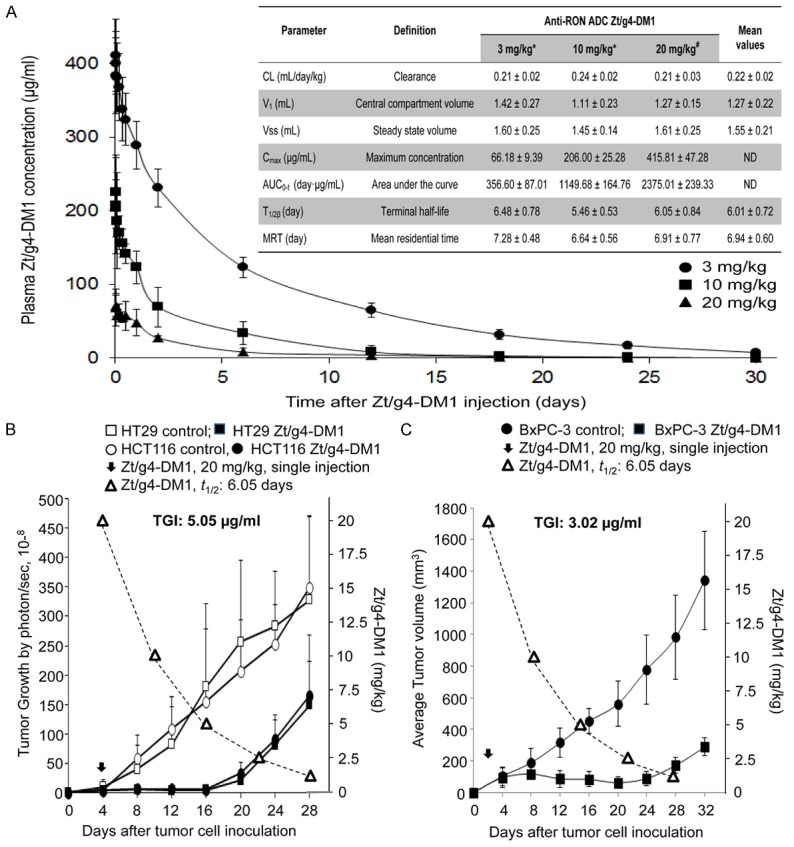
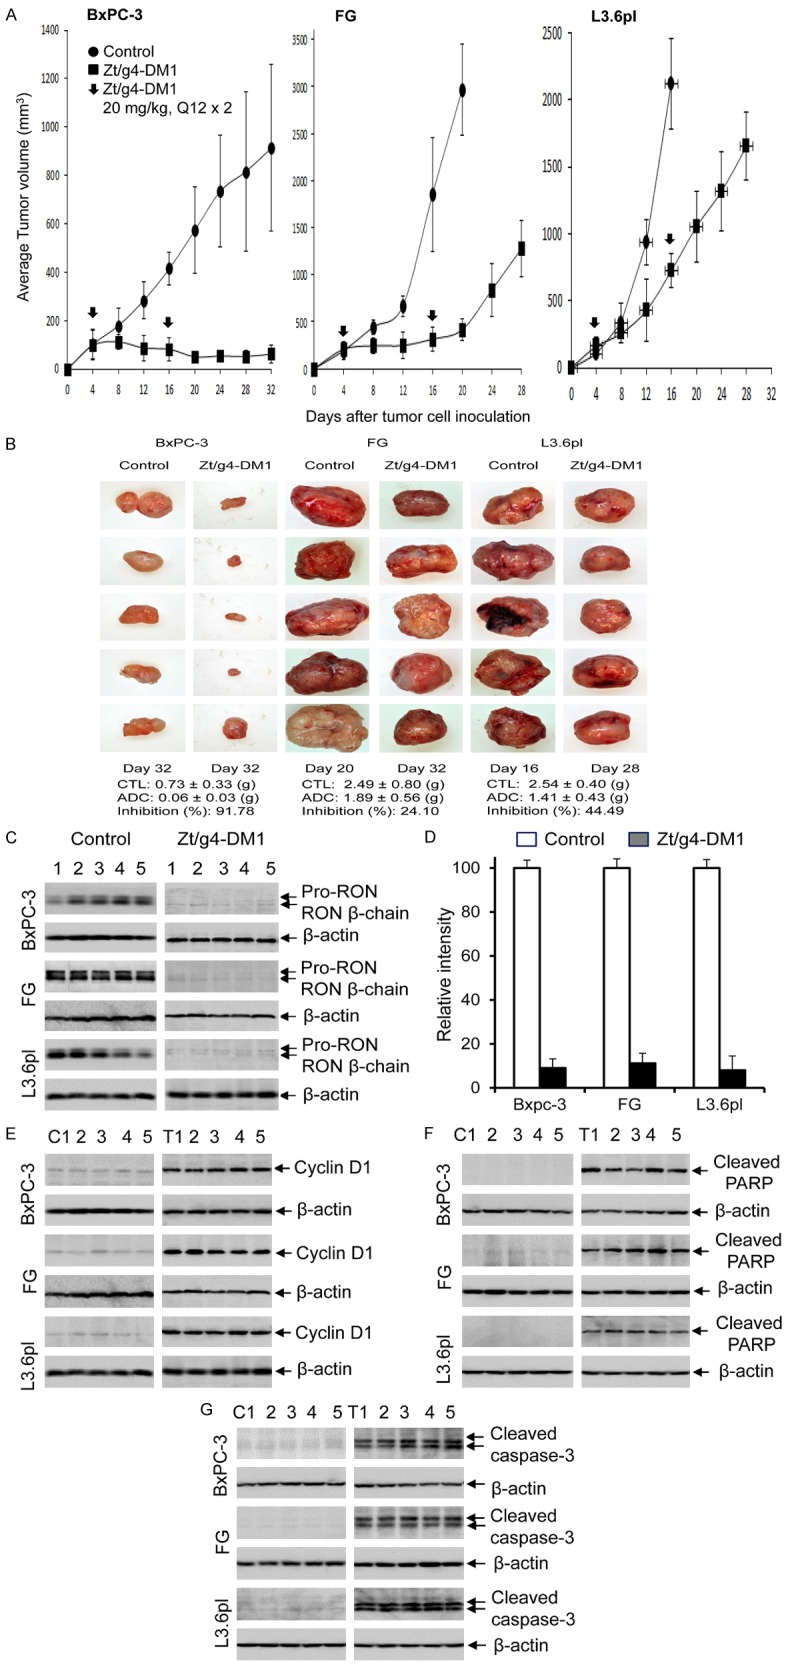
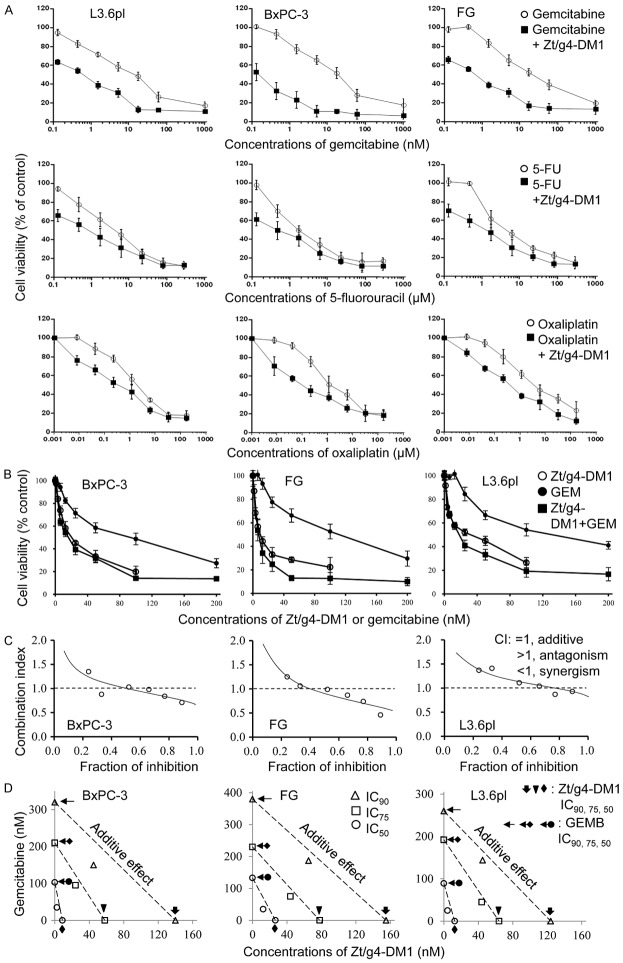
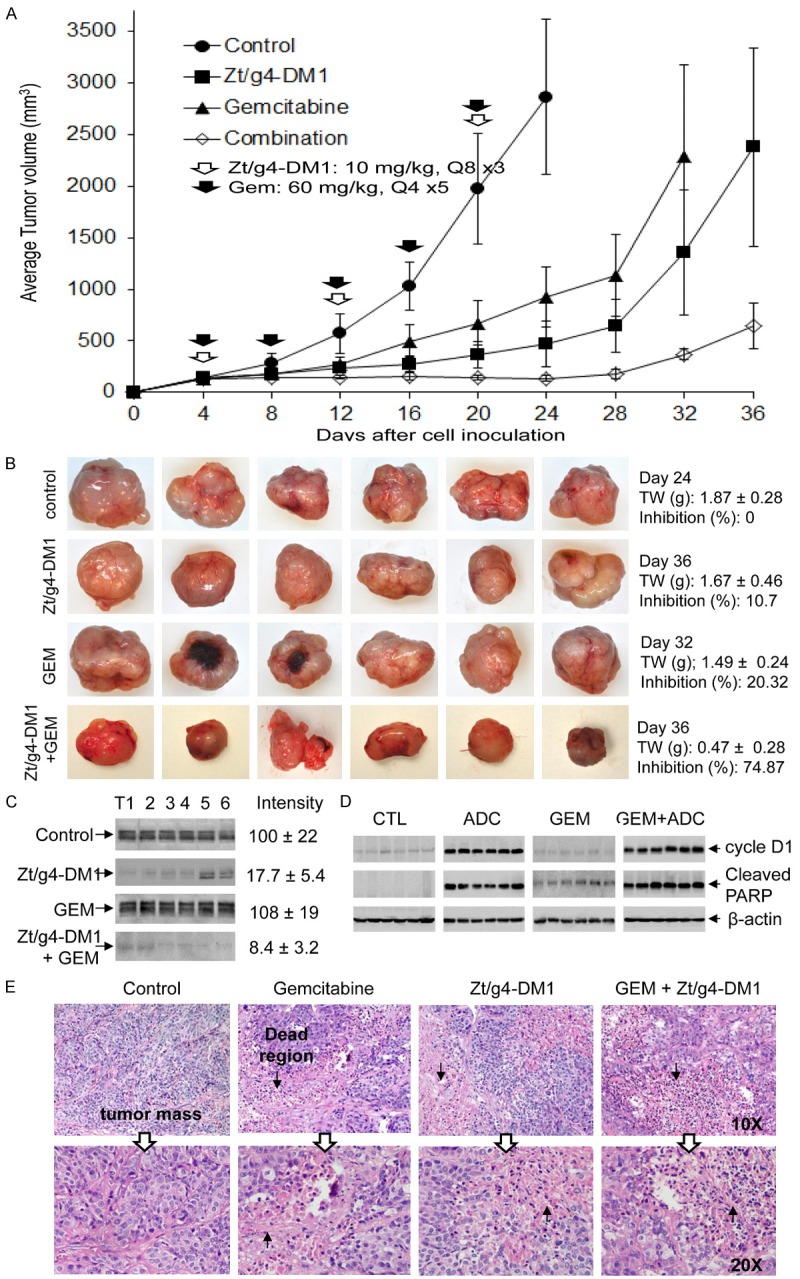
Aberrant expression of the RON receptor tyrosine kinase, a member of the MET proto-oncogene family, contributes significantly to pancreatic cancer tumorigenesis and chemoresistance. Here we validate RON as a target for pancreatic cancer therapy using a novel anti-RON antibody Zt/g4-drug maytansinoid conjugates (Zt/g4-DM1) as a model for RON-targeted drug delivery to kill pancreatic cancer cells. In pancreatic cancer cell lines overexpressing RON, Zt/g4-DM1 rapidly induced receptor endocytosis, arrested cell cycle at G2/M phase, reduced cell viability, and subsequently caused massive cell death. These in vitro observations help to establish a correlation between the number of the cell surface RON receptors and the efficacy of Zt/g4-DM1 in reduction of cell viability. In mice, Zt/g4-DM1 pharmacokinetics in the linear dose range fitted into a two-compartment model with clearance in 0.21 ml/day/kg and terminal half-life at 6.05 days. These results helped to confirm a concentration-activity relationship for the BxPC-3 and other pancreatic cancer cell xenograft model with a tumoristatic dose at 3.02 mg/kg. Zt/g4-DM1 was effective in vivo against various xenograft PDAC growth but efficacy varied with individual cell lines. Combination of Zt/g4-DM1 with gemcitabine had a complete inhibition of xenograft pancreatic cancer growth. We conclude from these studies that increased RON expression in pancreatic cancer cells is a suitable targeting moiety for anti-RON ADC-directed drug delivery and anticancer therapy. Zt/g4-DM1 is highly effective alone or in combination with chemotherapeutics in inhibition of pancreatic cancer xenograft growth in preclinical models. These findings justify the use of humanized Zt/g4-DM1 for targeted pancreatic cancer therapy in the future.

Keywords: Receptor tyrosine kinase; antibody-drug conjugate; combination therapy; pancreatic cancer; pharmacokinetics; therapeutic efficacy; xenograft tumor model.


Figures

Figure 1
Figure 1
Induction of RON endocytosis by Zt/g4-DM1 in PDAC cell lines: (A) Levels of RON expression by PDAC cell lines. Four PDAC cell lines (1 × 10⁶ cells/ml) in PBS were incubated at 4°C with 5 μg/ml Zt/g4 for 60 min. Isotope matched mouse IgG was used as the control. Cell surface RON was quantitatively determined by immunofluorescence analysis using QIFKIT® (DAKO). (B) Kinetic reduction of cell surface RON. BxPC-3, FG and L3.6pl cells (1 × 10⁶ cells per dish) were treated at 37°C with 5 μg/ml of Zt/g4-DM1, collected at different time points, washed with acidic buffer to eliminate cell surface bound IgG [22], and then incubated with 2 μg/mL of anti-RON mAb Zt/F2. Immunofluorescence was analyzed by flow cytometer using FITC-coupled anti-mouse IgG. Immunofluorescence from cells treated with Zt/g4-DM1 at 4°C was set as 100%. Internalization efficiency (IC50) was calculated as the time required to achieve the 50% reduction of cell surface RON. (C) Immunofluorescent localization of endocytic RON in cytoplasm. BxPC-3, FG, and L3.6pl cells (1 × 10⁵ cells per chamber) were treated at 4°C or 37°C with 5 μg/ml of Zt/g4-DM1 for 12 h followed by FITC-coupled goat anti-mouse IgG. LAMP1 was detected using mouse anti-LAMP1 mAb and used as a marker for protein cytoplasmic localization. After cell fixation, immunofluorescence was detected using the BK70 Olympus microscope equipped with a fluorescence apparatus. DAPI was used to stain nuclear DNA. Images were also overlapped to show the co-localization of RON with LAMP1 in cytoplasm.
Figure 2
Figure 2
Effect of Zt/g4-DM1 on cell cycle, viability, and death by PDAC cell lines expressing different amounts of cell surface RON: (A) Changes in cell cycles. Three PDAC cell lines (1 × 10⁶ cells per dish in 10% DMEM with 10% FBS) were treated at 37°C with 5 μg/ml of Zt/g4-DM1 for various times, collected, stained with propidium iodide, and then analyzed by flow cytometer [26]. A decrease in G1 phase and an increase in G2/M phases are marked with arrows. (B) Cyclin D1 expression and PARP/caspase-3 cleavage. PDAC cell lines (3 × 10⁶ cells per dish) were treated with 5 µg/ml Zt/g4-DM1 for various times. Western blot analysis of cellular proteins (50 µg/ per lane) was performed using antibodies specific to cyclin-D1, cleaved PARP, or cleaved caspase-3, respectively. Actin was used as the loading control. (C) Effect of Zt/g4-DM1 on viability of PDAC cells expressing different levels of RON. Four PDAC cell lines (8000 cells per well in a 96-well plate in triplicate) were treated with different amounts of Zt/g4-DM1 for 96 h. Cells treated with normal mouse IgG conjugated with DM1 (CmIgG-DM1) serviced as the control. Cell viability was determined by the MTS assay. (D) Kinetic effect of Zt/g4-DM1 on cell viability. Zt/g4-DM1 treatment of PDAC cells was performed as described in (C). Cell viability was determined at different intervals by the MTT assay. (E) Death of PDAC cells after Zt/g4-DM1 treatment. PDAC cells were treated with different amounts of Zt/g4-DM1 for 96 h. The percentages of cell death were determined by the trypan blue exclusion method.
Figure 3
Figure 3
Correlation between RON receptor and Zt/g4-DM1 efficacy: Cell viability IC50 values from a panel of cancer cell lines expressing different levels of RON per cell (Panc-1: < 10; H1993: 2,152; DLD1: 4,480; MDA-MB-213: 8,185; BxPC-3: 10,214; HCT116: 15,005; FG: 16,178; L3.6pl: 16,628; and HT29: 18,793) were plotted with different numbers of RON expressed per cell. Zt/g4-DM1 at the amount below 5 mg/ml to achieve an IC50 value was used as the effective dose to determine the required receptor number to reach the EC95 value. The IC50 values for cell viability or death at 96 h from individual groups were calculated using the GraphPad Prism 6 software. Results shown here are from one of three experiments with similar results.
Figure 4
Figure 4
Analysis of pharmacokinetics of Zt/g4-DM1 for predicting the time-dose-relationship: Tumor-bearing and -nonbearing mice (athymic nude, 5 mice per group) were injected with a single dose of Zt/g4-DM1. Collected blood samples were analyzed using the DM1 antibody ELISA kit (Eagle Biosciences, Inc., Nashua, NH) to determine the amount of DM1-coupled Zt/g4 in plasma. Various PK parameters were calculated using the software provided by Eagle Biosciences. (A): PK from both tumor-bearing and nonbearing mice injected with a single dose of 3, 10, and 20/mg/kg Zt/g4-DM1. (B) Dynamics of Zt/g4-DM1 in vivo plotted with the growth curve of CRC xenograft tumors. Athymic nude mice were inoculated with HT29 and HCT116 cells (5 × 10⁶ cells per mouse, five mice per group). A single dose of Zt/g4-DM1 at 20 mg/kg was injected when tumor volume reached ~150 mm3. PK data from (A) was plotted to the tumor growth curve. (C) Dynamics of Zt/g4-DM1 in vivo plotted with the growth curve of BxPC-3 xenograft tumors. Mice bearing BxPC-3 xenograft tumors were injected with a single dose of Zt/g4-DM1 at 20 mg/kg through tail vein when tumor volume reached ~150 mm3. PK data from (A) was plotted to the tumor growth curve. TSCs for CRC and PDAC xenograft models were determined as the minimal dose of Zt/g4-DM1 required to balance tumor growth and inhibition.
Figure 5
Figure 5
Therapeutic efficacy of Zt/g4-DM1 in three PDAC xenograft tumor models: (A) Athymic nude mice (five mice per group) were subcutaneously inoculated with 5 × 10⁶ BxPC-3, FG, and L3.6pl cells and tumors were allowed to reach an average volume of ~150 mm3. Zt/g4-DM1 at 20 mg/kg was injected through tail vein in the Q12 × 2 regimen. Mice injected with CmIgG-DM1 were used as the control. Tumor volume was measured every four days using a method previously described [26]. Mice were euthanized when tumor volume reached ~1000 mm3 (for BxPC-3 model) or 2000 mm3 (for FG and L3.6pl models). The percentages of tumor growth inhibition were calculated by a formula: 100%-(average tumor volume from treatment group)/(average tumor volume from control group) × 100%. (B) Individual tumors from different groups were collected from euthanized mice. The percentages of inhibition were calculated by a formula: 100% - (average tumor weight from treatment group)/(average tumor weight from control group) × 100%. (C) A portion of tumor samples from different groups were lysed using the tissue lysis buffer as previously described [26]. Proteins (50 µg per sample) were subjected to Western blot analysis to detect RON using rabbit anti-RON IgG antibody #5029 [18]. (D) Densitometry analysis was performed to determine the levels of RON expression by individual samples using the software from the BioRad 5000 Image system. Expression of cyclin-D1 (E), cleaved PARP (F) and caspase-3 (G) by individual tumors after Zt/g4-DM1 treatment was determined by Western blot analysis of tumor lysate using antibodies specific to corresponding proteins as described in (C).
Figure 6
Figure 6
Synergistic effect of Zt/g4-DM1 in combination with chemotherapeutics in vitro on PDAC cell viability: (A) PDAC cell lines BxPC-3, FG, and L3.6pl cells (8,000 cell per well in a 96-well plate in triplicate) were cultured in DMEM with 10% FBS and treated with Zt/g4-DM1 at individual IC50 dose with or without different amounts of gemcitabine, oxaliplatin, or 5-FU for 96 h. Cell viability was measured using the MTT assay. Viability from control cells was defined as 100% and used to calculate percentages of cell viability for drug-treated cells. (B) Three PDAC cell lines were cultured as described above. Cells were treated with Zt/g4-DM1 (0.31 to 20 mg/ml, equivalent to 2 to 133 nM of free DM1), gemcitabine (2.5 to 160 nM) or their combination to form a fixed ratio of Zt/g4-DM1: gemcitabine at 1:1.2. The percentages of cell viability were calculated at 96 h as described above. (C) The percentages of cell viability from individual samples were calculated, converted, and then used for the fraction of inhibition-combination index (CI) plot as previously described [33]. (D) Results from (B) also were used for isobologram analysis to determine the IC50, IC75 and IC90 values to define the synergism as previously described [33,34]. Data shown here are from one of three experiments with similar results.
Figure 7
Figure 7
Synergism between Zt/g4-DM1 and gemcitabine in vivo in inhibition of xenograft PDAC growth: (A) Athymic nude mice (five mice per group) were subcutaneously inoculated with 5 × 10⁶ FG cells to allow tumor growth to reach an average volume at ~150 mm3. Zt/g4-DM1 at 10 mg/kg was injected through tail vein in a Q8 × 3 regimen. Mice injected with CmIgG-DM1 were used as the control. Gemcitabine was injected into the intraperitoneal cavity at 60 mg/kg in a Q4 × 5 schedule. Both drugs were used for the combination group according to their own dose and schedule. Tumor volume was measured every four days. The percentages of tumor growth inhibition were calculated from the average tumor volume as described in Figure 5A. (B) Individual tumors from different groups were collected from euthanized mice when their volumes reached ~2,000 mm3 and then weighed to obtain the average tumor weight (gram). The percentages of inhibition were calculated as described in Figure 5B. (C) A portion of tumor samples from different groups were lysed using the tissue lysis buffer as previously described [26]. Lysate proteins (50 µg per sample) were subjected to Western blot analysis to detect RON using rabbit anti-RON IgG antibody #5029. Densitometry analysis was performed to determine the level of RON expression using software from the BioRad 5000 Image system. (D) Expression of cyclin-D1 and cleaved PARP in individual tumors after treatment was determined by Western blot analysis using antibodies specific to cyclin-D1 and cleaved PARP, respectively. (E) A portion of FG cell-derived xenograft tumor samples was processed for histological examination. Analysis by H&E staining reveals cell death in different regions in tumors treated with Zt/g4-DM1, gemcitabine, or their combination but not in tumors from control mice. Arrows indicate dead regions and adjacent PDAC tissues in tumor masses.

Similar articles

Cited by

References

    1. Ryan DP, Hong TS, Bardeesy N. Pancreatic adenocarcinoma. N Engl J Med. 2014;371:1039–1049. - PubMed
    1. Vaccaro V, Gelibter A, Bria E, Iapicca P, Cappello P, Di Modugno F, Pino MS, Nuzzo C, Cognetti F, Novelli F, Nistico P, Milella M. Molecular and genetic bases of pancreatic cancer. Curr Drug Targets. 2012;13:731–743. - PubMed
    1. Morris JP 4th, Wang SC, Hebrok M. KRAS, Hedgehog, Wnt and the twisted developmental biology of pancreatic ductal adenocarcinoma. Nat Rev Cancer. 2010;10:683–695. - PMC - PubMed
    1. Bardeesy N, DePinho RA. Pancreatic cancer biology and genetics. Nat Rev Cancer. 2002;2:897–909. - PubMed
    1. Jamieson NB, Carter CR, McKay CJ, Oien KA. Tissue biomarkers for prognosis in pancreatic ductal adenocarcinoma: a systematic review and meta-analysis. Clin Cancer Res. 2011;17:3316–3331. - PubMed

LinkOut - more resources