

Simultaneous genomic identification and profiling of a single cell using semiconductor-based next generation sequencing
- PMID: 27294018
- PMCID: PMC4887956
- DOI: 10.1016/j.atg.2014.05.004
Simultaneous genomic identification and profiling of a single cell using semiconductor-based next generation sequencing
Abstract
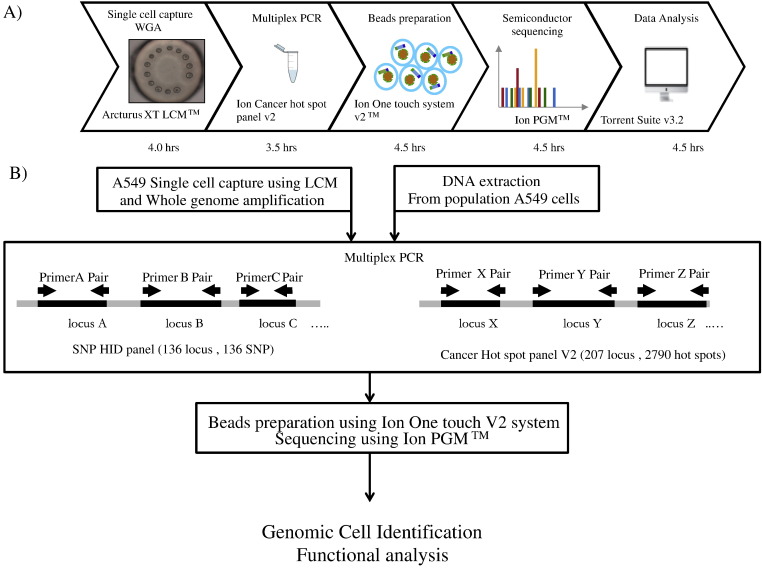
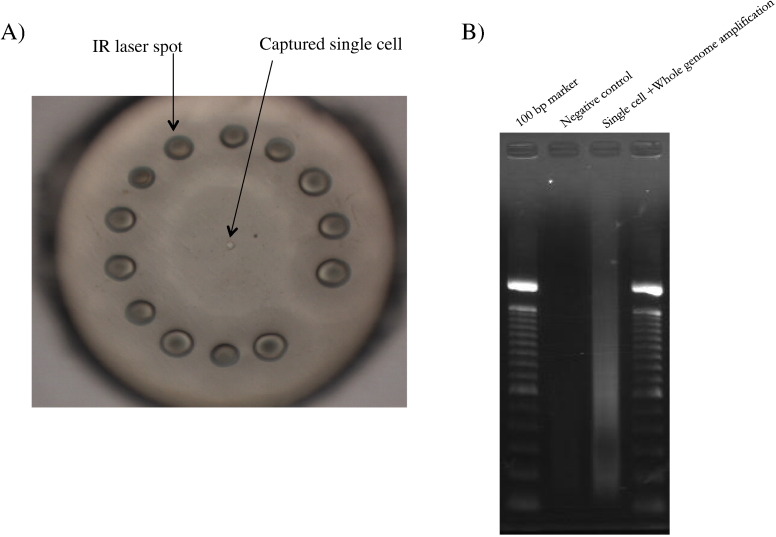
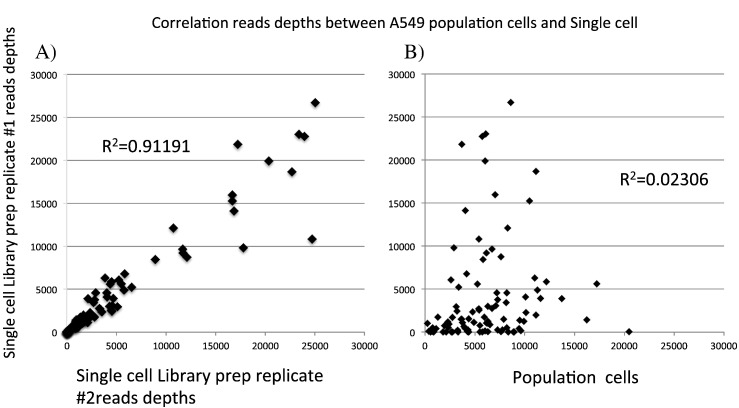
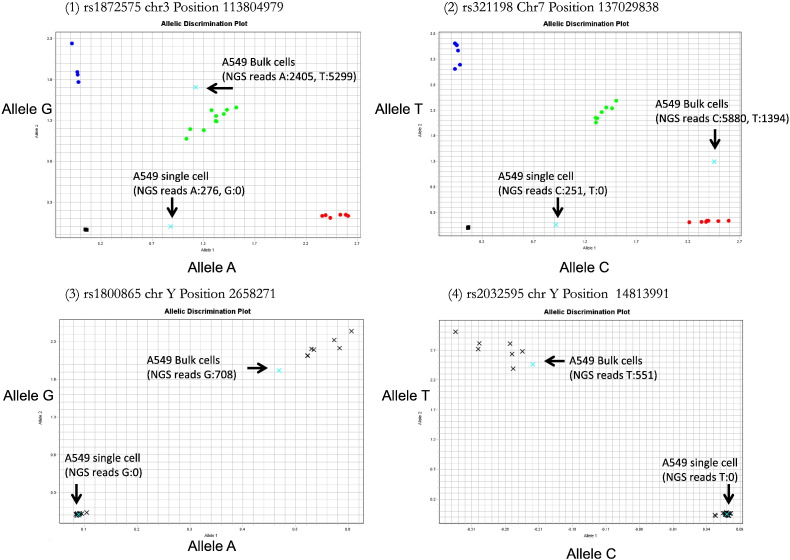
Combining single-cell methods and next-generation sequencing should provide a powerful means to understand single-cell biology and obviate the effects of sample heterogeneity. Here we report a single-cell identification method and seamless cancer gene profiling using semiconductor-based massively parallel sequencing. A549 cells (adenocarcinomic human alveolar basal epithelial cell line) were used as a model. Single-cell capture was performed using laser capture microdissection (LCM) with an Arcturus® XT system, and a captured single cell and a bulk population of A549 cells (≈ 10(6) cells) were subjected to whole genome amplification (WGA). For cell identification, a multiplex PCR method (AmpliSeq™ SNP HID panel) was used to enrich 136 highly discriminatory SNPs with a genotype concordance probability of 10(31-35). For cancer gene profiling, we used mutation profiling that was performed in parallel using a hotspot panel for 50 cancer-related genes. Sequencing was performed using a semiconductor-based bench top sequencer. The distribution of sequence reads for both HID and Cancer panel amplicons was consistent across these samples. For the bulk population of cells, the percentages of sequence covered at coverage of more than 100 × were 99.04% for the HID panel and 98.83% for the Cancer panel, while for the single cell percentages of sequence covered at coverage of more than 100 × were 55.93% for the HID panel and 65.96% for the Cancer panel. Partial amplification failure or randomly distributed non-amplified regions across samples from single cells during the WGA procedures or random allele drop out probably caused these differences. However, comparative analyses showed that this method successfully discriminated a single A549 cancer cell from a bulk population of A549 cells. Thus, our approach provides a powerful means to overcome tumor sample heterogeneity when searching for somatic mutations.
Keywords: Heterogeneity; Laser capture microdissection; Semiconductor-based sequencing; Single cell identification.
Figures
Similar articles
-
Next generation sequencing of SNPs using the HID-Ion AmpliSeq™ Identity Panel on the Ion Torrent PGM™ platform.Forensic Sci Int Genet. 2016 Nov;25:73-84. doi: 10.1016/j.fsigen.2016.07.021. Epub 2016 Jul 29. Forensic Sci Int Genet. 2016. PMID: 27500651
-
Inter-laboratory evaluation of SNP-based forensic identification by massively parallel sequencing using the Ion PGM™.Forensic Sci Int Genet. 2015 Jul;17:110-121. doi: 10.1016/j.fsigen.2015.04.007. Epub 2015 Apr 15. Forensic Sci Int Genet. 2015. PMID: 25955683
-
Massively parallel sequencing of micro-manipulated cells targeting a comprehensive panel of disease-causing genes: A comparative evaluation of upstream whole-genome amplification methods.PLoS One. 2018 Apr 26;13(4):e0196334. doi: 10.1371/journal.pone.0196334. eCollection 2018. PLoS One. 2018. PMID: 29698522 Free PMC article.
-
Tumor Heterogeneity, Single-Cell Sequencing, and Drug Resistance.Pharmaceuticals (Basel). 2016 Jun 16;9(2):33. doi: 10.3390/ph9020033. Pharmaceuticals (Basel). 2016. PMID: 27322289 Free PMC article. Review.
-
Changing Technologies of RNA Sequencing and Their Applications in Clinical Oncology.Front Oncol. 2020 Apr 9;10:447. doi: 10.3389/fonc.2020.00447. eCollection 2020. Front Oncol. 2020. PMID: 32328458 Free PMC article. Review.
References
-
- Gerlinger M., Rowan A.J., Horswell S., Larkin J., Endesfelder D., Gronroos E., Martinez P., Matthews N., Stewart A., Tarpey P., Varela I., Phillimore B., Begum S., McDonald N.Q., Butler A., Jones D., Raine K., Latimer C., Santos C.R., Nohadani M., Eklund A.C., Spencer-Dene B., Clark G., Pickering L., Stamp G., Gore M., Szallasi Z., Downward J., Futreal P.A., Swanton C. Intratumor heterogeneity and branched evolution revealed by multiregion sequencing. N. Engl. J. Med. 2012;366:883–892. - PMC - PubMed
-
- Handyside A.H., Robinson M.D., Simpson R.J., Omar M.B., Shaw M.A., Grudzinskas J.G., Rutherford A. Isothermal whole genome amplification from single and small numbers of cells: a new era for preimplantation genetic diagnosis of inherited disease. Mol. Hum. Reprod. 2004;10:767–772. - PubMed
LinkOut - more resources
Full Text Sources
Other Literature Sources
