. 2016 Jun 10;3(3):ENEURO.0071-16.2016.
doi: 10.1523/ENEURO.0071-16.2016. eCollection 2016 May-Jun.

Neural Representation of Concurrent Vowels in Macaque Primary Auditory Cortex

Affiliations

Neural Representation of Concurrent Vowels in Macaque Primary Auditory Cortex

Yonatan I Fishman et al. eNeuro. .

Abstract

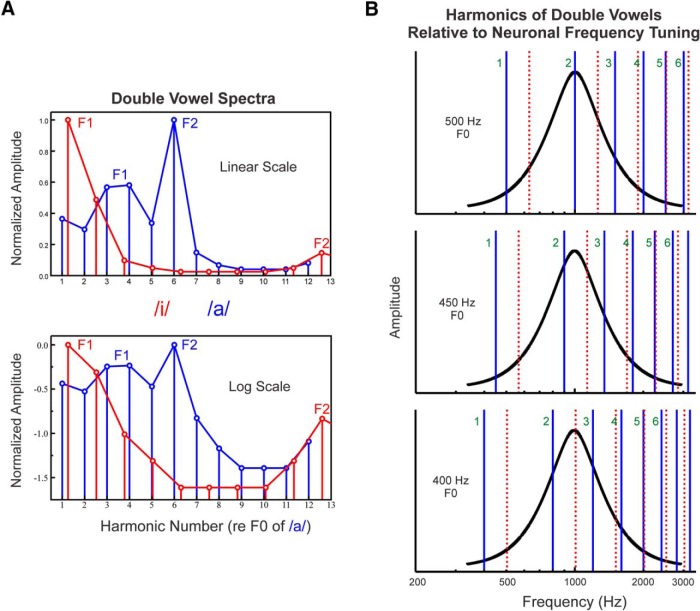
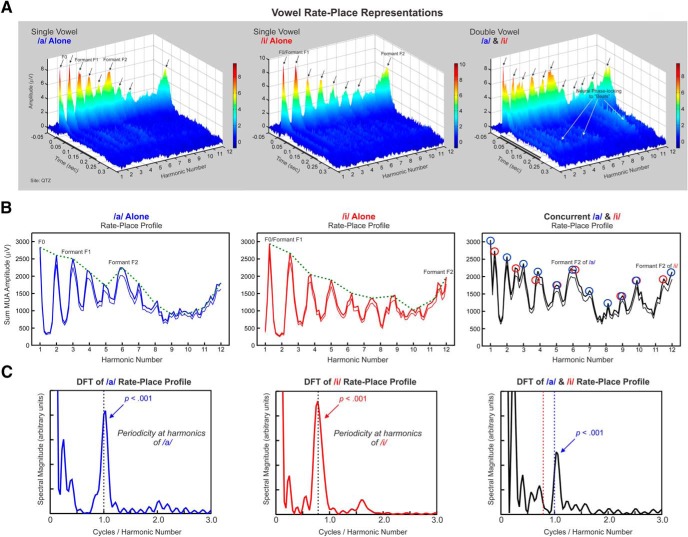
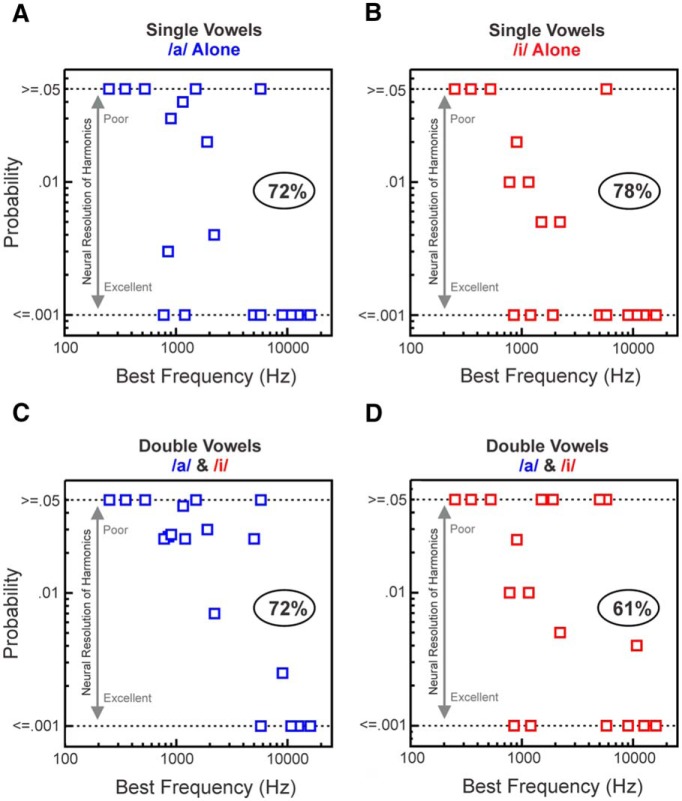
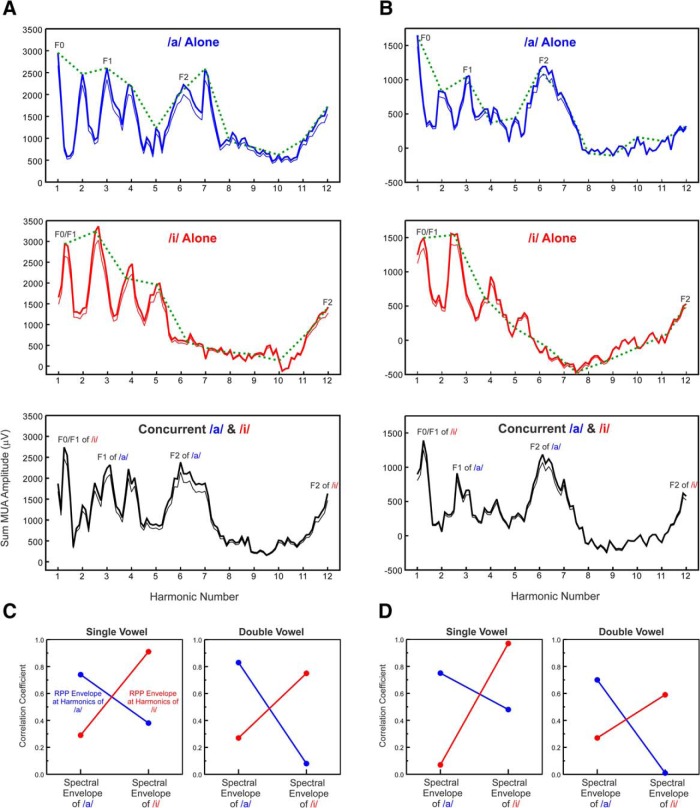
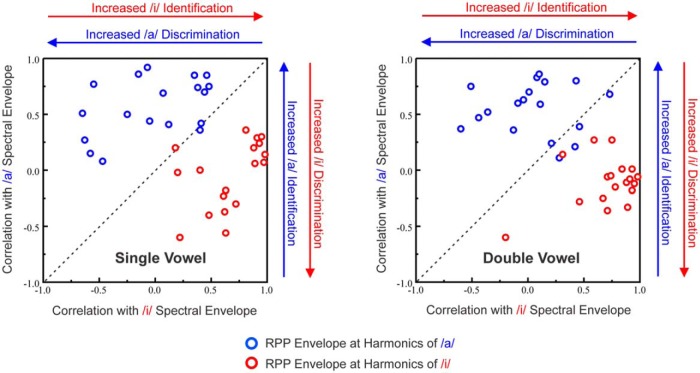
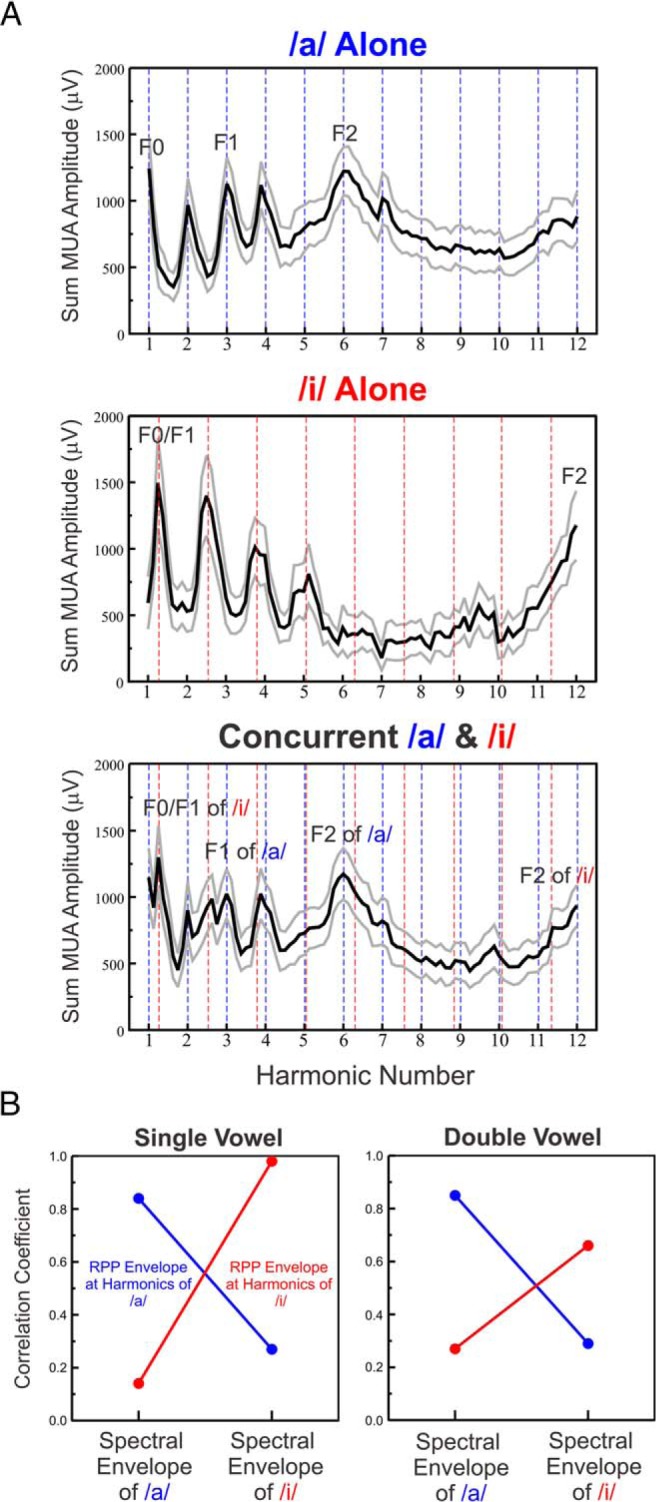
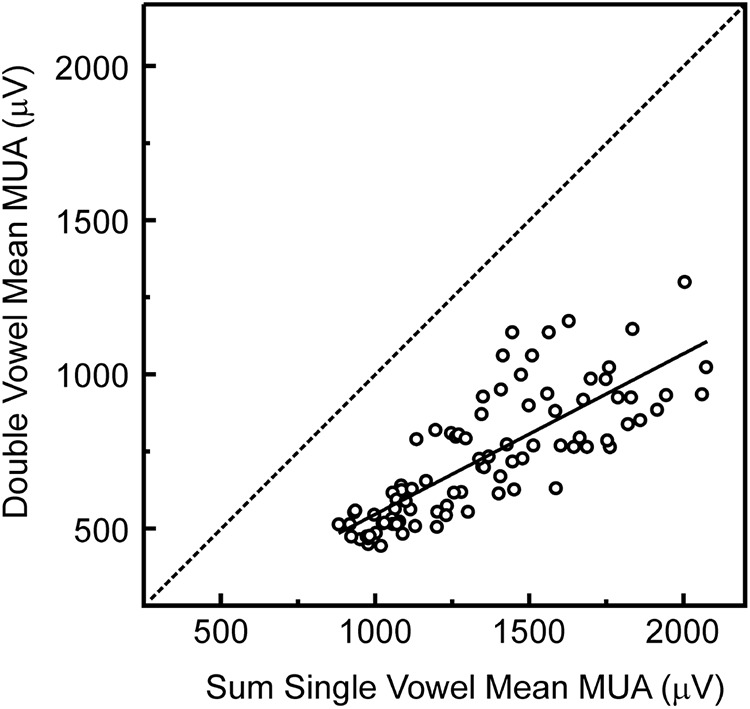
Successful speech perception in real-world environments requires that the auditory system segregate competing voices that overlap in frequency and time into separate streams. Vowels are major constituents of speech and are comprised of frequencies (harmonics) that are integer multiples of a common fundamental frequency (F0). The pitch and identity of a vowel are determined by its F0 and spectral envelope (formant structure), respectively. When two spectrally overlapping vowels differing in F0 are presented concurrently, they can be readily perceived as two separate "auditory objects" with pitches at their respective F0s. A difference in pitch between two simultaneous vowels provides a powerful cue for their segregation, which in turn, facilitates their individual identification. The neural mechanisms underlying the segregation of concurrent vowels based on pitch differences are poorly understood. Here, we examine neural population responses in macaque primary auditory cortex (A1) to single and double concurrent vowels (/a/ and /i/) that differ in F0 such that they are heard as two separate auditory objects with distinct pitches. We find that neural population responses in A1 can resolve, via a rate-place code, lower harmonics of both single and double concurrent vowels. Furthermore, we show that the formant structures, and hence the identities, of single vowels can be reliably recovered from the neural representation of double concurrent vowels. We conclude that A1 contains sufficient spectral information to enable concurrent vowel segregation and identification by downstream cortical areas.

Keywords: auditory scene analysis; multiunit activity; pitch; speech perception.


Conflict of interest statement

The authors report no conflict of interest.

Figures

Figure 1.
Figure 1.
Schematic representation of the double vowel stimuli presented in the study. A, Spectra of double vowel stimuli plotted on both linear and logarithmic scales. Stimulus amplitude and frequency are represented along the vertical and horizontal axes, respectively. Stimuli consisted of a series of two simultaneously presented vowels, /a/ and /i/, with a fixed F0 difference between them of four semitones (a major 3rd). Harmonics of the vowel with the lower F0 (/a/) and higher F0 (/i/) are represented by the vertical blue and red drop lines, respectively. The spectral envelopes of the vowels are represented by the lines connecting the vertical drop lines. Main formants of the vowels (peaks in the spectral envelopes) are labeled. B, Harmonics of double vowels relative to neuronal frequency tuning. Harmonics of the vowel with the lower F0 (/a/) and higher F0 (/i/) are represented by the solid blue and broken red lines, respectively. All harmonics are shown at equal amplitude for clarity. The F0 of the vowel with the lower pitch is varied such that harmonics of the double vowel fall progressively on either the peak (at the BF, here equal to 1000 Hz) or the sides of the neuronal frequency response function (black). As the F0 of the higher-pitched vowel (/i/) is fixed at four semitones above the F0 of the lower-pitched vowel (/a/), the F0 of the higher-pitched vowel varies correspondingly. The F0 of the vowel /a/ is indicated on the left of each plot; the first six harmonics of /a/ are labeled. If individual harmonics of the double vowel stimuli can be resolved by frequency-selective neurons in A1, then response amplitude as a function of F0 (or harmonic number: BF/F0) should display peaks when a given harmonic of /a/ or /i/ overlaps the BF (top and bottom plots) and troughs when the BF falls in between two adjacent harmonics of the concurrent vowels (middle plot).
Figure 2.
Figure 2.
Example rate-place representations of single and double concurrent vowels. A, Rate-place representations of single vowels (left and middle plots, /a/ and /i/, respectively) and double vowels (right plot) based on neuronal responses recorded at a site with a BF of 5750 Hz. Axes represent harmonic number (BF/F0 of the vowel /a/), time, and response amplitude in microvolts (also color-coded), as indicated. The black bars represent the duration of the stimuli (225 ms). In rate-place representations of single vowels, amplitude of On and Sustained activity displays a periodicity with prominent peaks (indicated by black arrows) occurring at or near values of harmonic number corresponding to the frequency components of the stimuli. Peaks corresponding to vowel formants are indicated. In rate-place representations of double vowels, peaks in the amplitude of On responses (indicated by black arrows) occur at or near values of harmonic number corresponding to frequency components of each of the vowels. Neuronal phase-locking to “beats” (stimulus waveform amplitude fluctuations indicated by white arrows) is also evident in the rate-place representation of the double vowels. B, Corresponding rate-place profiles of single and double vowels (as indicated) based on the area under the MUA waveform within the On time window. The thick lines represent the mean MUA, whereas the thin lines represent 1 SE below the mean. Envelopes of rate-place profiles are represented by the green dashed lines. Peaks in neural activity occur at or near values of harmonic number corresponding to the frequency components of the vowels. Peaks in the rate-place profile of the double vowel occurring at or near frequency components of /a/ and /i/ are indicated by the blue and red circles, respectively. C, Corresponding DFTs of the rate-place profiles shown in B.
Figure 3.
Figure 3.
Neural population responses in A1 can represent the individual harmonics (spectral fine-structure) of single and double vowels. Periodicity in rate-place profiles of responses to single and double vowels, which reflects the neural representation of harmonics, is quantified by the amplitude of peaks in the DFT of rate-place profiles (Fig. 2). Statistical significance of peaks is evaluated via permutation tests. Estimated probabilities of the observed periodicity in rate-place profiles of responses to single and double vowels, given the null distribution derived from random shuffling of points in rate-place profiles, are plotted as a function of BF. Results for single vowels are shown in A and B (harmonics of /a/ and /i/, respectively) and results for double vowels are shown in C and D (harmonics of /a/ and /i/, respectively). Only results based on rate-place data corresponding to harmonic numbers 1–6 are shown (see text for explanation). Lower probability values indicate greater periodicity at 1.0 cycle/harmonic number (corresponding to harmonics of /a/) and at 0.79 cycle/harmonic number (corresponding to harmonics of /i/), and a correspondingly greater capacity of neural responses to resolve individual harmonics of the vowels. As probability values >0.05 are considered nonsignificant, for display purposes, values ≥0.05 are plotted along the same row, as marked by the upper horizontal dashed line at 0.05 along the ordinate. As permutation tests were based on 1000 shuffles of rate-place data, probability values <0.001 could not be evaluated. Therefore, probability values ≤0.001 are plotted along the same row, as marked by the lower horizontal dashed line at 0.001 along the ordinate. Numbers in ovals indicate the percentage of sites displaying statistically significant (p < 0.05) periodicity in rate-place profiles corresponding to harmonics of the vowels.
Figure 4.
Figure 4.
Representative rate-place profiles of responses to single and double concurrent vowels. Rate-place profiles of responses to single and double vowels recorded at two sites with BFs of 1200 and 850 Hz (A and B, respectively). Same conventions as in Figure 2. Major peaks corresponding to the first and second formants of the vowels are labeled. Pearson correlation between envelopes of the rate-place profiles (RPPs) at harmonics of the vowels and the corresponding spectral envelopes of the single vowel stimuli (Fig. 1) are shown in C and D for each of the two sites, respectively. For both single and double vowels, rate-place profile envelopes at harmonics of each of the vowels (/a/, blue lines; /i/, red lines) are highly correlated with the spectral envelopes of the matching vowel stimuli, whereas they are poorly correlated with the spectral envelopes of the non-matching vowel stimuli, thereby indicating that A1 responses can be used to identify and discriminate the vowels, both when presented in isolation and concurrently.
Figure 5.
Figure 5.
Neural population responses in A1 can identify and discriminate vowels based on their spectral envelopes (formant structure), both when presented alone and concurrently. Plot of Pearson coefficients of correlation between envelopes of rate-place profiles (RPPs) elicited by single and double vowels and spectral envelopes of the vowel stimuli /a/ and /i/ (left plot, single vowels; right plot, double vowels). Values for responses to /a/ and /i/ are plotted in blue and red, respectively. Good vowel identification is reflected by the high correlation between the envelope of the rate-place profile for a given vowel and the spectral envelope of the matching vowel stimulus. Good vowel discrimination is reflected by the low correlation between the envelope of the rate-place profile for a given vowel and the spectral envelope of the non-matching vowel stimulus.
Figure 6.
Figure 6.
A. Rate-place profiles of responses to single and double concurrent vowels averaged across all recording sites. Mean ± SEM are represented by black and gray lines, respectively. B. Pearson correlation between envelopes of average rate-place profiles at harmonics of the vowels (left: single, right: double) and the spectral envelopes of the single vowel stimuli. Same conventions as in Figure 4.
Figure 7.
Figure 7.
Nonlinearity of responses to double concurrent vowels. Sum of response amplitude at each harmonic value in the population average rate-place profile elicited by each of the single vowels is plotted against the response amplitude at the same harmonic values in the population average rate-place profile elicited by the double concurrent vowels (note that each rate-place profile is comprised of 89 amplitude values). A regression line fit to the data is superimposed. All values lie below the identity line, indicating that responses to double vowels are diminished compared with the sum of responses to the single vowels.

Similar articles

Cited by

References

    1. Alain C (2007) Breaking the wave: effects of attention and learning on concurrent sound perception. Hear Res 229: 225-236. 10.1016/j.heares.2007.01.011 - DOI - PubMed
    1. Alain C, Reinke K, McDonald KL, Chau W, Tam F, Pacurar A, Graham S (2005) Left thalamo-cortical network implicated in successful speech separation and identification. Neuroimage 26:592-599. 10.1016/j.neuroimage.2005.02.006 - DOI - PubMed
    1. Assmann PF, Paschall DD (1998) Pitches of concurrent vowels. J Acoust Soc Am 103:1150-1160. - PubMed
    1. Assmann PF, Summerfield Q (1990) Modeling the perception of concurrent vowels: vowels with different fundamental frequencies. J Acoust Soc Am 88:680-697. - PubMed
    1. Atencio CA, Schreiner CE (2013) Auditory cortical local subnetworks are characterized by sharply synchronous activity. J Neurosci 33:18503-18514. 10.1523/JNEUROSCI.2014-13.2013 - DOI - PMC - PubMed

Publication types