

doi: 10.1038/nn.4325.
Epub 2016 Jun 13.
Age-related myelin degradation burdens the clearance function of microglia during aging
Affiliations
- PMID: 27294511
- PMCID: PMC7116794
- DOI: 10.1038/nn.4325
Item in Clipboard
Age-related myelin degradation burdens the clearance function of microglia during aging
Nat Neurosci.
2016 Aug.
Abstract
Myelin is synthesized as a multilamellar membrane, but the mechanisms of membrane turnover are unknown. We found that myelin pieces were gradually released from aging myelin sheaths and were subsequently cleared by microglia. Myelin fragmentation increased with age and led to the formation of insoluble, lipofuscin-like lysosomal inclusions in microglia. Thus, age-related myelin fragmentation is substantial, leading to lysosomal storage and contributing to microglial senescence and immune dysfunction in aging.
Conflict of interest statement
The authors declare no competing financial interests.
Figures
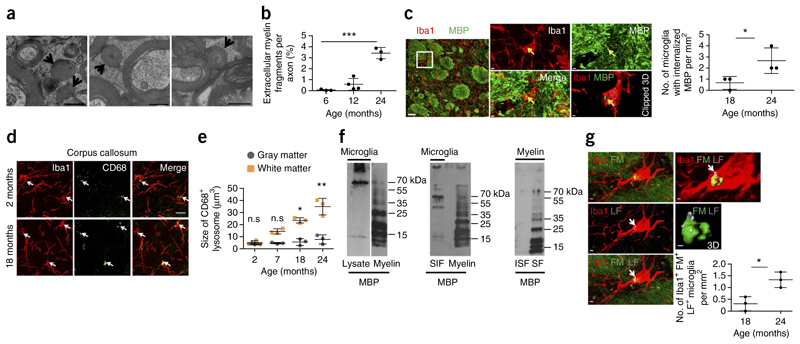
(a) High-pressure freezing for electron microscopy was performed on the optic nerve (24-month-old mice shown). Arrows point to myelin fragments; scale bar, 300 nm. (b) Quantification of myelin fragments per axon (n = 3 mice per group; mean ± s.d.; one-way ANOVA, ***P < 0.0001, F = 50.34, d.f. = 9; followed by Bonferroni’s post hoc test, 6 vs. 24 months, ***P < 0.0001, t = 9.253; 12 vs. 24 months, ***P = 0.0007, t = 8.225). (c) Confocal image shows colocalization of MBP-immunoreactive puncta (green) with Iba1-positive microglia (red) with age. Clipped 3D reconstruction of microglia (see Online Methods) shows MBP (arrows) inside the cell. Scale bars, 30 μm (left); 2 μm (center, top right); 1 μm (clipped 3D). Quantification of number of MBP immunoreactive puncta colocalizing with Iba1-positive microglia in the white matter (n = 3 mice per group; mean ± s.d.; *P = 0.0415, t = 2.112, d.f. = 2; Student’s two-tailed t test). (d) Visualization of CD68-positive lysosomes (green, marked by white arrows) and microglia (Iba1, red) in wild-type mice. Scale bar, 15 μm. (e) Quantification of lysosomal size in microglia of white and gray matter (n = 3 mice per group; mean ± s.d.; two-way ANOVA, brain region effect, ***P = 0.0006, F = 20.17, d.f. = 1; followed by Bonferroni’s post hoc test, 2 months, P = 0.7236, t = 0.1205; 7 months, P = 0.6356, t = 1.709; 18 months, *P = 0.0321, t = 3.139; 24 months, **P = 0.0065, t = 3.923). Each dot represents the mean value of 40 cells. (f) Left, western blot analysis of purified microglia lysates from 1-year-old mice shows MBP in the high molecular weight region; MBP in myelin is shown as a reference in the right lane. Middle, high-molecular weight species of MBP existed in the sarkosyl-insoluble fraction (SIF) of microglial membranes (1-year-old mice); MBP in myelin is shown as a reference in the right lane. Right, sarkosyl extraction on purified myelin shows that myelin-associated MBP is sarkosyl soluble (sarkosyl-soluble membrane fraction, SF). Full-length blots are presented in Supplementary Figure 10. (g) Colocalization of myelin fragments (FluoroMyelin, FM, green) with lipofuscin (LF, gray, marked with white arrows) within microglia (red) in a 24-month-old mouse. Scale bars, 2 μm. Quantification shows number of puncta positive for FluoroMyelin (FM) and lipofuscin colocalizing with Iba1-positive microglia in the white matter (n = 3 mice per group, mean ± s.d.; *P = 0.0356, t = 2.513, d.f. = 3; Student’s two-tailed t test). In b, c and g each dot represents the mean value of 3 brain slices per mouse. All images are representative of three independent experiments and western blots of five.
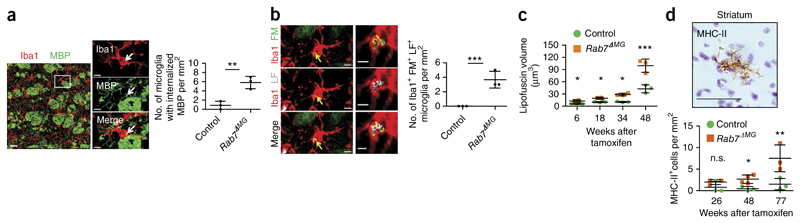
(a) Confocal image shows colocalization (white arrows) of MBP (green) with Iba1-positive microglia (red). Scale bars, 30 μm (left); 2 μm (right). Quantification of MBP-immunoreactive puncta in microglia of the white matter in 9-month-old control and Rab7
ΔMG mice (n = 3 mice per group; mean ± s.d.; **P = 0.0058, t = 5.376, d.f. = 4; Student’s two-tailed t test). (b) Colocalization of myelin fragments (FluoroMyelin (FM), green) with lipofuscin (LF, gray) within microglia in 12-month-old mice (n = 3 mice per group; mean ± s.d.; ***P < 0.0001, t = 21.265; d.f. = 4; Student’s two-tailed t test). Scale bars, 2 μm. (c) Quantification of lipofuscin volume in μm3 in Rab7
ΔMG mice as compared to controls (n = 3 mice per group, mean ± s.d.; two-way ANOVA; genotype effect, **P = 0.0033, F = 17.09; followed by Bonferroni’s post hoc test; *P < 0.05, ***P = 0.0006, t = 7.145). Each dot represents the mean value of 40 cells. (d) Visualization and quantification of MHC-II-positive microglia in Rab7
ΔMG mice and controls (n = 3 mice per group; mean ± s.d.; two-way ANOVA; genotype effect, ***P = 0.0007, F = 19.70; followed by Bonferroni’s post hoc test; *P = 0.0412, t = 2.893, **P = 0.0081, t = 4.782). n.s., nonsignificant (P = 0.3221). Scale bar, 50 μm. In b and d each dot represents the mean value of 3 brain slices per mouse. All images are representative of three independent experiments.
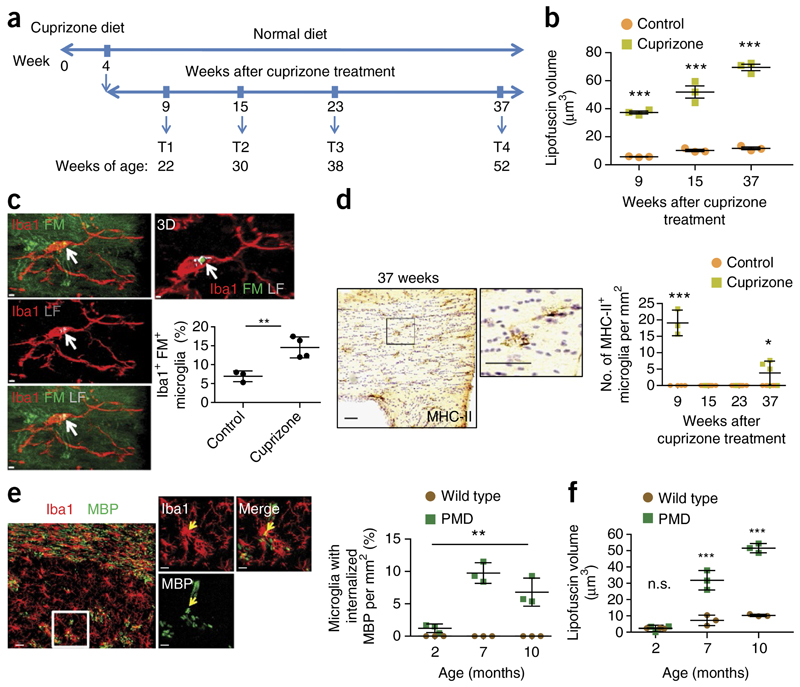
(a) Demyelination was induced by feeding mice cuprizone and their recovery was examined according to the timeline. (b) Quantification of lipofuscin volume in microglia 9, 15 and 37 weeks after cuprizone treatment (n = 3 mice per group; mean ± s.d., two-way ANOVA; cuprizone treatment effect, ***P < 0.0001, F = 389.2; followed by Bonferroni’s post hoc test, ***P < 0.001). Each dot represents the mean value of 40 cells. (c) Colocalization of myelin fragments (FluoroMyelin, green) with lipofuscin (gray) within microglia 37 weeks after cuprizone treatment (8-month-old mice; n = 3–4 mice per group; mean ± s.d.; **P = 0.0078, t = 4.289, d.f. = 5; Student’s two-tailed t test). Scale bars, 2 μm. (d) Quantification of MHC-II positive microglia in cuprizone-fed mice (9, 15, 23 and 37 weeks after cuprizone treatment as compared to aged-matched untreated mice; n = 5 mice per group; mean ± s.d.; two-way ANOVA; cuprizone treatment effect, ***P < 0.0001, F = 26.93; followed by Bonferroni’s post hoc test; ***P = 0.0007, t = 8.092; *P = 0.0425, t = 1.326). Each dot represents the mean value of 6 brain slices per mouse. Scale bar, 50 μm. (e) Confocal images and quantification of number of MBP-immunoreactive puncta (green) colocalizing with Iba1-positive microglia (red) in 10-month-old wild-type and PMD mice (n = 3 mice per group; mean ± s.d.; one-way ANOVA; **P = 0.0017, F = 21.93, d.f. = 8; followed by Bonferroni’s post hoc test; 2 vs. 7 months, **P = 0.0029, t = 6.521; 2 vs. 10 months, *P = 0.0352, t = 4.263) Scale bars, 30 μm (left); 5 μm (right). Each dot represents the mean value of 3 brain slices of one mouse. (f) Quantification of lipofuscin (LF) volume in microglia of 2-, 7- and 10-month-old PMD and wild-type mice (n = 3 mice per group; mean ± s.d.; two-way ANOVA; genotype effect, ***P < 0.0001, F = 221.6; followed by Bonferroni’s post hoc test; 2 months, P = 0.9232, t = 0.0465; 7 months, ***P = 0.0002, t = 9.653; 10 months, ***P < 0.0001, t = 16.18). Each dot represents the mean value of 40 cells. All images are representative of three independent experiments. n.s., nonsignificant (P = 0.9232).
Comment in
-
Microglia: Senescence Impairs Clearance of Myelin Debris.Curr Biol. 2016 Aug 22;26(16):R772-5. doi: 10.1016/j.cub.2016.06.066. Curr Biol. 2016. PMID: 27554659
References
Publication types
MeSH terms
Substances
Grants and funding
LinkOut - more resources
Full Text Sources
Other Literature Sources
Medical
Molecular Biology Databases
