. 2016 Aug;19(8):1050-1059.
doi: 10.1038/nn.4321. Epub 2016 Jun 13.

Zeb2 is essential for Schwann cell differentiation, myelination and nerve repair

Affiliations

Zeb2 is essential for Schwann cell differentiation, myelination and nerve repair

Susanne Quintes et al. Nat Neurosci. 2016 Aug.

Abstract

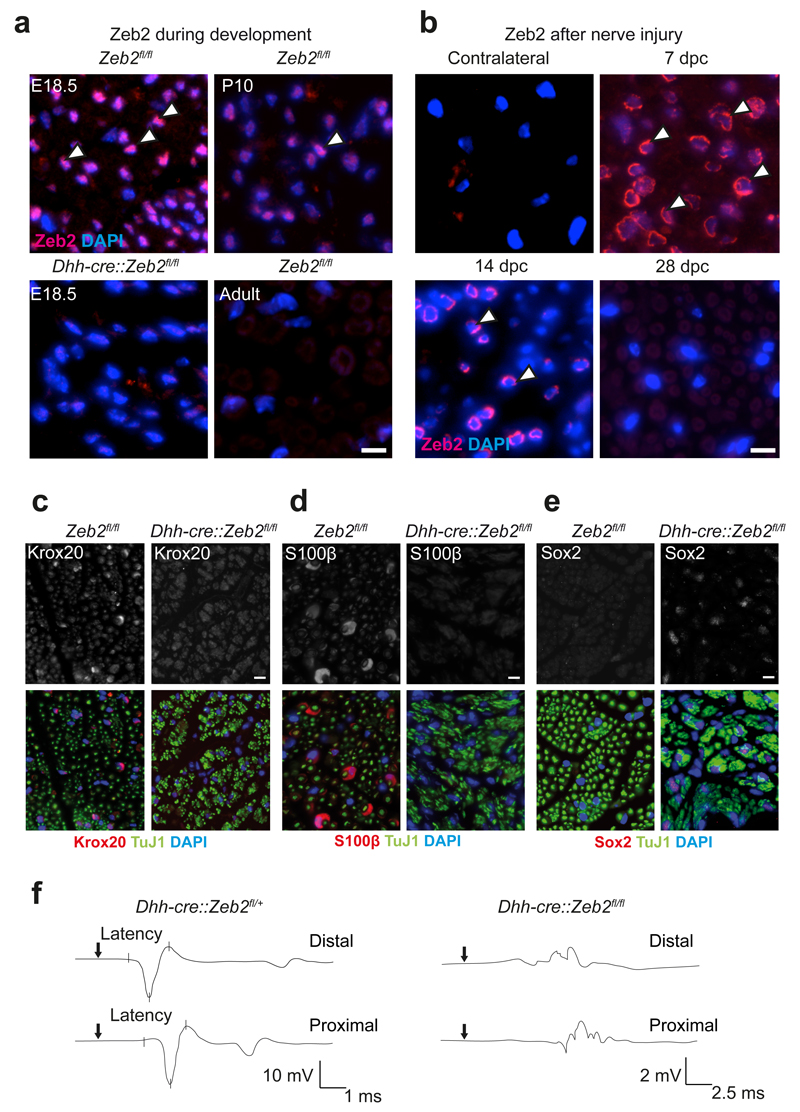
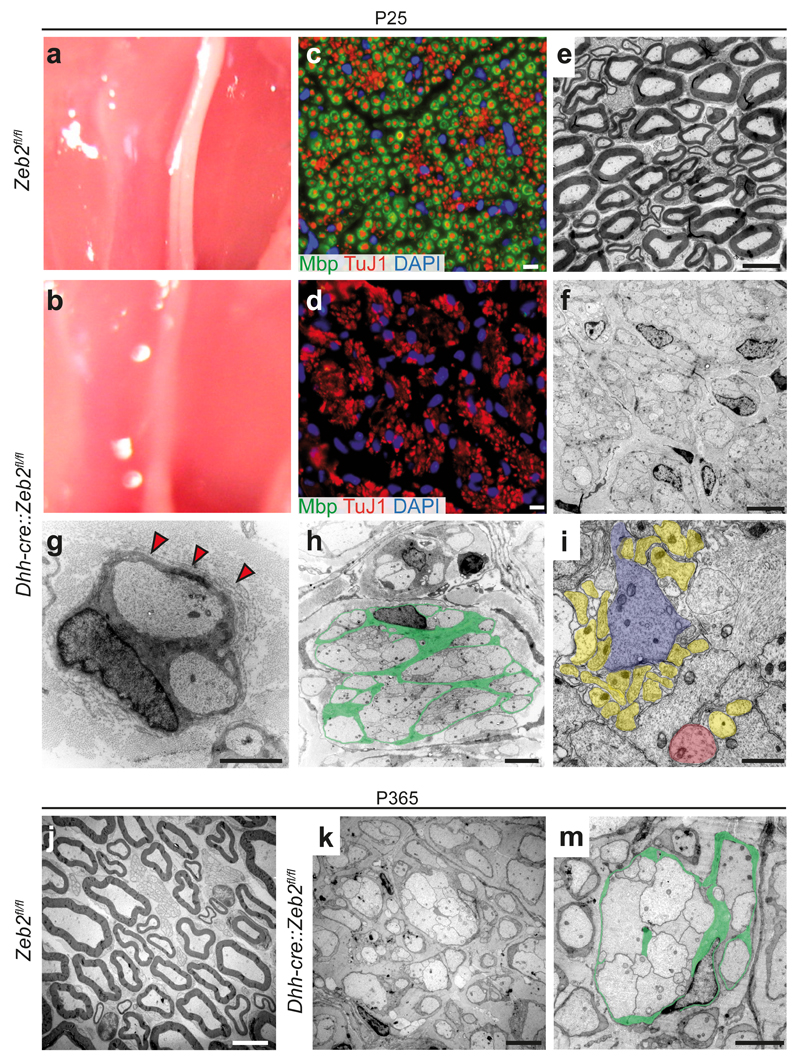
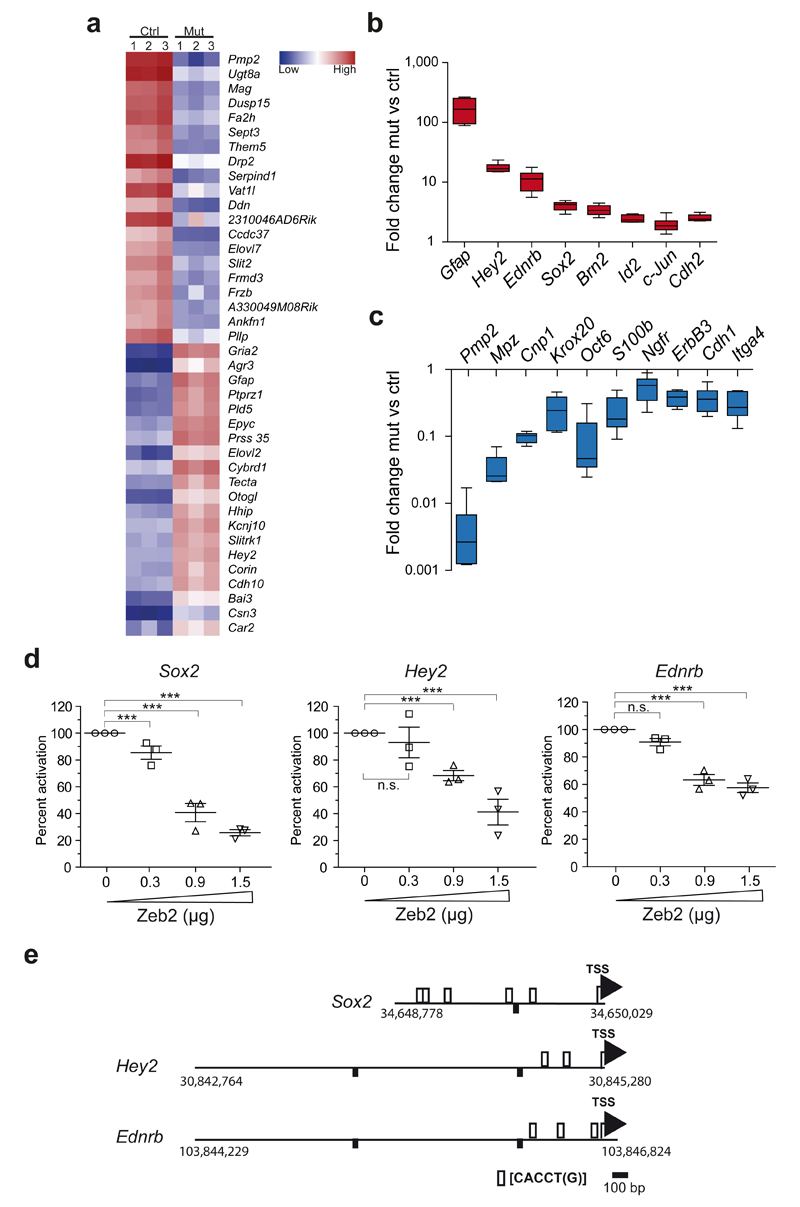
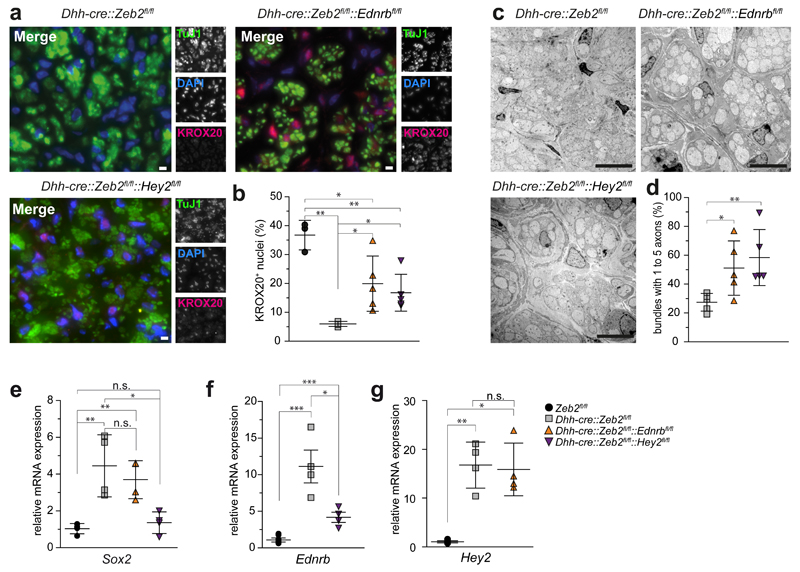
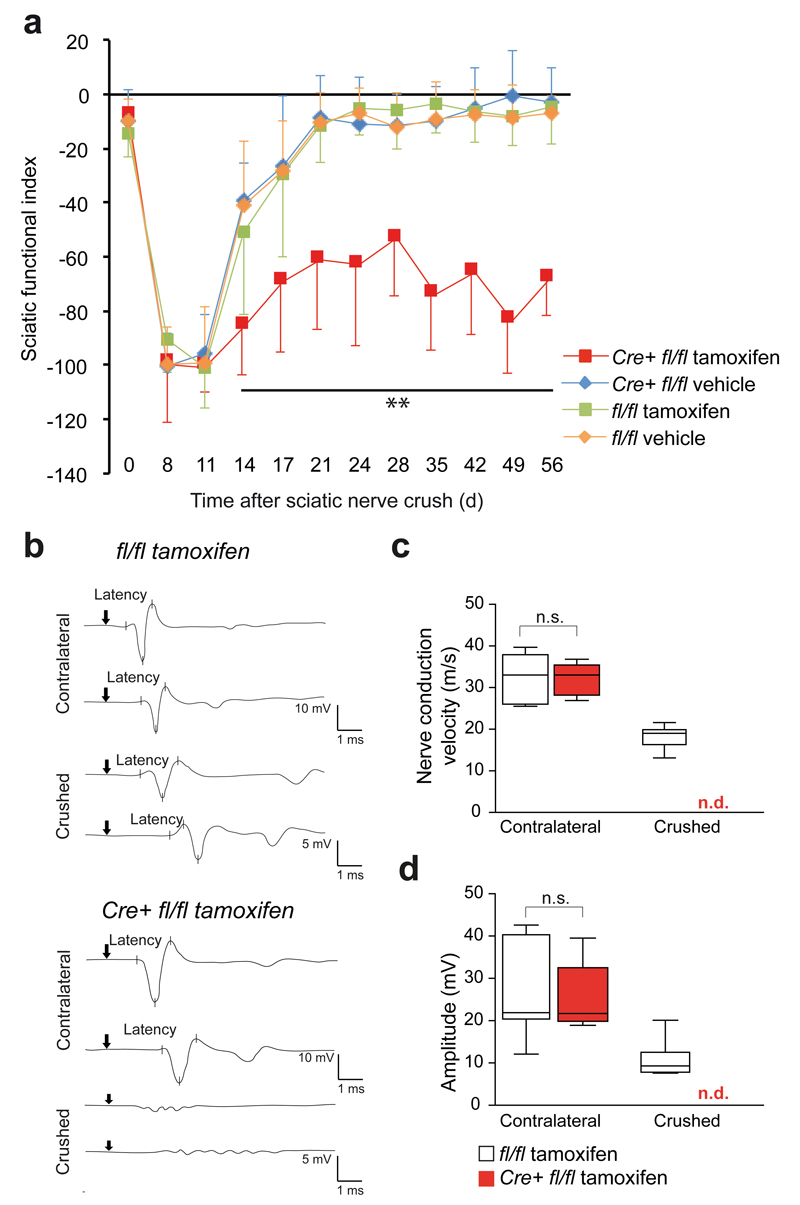
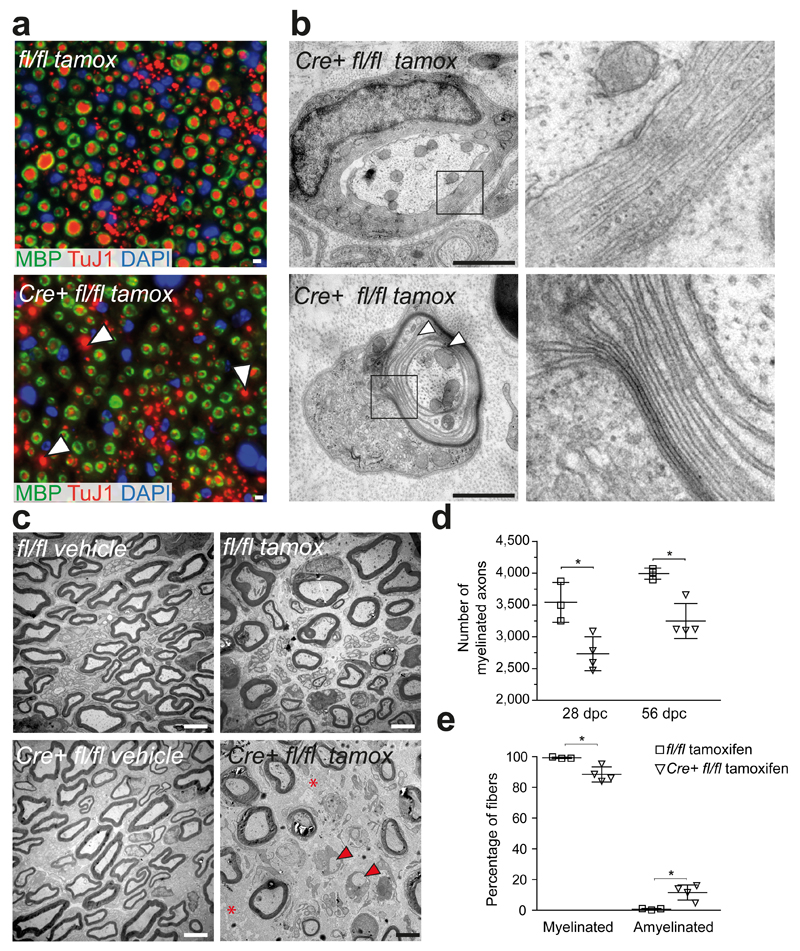
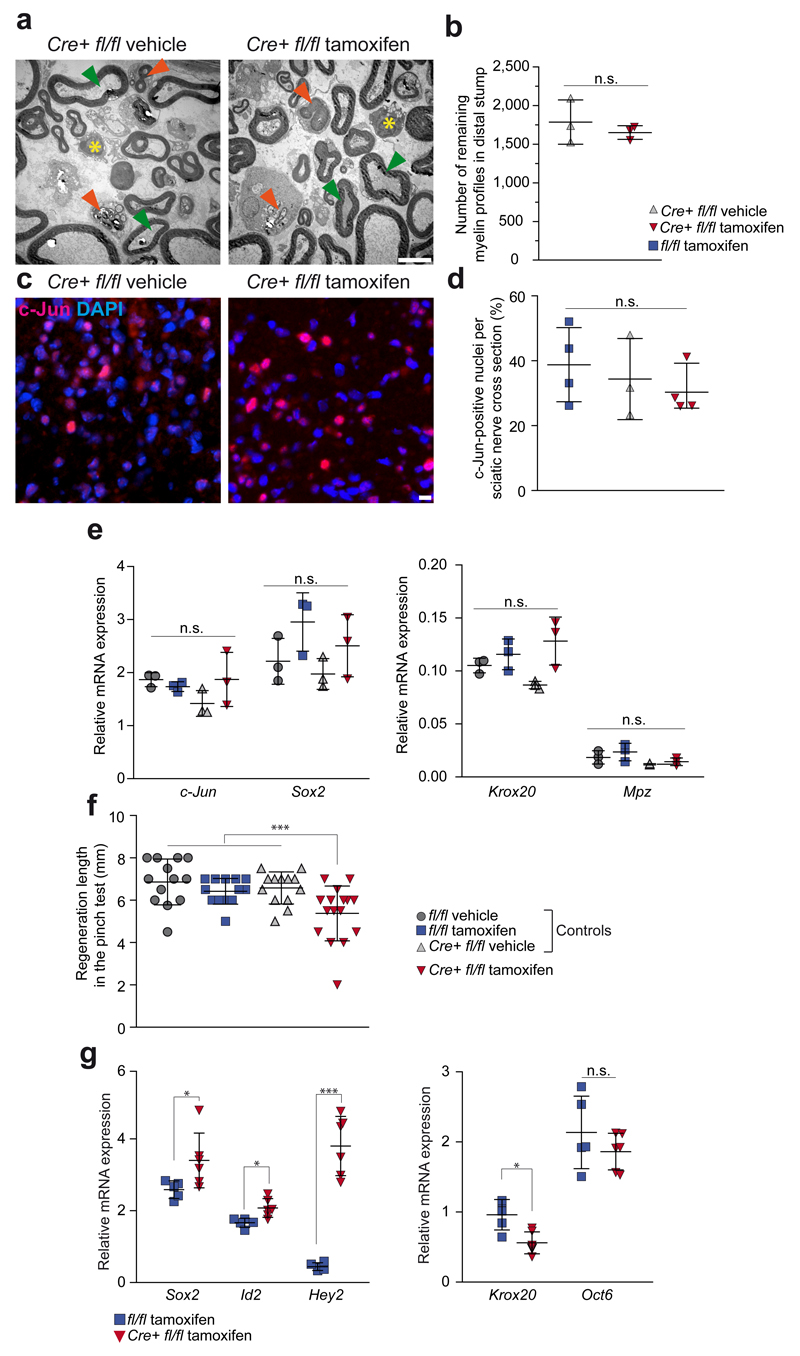
Schwann cell development and peripheral nerve myelination require the serial expression of transcriptional activators, such as Sox10, Oct6 (also called Scip or Pou3f1) and Krox20 (also called Egr2). Here we show that transcriptional repression, mediated by the zinc-finger protein Zeb2 (also known as Sip1), is essential for differentiation and myelination. Mice lacking Zeb2 in Schwann cells develop a severe peripheral neuropathy, caused by failure of axonal sorting and virtual absence of myelin membranes. Zeb2-deficient Schwann cells continuously express repressors of lineage progression. Moreover, genes for negative regulators of maturation such as Sox2 and Ednrb emerge as Zeb2 target genes, supporting its function as an 'inhibitor of inhibitors' in myelination control. When Zeb2 is deleted in adult mice, Schwann cells readily dedifferentiate following peripheral nerve injury and become repair cells. However, nerve regeneration and remyelination are both perturbed, demonstrating that Zeb2, although undetectable in adult Schwann cells, has a latent function throughout life.


Conflict of interest statement

The authors declare no competing financial interests.

Figures

Figure 1
Figure 1. Functional analysis of Zeb2 in Schwann cell development and nerve repair.
(a) Nuclear Zeb2 immunofluorescence (pink, white arrow heads) of sciatic nerve cross sections at different developmental stages. Zeb2 is absent from Schwann cells of Dhh-cre::Zeb2fl/fl mice at age E18.5 (lower left). Representative images of n=3 animals per time point and genotype. Scale bars, 10 µm. (b) Zeb2 reexpression at different time points after nerve crush in the distal stump of sciatic nerves (pink, white arrow heads, dpc: days post crush, contralateral: unharmed nerve). Representative images of n=3 animals per time point and genotype. Scale bars, 10 µm. (c)-(e) Immunohistochemistry of sciatic nerve cross sections from Dhh-cre::Zeb2fl/fl mice and controls at P25 comparing Krox20 (in c), S100β (in d) and Sox2 (in e), all in red/white (top). Axons, green (TuJ1). Schwann cell nuclei, blue (DAPI). Representative images of n=3 animals per genotype. Scale bars, 10 µm. Experiments in panels a-e were successfully repeated in 3 animals per genotype and time point. (f) Electrophysiological recording of CMAPs with proximally and distally stimulated sciatic nerves from Dhh-cre::Zeb2fl/+ (left) and Dhh-cre::Zeb2fl/fl mice (right) at age P25. Representative traces from measurements of 3 individual mice per genotype are shown.
Figure 2
Figure 2. Mice lacking Zeb2 in Schwann cells develop severe neuropathy.
(a, b) Compared to control sciatic nerves at age P25, Dhh-cre::Zeb2fl/fl mutant nerves are translucent. (c, d) By immunostaining, MBP-stained myelin (in green) surrounds TuJ1 stained axons (in red). Note the absence of myelin in (d). DAPI, Schwann cell nuclei. Scale bars, 10 µm. The experiment was successfully repeated in 3 animals per genotype and representative images are shown. (e, f) By electron microscopy, mutant nerves are amyelinated (in f). Scale bars, 2.5 µm. (g) Zeb2-deficient Schwann cell arrested in sorting with two engulfed axons and supernumerary loops of basal lamina (red arrow heads). Scale bar, 1 µm. (h) Mutant Schwann cell (cytoplasm false-coloured in green) surrounding without sorting>50 axons. Scale bar, 1 µm. (i) Bundle of unsorted axons that differ in size as indicated by false colours (yellow, small sized; red: medium sized; purple: large sized). Scale bar, 1 µm. (j-m) At one year of age, conditional mutants showed persistent lack of sorting and amyelination (in k, m). Green: Schwann cell cytoplasm false coloured. Axons appear intact. Scale bars, 2.5 µm. All electron micrographs shown in panels e-m are representative of 3 mice per genotype and age.
Figure 3
Figure 3. Zeb2-deficient Schwann cells continuously express developmental inhibitors.
(a) Heat map of a microarray analysis depicting the 20 most up-and downregulated genes in sciatic nerves of 3 Dhh-cre::Zeb2fl/fl mice (Mut) compared to littermate controls (Ctrl) at age P25. (b, c) A subset of promyelinating factors and developmental inhibitors was confirmed by quantitative realtime PCR. Note the logarithmic scale. Statistics, n=6 animals per genotype, except for GFAP n=3 mutants and 4 controls, two-sided student’s t-test of unpaired samples. P-values: Gfap P=0.026, t=3.461, Hey2 P=4.57E-05, t=12.67411, Ednrb P=0.002, t=5.740, Sox2 P=1.4E-05, t=8.247414, Brn2 P=0.0006, t=4.939481, Id2 P=0.0004, t=5.430061, c-Jun P=0.008, t=4.013638, Cdh2 P=8.18E-06, t=8,972395, Pmp2 P=3.5E-05, t=13.80419, Mpz P=0.0001, t=9.639648, Cnp1 P=9.56E-05, t=11.06300, Krox20 P=0.002, t=4.786690, Oct6 P=0.001, t=6.015117, S100β P=0.002, t=4.855561, Ngfr P=0.005, t=3.579138, ErbB3 P=0.0003, t=6.287818, Cdh1 P=0.0006, t=5.291520, Itga4 P=0.0003, t=6.020152. Whiskers show the minimum and maximum, boxes extend from the first to the third quartiles with cross lines at the median. (d) Luciferase assays revealing Zeb2 gene dosage-dependent reduction of promoter activity of Sox2, Hey2, and Ednrb in S16 cells upon cotransfection with a Zeb2 expression plasmid. Each dot represents 1 independent experiment with 3 replicates ±SEM with cross lines at the mean. Activity of lysates from cells co-transfected with the plasmid containing the respective promoter fragment and the empty pCMV5 plasmid was considered 100%. (n=3 independent experiments with 3 replicates, One-sided student's t-test of unpaired samples Ednrb: P=0.091, t=1.392353, P=2.48E-05, t=5.488391, P=2.6E-06, t=6.688200; Hey2: P=0.162, t=1.016833, P=2.88E-06, t=6.631628, P=2.16E-08, t=9.678931; Sox2: P=0.0005, t=3.977938, P=2.89E-11, t=15.28166, P=1.46E-14, t=25.04342, n.s. not significant). (e)Promoter fragments with murine genomic localization and predicted Zeb2 binding sites (as used in d).
Figure 4
Figure 4. Zeb2-mediated repression of Ednrb and Hey2 is functionally relevant.
(a) Virtual absence of Krox20 from Zeb2 cKO Schwann cells (upper left) and reemergence in a subpopulation of Schwann cells in both Zeb2/Ednrb (upper right) and Zeb2/Hey2 conditional double mutant mice (lower left). Green: axons (TuJ1). Blue: Schwann cell nuclei (DAPI). Red: Krox20. Scale bars, 5 µm. The experiment was successfully repeated with sections from 5 animals per genotype (except Zeb2fl/fl n=3 and Dhh-cre::Zeb2fl/fl n=4) and representative images are shown. (b) Quantification of the Krox20-positive nuclei shown in (a). Each dot represents one individual animal ±SD with cross lines at the mean. Statistics: n=5 animals per genotype (except Zeb2fl/fl n=3 and Dhh-cre::Zeb2fl/fl n=4). Significance: Zeb2fl/fl vs. Dhh-cre::Zeb2fl/fl P=0.008, t=12.17175, Dhh-cre::Zeb2fl/flvs. Dhh-cre::Zeb2fl/fl::Ednrbfl/fll P=0.03, t=2.858292, Dhh-cre::Zeb2fl/fl vs. Dhh-cre::Zeb2fl/fl::Hey2fl/fl P=0.013, t=3.299356, Zeb2fl/fl vs. Dhh-cre::Zeb2fl/fl::Hey2fl/fl P=0.004, t=4.564169, Zeb2fl/fl vs. Dhh-cre::Zeb2fl/fl::Ednrbfl/fl P=0.03, t=2.760013 (two-sided student’s t-test of unpaired samples, * P <0.05; ** P <0.01; *** P <0.001). (c) Improved radial sorting and smaller axon bundles in sciatic nerves of conditional Zeb2/Ednrb (upper right) and Zeb2/Hey2 (lower left) double mutant mice compared to conditional Zeb2 single mutants (upper left) at age P25. Scale bars, 5 µm. Representative images of 5 mice per genotype. (d) Higher number of bundles with only 1 to 5 axons per Schwann cell in both double mutant mice at age P25 compared to Zeb2 single mutants. Statistics: n=5 animals per genotype (on average 26 randomly chosen bundles per animal, each dot represents the mean percentage of bundles from one individual animal ±SD with cross lines at the mean). Dhh-cre::Zeb2fl/fl vs. Dhh-cre::Zeb2fl/fl::Ednrbfl/fl P=0.0283, t=2.670897, Dhh-cre::Zeb2fl/fl vs. Dhh-cre::Zeb2fl/fl::Hey2fl/fl P=0.0031, t=4.185530 (Two-sided student’s t-test of unpaired samples, * P <0.05; ** P <0.01). (e) Sox2 expression at age P25 was significantly upregulated in Dhh-cre::Zeb2fl/fl mice and Dhh-cre::Zeb2fl/fl::Ednrbfl/fl mice, but not in Dhh-cre::Zeb2fl/fl::Hey2fl/fl mice compared to Zeb2fl/fl mice. Significance: Zeb2fl/fl vs. Dhh-cre::Zeb2fl/fl P=0.0071, t=3.999399, Dhh-cre::Zeb2fl/fl vs. Dhh-cre::Zeb2fl/fl::Ednrbfl/fl P=0.480, t=0.7625912, Dhh-cre::Zeb2fl/fl vs. Dhh-cre::Zeb2fl/fl::Hey2fl/fl P=0.0133, t=3.467755, Zeb2fl/fl vs. Dhh-cre::Zeb2fl/fl::Hey2fl/fl P=0.3598, t=0.9913170, Zeb2fl/fl vs. Dhh-cre::Zeb2fl/fl::Ednrbfl/fl P=0.0025, t=4.978021 (n=4 mice per genotype, two-sided Student’s t-test of unpaired samples, * P <0.05; ** P <0.01, n.s. not significant). (f) Ednrb expression at age P25 was significantly upregulated in Dhh-cre::Zeb2fl/fl mice and Dhh-cre::Zeb2fl/fl::Hey2fl/fl mice compared to controls (n=4 Zeb2fl/fl mice and 4 Zeb2fl/fl::Hey2fl/fl mice). Expression in Dhh-cre::Zeb2fl/fl::Hey2fl/fl mice was significantly lower than in DhhCre::Zeb2fl/fl mice (n=4 mice per genotype: controls vs. Dhh-cre::Zeb2fl/fl P=2.5588E-5, t=7.314075, Dhh-cre::Zeb2fl/fl vs. Dhh-cre::Zeb2fl/fl::Hey2fl/fl P=0.0163, t=3.303197, controls vs. Dhh-cre::Zeb2fl/fl::Hey2fl/fl P=9.4176E-5, t=6.257124, two-sided Student’s t-test of unpaired samples, * P <0.05; *** P <0.001). (g) Hey2 expression at age P25 was significantly higher in Dhh-cre::Zeb2fl/fl::Ednrbfl/fl mice compared to controls (n=4 Zeb2fl/fl mice and 4 Zeb2fl/fl::Ednrbfl/fl mice). and not significantly different from Dhh-cre::Zeb2fl/fl mice. Significance: controls vs. Dhh-cre::Zeb2fl/fl P=0.00676, t=9.932308, Dhh-cre::Zeb2fl/fl vs. Dhh-cre::Zeb2fl/fl::Ednrbfl/fl P=0.8133, t=0.2467216, controls vs. Dhh-cre::Zeb2fl/fl::Ednrbfl/fl P=0.047, t=8.177906 (n=4 mice per genotype, two-sided student’s t-test of unpaired samples, * P <0.05; ** P <0.01, n.s. not significant).
Figure 5
Figure 5. Zeb2 is required for efficient recovery after nerve injury.
(a) Functional recovery after nerve crush is significantly perturbed in tamoxifen-treated PLP-creERT2::Zeb2fl/fl mice (Cre+ fl/fl tamoxifen, in red) in comparison to 3 control groups, as determined by the sciatic functional index. Dots depict mean ±SD, n=a minimum of 10 animals per group. (one-way ANOVA day 0: P=0.3064, F(3,38)=1.246703, day 8: P=0.3577, F(3,39)=1.107561, day 11 P=0.8386, F(3,44)=0.2813102, day 14 P=0.0001, F (3,39)=8.903, day 17 P=0.0001, F(3,45)=8.481348, day 21 P=4.23781E-10, F(3,46)=26.47369, day 24, P=1.52347E-8, F(3,37)=22.85789, day 28, P=6.29699E-9, F(3,41)=23.14702, day 35 P=3.00629E-14, F(3,40)=54.95588, day 42, P=5.11929E-12, F(3,41)=38.61261, day 49, P=4.01117E-16, F(3,40)=71.49940, day 56 P=7.98803E-15, F(3,39)=61.31167. (b) Electrophysiological recordings of CMAPs after sciatic nerve stimulation 52 days after crush injury. Note the persistent conduction blocks in tamoxifen-treated PLP-creERT2::Zeb2fl/flmice (bottom) in contrast to control nerves that had regained functional nerve conduction. Representative traces of 8 Zeb2fl/fl tamoxifen-treated mice and 5 PLP-creERT2::Zeb2fl/fl tamoxifen-treated mice are shown. (c) Nerve conduction velocity was regained to about 54% in control nerves but could not be determined (n.d.) in conditional Zeb2 mutants. Whiskers show the minimum and maximum, boxes extend from the first to the third quartiles with cross lines at the median. (Zeb2fl/fl tamoxifen-treated: n=7 animals, PLP-creERT2::Zeb2fl/fl animals tamoxifen-treated: n=5, two-sided student’s t-test of unpaired samples P=0.8737, t=0.16361498, n.s. not significant). (d) CMAP amplitudes as a measure of functional renervation were partly restored in control mice but remained undetectable (n.d.) in conditional Zeb2 mutants. Whiskers show the minimum and maximum, boxes extend from the first to the third quartiles with cross lines at the median. (Zeb2fl/fl tamoxifen-treated: n=7 animals, PLP-creERT2::Zeb2fl/fl animals tamoxifen-treated: n=5, two-sided student’s t-test of unpaired samples P=0.9022, t=0.1260085, n.s. not significant).
Figure 6
Figure 6. Remyelination by Zeb2-deficient Schwann cells is impaired
(a) In contrast to control mice, 56 days after sciatic nerve crush injury (top), tamoxifen-treated PLP-creERT2::Zeb2fl/fl mice (bottom) have many amyelinated fibers remaining (white arrow heads), as visualized by costaining axons (TuJ1, red) and myelin sheaths (MBP, green). The experiment was successfully repeated with sections from 3 animals per group and representative images (see also quantification in d) are shown. Scale bars, 5 µm. (b) By electron microscopy 56 days after nerve crush, mutant mice still exhibit signs of ongoing remyelination, such as cytoplasm-filled myelin wraps (top) and thinly compact sheaths (bottom). Boxed areas are magnified to the right. Scale bars, 1 µm. (c) In contrast to various controls that regenerate well, tamoxifen-treated PLP-creERT2::Zeb2fl/fl mice (bottom right) exhibit axon-free fibrotic areas (red asterisks) and unmyelinated axons (red arrow heads). Scale bars, 2.5 µm. Electron micrographs in panels b and c are representative of 4 animals per treatment and genotype. (d) Impaired axonal regeneration and remyelination in mutant mice. Note that fewer myelinated axons (>1 µm) are seen 28 and 56 days after sciatic nerve crush on semi-thin sections. Each dot represents 1 individual mouse ±SD (Zeb2fl/fl tamoxifen-treated: n=3, PLP-creERT2::Zeb2fl/fl tamoxifen-treated: n=4, two-tailed student’s t-test of unpaired samples, 28 days: P=0.014, t=3.697461, 56 days: P=0.0063, t=4.520971 * P <0.05). (e) Confirmation at the EM level (56 dpc), where amyelinated axons can be clearly visualized (same animals as in d). Each dot represents 1 individual mouse ±SD (25 randomly chosen electron micrographs at 3000x magnification per animal, amyelinated P=0.0137, t=3.721040 myelinated P=0.0137, t=3.721040, two-tailed student’s t-test of unpaired samples, * P <0.05).
Figure 7
Figure 7. Dedifferentiation and redifferentiation of Zeb2-deficient Schwann cells
(a) Imaged 3 days after sciatic nerve transection (dedifferentiation), the amount of myelin debris (orange arrow heads) and residual myelin profiles (green arrow heads) appears similar in the distal nerve segment of (vehicle-treated) controls (left panel) and tamoxifen-treated PLP-creERT2::Zeb2fl/fl mutants (right panel). Yellow asterisks: invading macrophages. Scale bar, 5 µm. Representative images of 3 mice per group. (b) When quantified in the distal sciatic nerve stump, the number of residual myelin profiles is not different (each dot represents 1 individual animal ±SD, P=0.50456, t=0.7819589, n=3 mice per group, two-sided student’s t-test of unpaired samples, n.s. not significant). (c) Nuclear c-Jun immunofluorescence on cross sections of the distal sciatic nerve segment 3 days after nerve crush shows a similar number of dedifferentiating Schwann cells (c-Jun: pink, DAPI: blue, the experiment was repeated successfully on sections of 4 mice per group, except for Cre+ fl/fl vehicle n=3, scale bar, 5 µm). (d) Quantification of c-Jun-positive nuclei on sections of the distal sciatic nerve segment 3 days after nerve crush as depicted in (c) shows a similar number for tamoxifen-treated PLP-creERT2::Zeb2fl/fl mutants and two corresponding control groups (n=4 mice per group, except for Cre+ fl/fl vehicle n=3, each dot represents one individual animal ±SD, one-way ANOVA P=0.5366, F(2,8)=0.6735603). (e) After 3 days, normal Schwann cell dedifferentiation is also suggested by the elevated steady-state levels of c-Jun and Sox2 mRNAs. Krox20 and Mpz mRNAs were similarily downregulated in all groups. Expression in the contralateral nerve was defined as 1.0. Each dot represents sciatic nerve mRNA from 1 individual mouse with cross lines at the mean ±SD (n=3 mice per group, Kruskal-Wallis one-way ANOVA, c-Jun: P=0.1473, H=5.358974, Sox2: P=0.1319, H=5.615385, Krox20: P=0.0572, H=7.512821, Mpz: P=0.1129, H=5.974, n.s. not significant). (f) Delayed functional recovery of sciatic nerves after crush, as assessed by the "pinch test" reflecting axon regrowth. In tamoxifen-treated PLP-creERT2::Zeb2fl/fl mice (in red) regenerative length 4 days after nerve crush does not reach various control values (in grey/blue). Each dot represents the regeneration distance of 1 individual mouse with cross lines at the mean ±SD (n=13 mice per group except fl/fl tamoxifen: n=16, one-way ANOVA P=0.001, F(3,51)=6.356539, *** P=0.001). (g) After 56 days, levels of Sox2 and Id2 were strongly upregulated in injured nerves, but even more so in tamoxifen-treated PLP-creERT2::Zeb2fl/fl mutant mice. Hey2 levels were downregulated in injured control nerves, but highly upregulated in tamoxifen-treated PLP-creERT2::Zeb2fl/fl mutant mice. Krox20 levels remained low in nerves of mutants, while Oct6 was still upregulated to comparable levels in both genotypes. Each dot represents cDNA from 1 individual mouse run in triplicate ±SD with cross lines at the mean. Expression in the contralateral nerve was defined as 1.0. (Cre+ fl/fl tamoxifen: n=6; fl/fl tamoxifen: n=5; contralateral, n=5, Sox2: P=0.0493, t=2.271339, Id2: P=0.0109, t=3.197971, Hey2: P=0.00072063, t=8.963330, Krox20: P=0.0062, t=3.547758, Oct6:P=0,2807, t=1.147759, * P <0.05; *** P <0.001, n.s. not significant).

Similar articles

Cited by

References

    1. Jessen KR, Mirsky R. Negative regulation of myelination: Relevance for development, injury, and demyelinating disease. Glia. 2008;56:1552–1565. - PubMed
    1. Monk KR, Feltri ML, Taveggia C. New insights on schwann cell development. Glia. 2015;63:1376–1393. - PMC - PubMed
    1. Stolt CC, Wegner M. Schwann cells and their transcriptional network: Evolution of key regulatorsof peripheral myelination. Brain Research. 2015:1–10. doi: 10.1016/j.brainres.2015.09.025. - DOI - PubMed
    1. Topilko P, et al. Krox-20 controls myelination in the peripheral nervous system. Nature. 1994;371:796–799. - PubMed
    1. Decker L. Peripheral Myelin Maintenance Is a Dynamic Process Requiring Constant Krox20 Expression. Journal of Neuroscience. 2006;26:9771–9779. - PMC - PubMed

Publication types

MeSH terms