. 2016 Jul 1;126(7):2626-41.
doi: 10.1172/JCI84637. Epub 2016 Jun 13.

Notch promotes tumor metastasis in a prostate-specific Pten-null mouse model

Notch promotes tumor metastasis in a prostate-specific Pten-null mouse model

Oh-Joon Kwon et al. J Clin Invest. .

Abstract

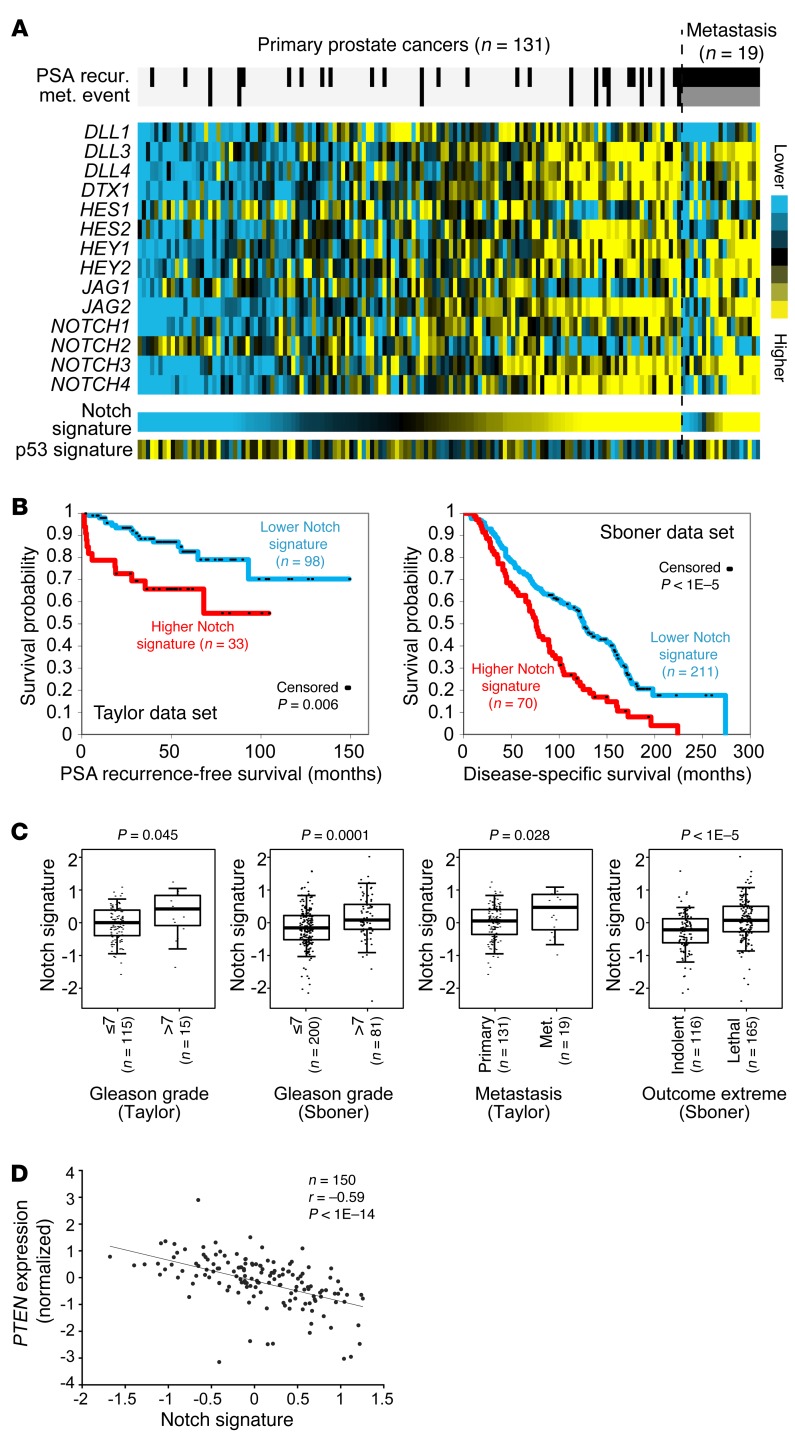
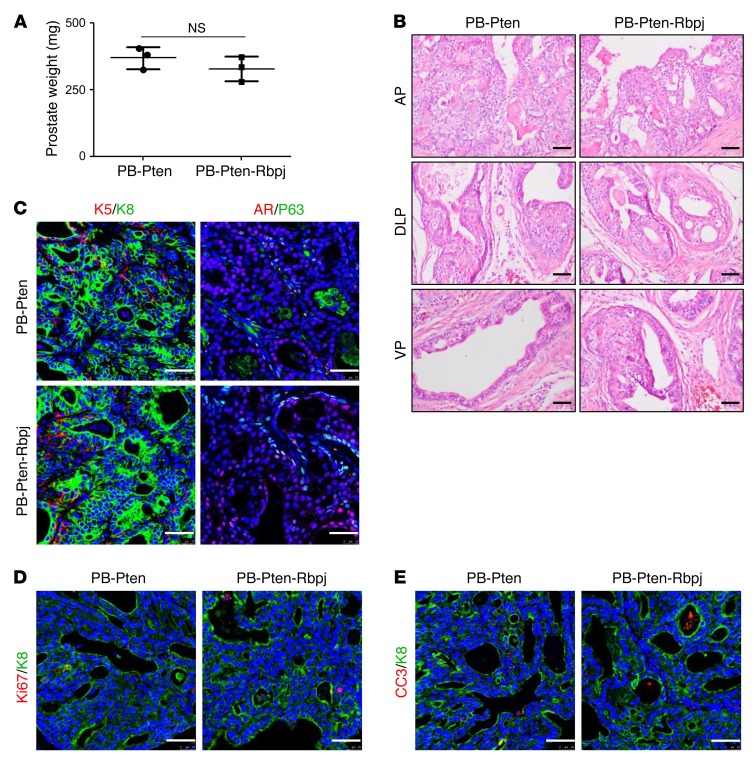
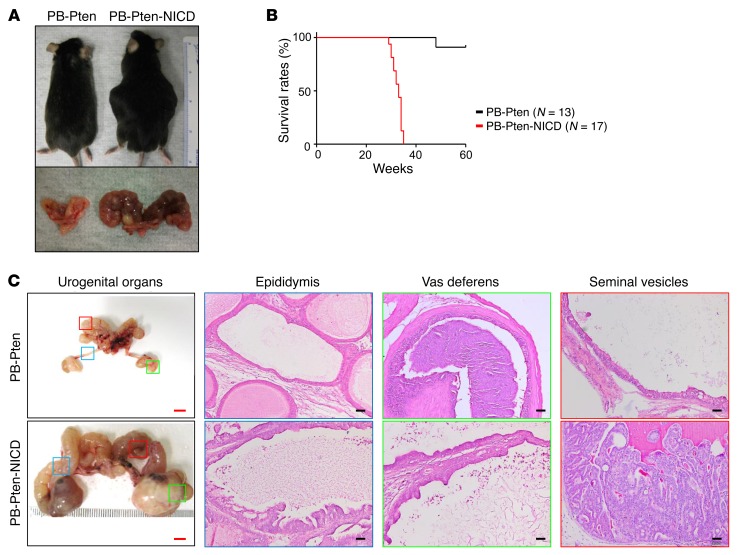
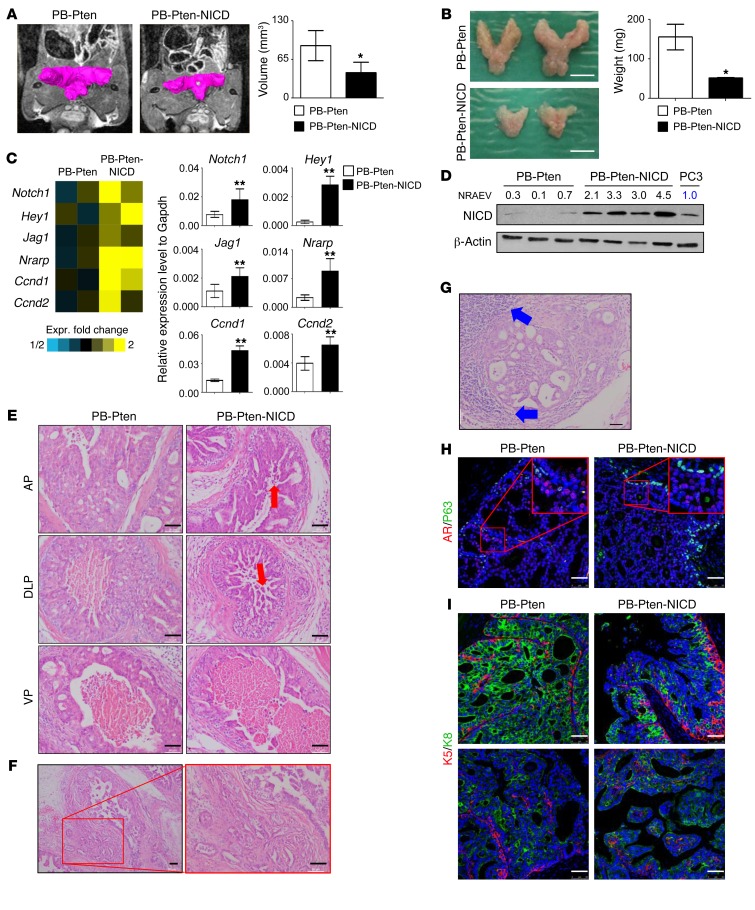
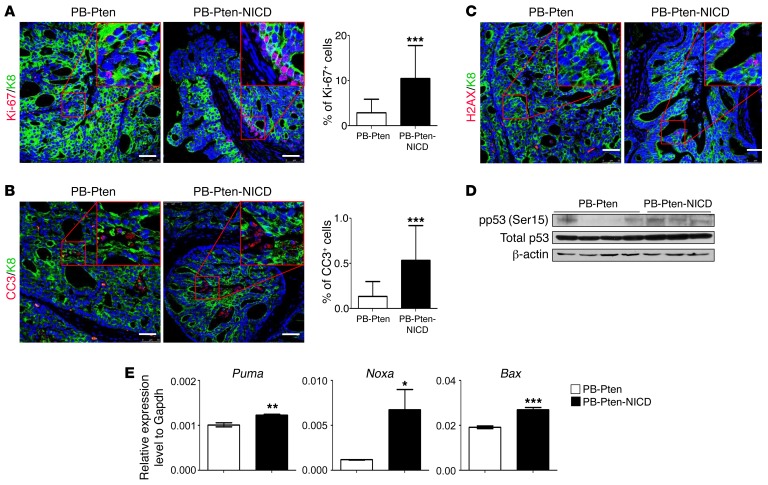
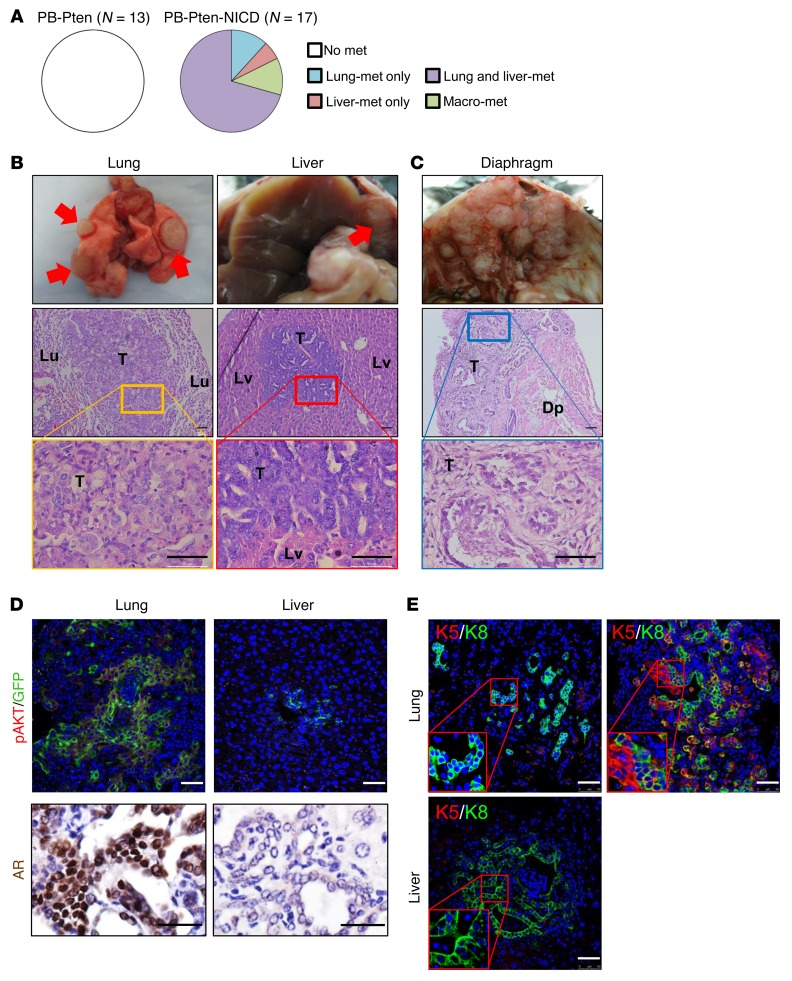
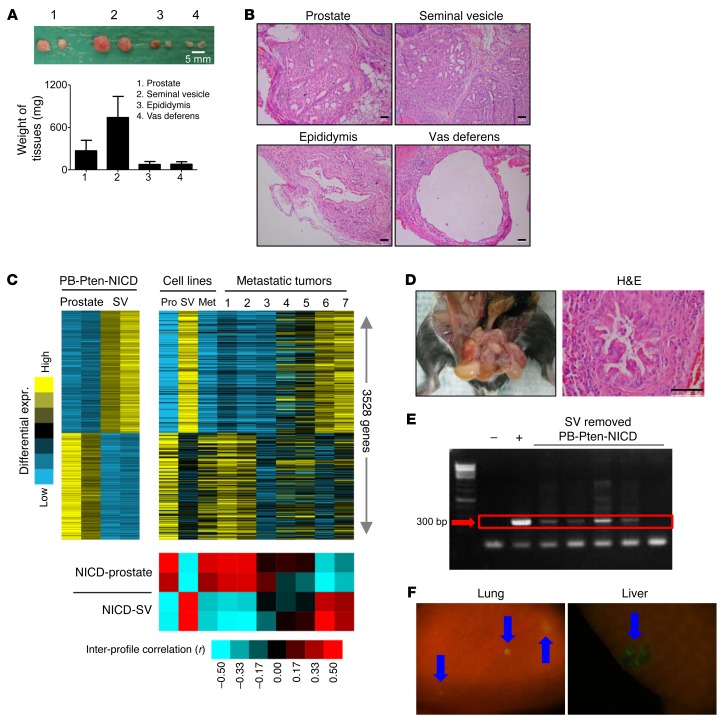
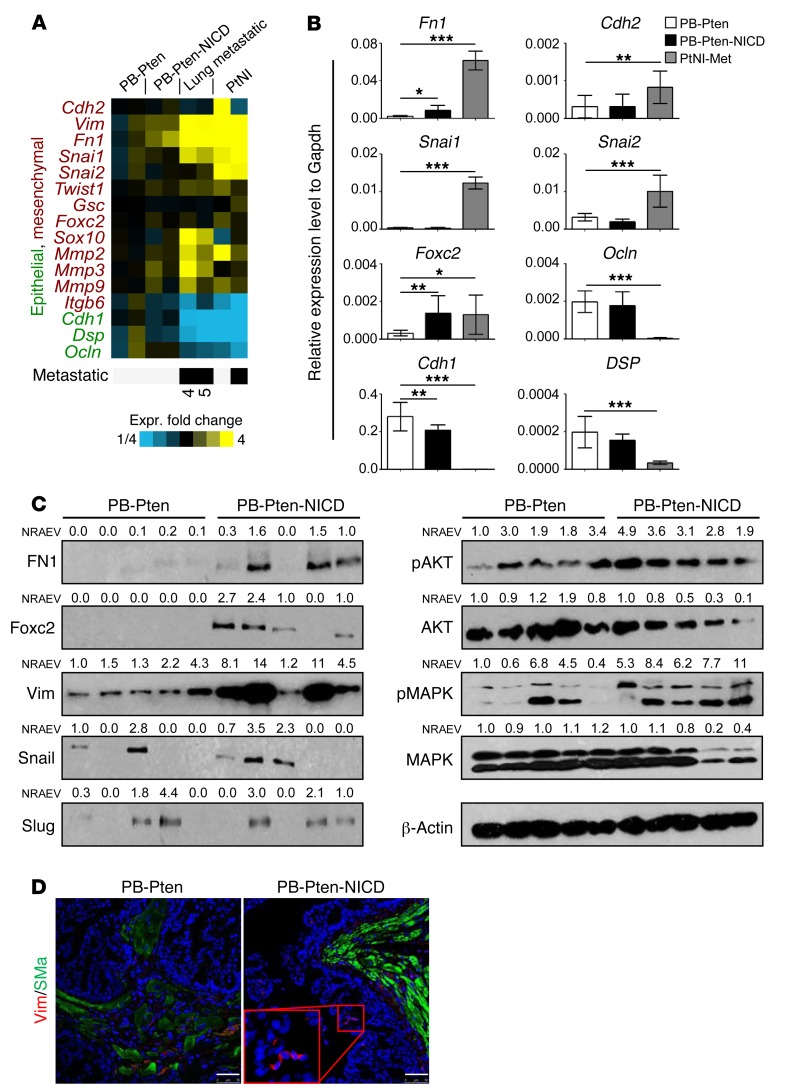
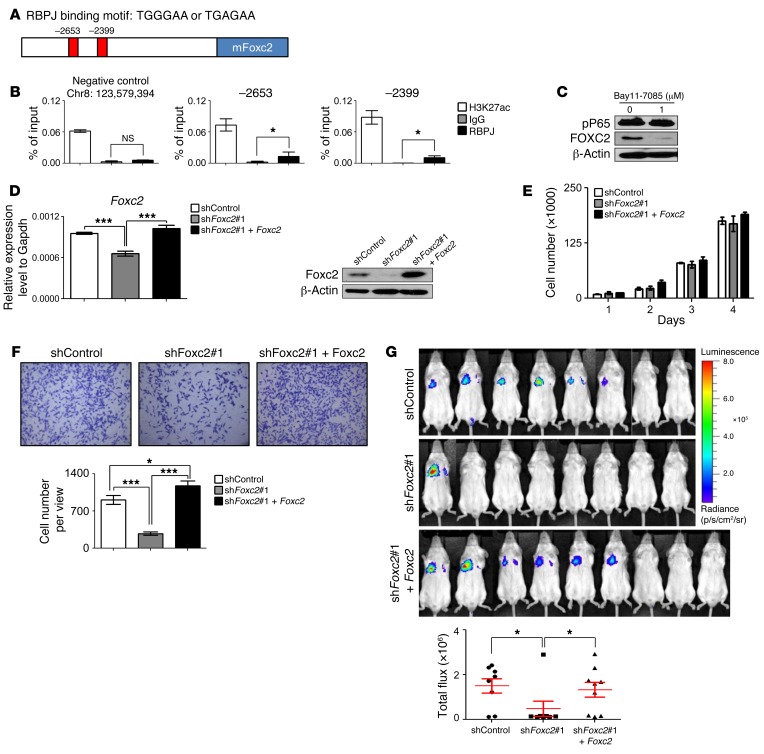
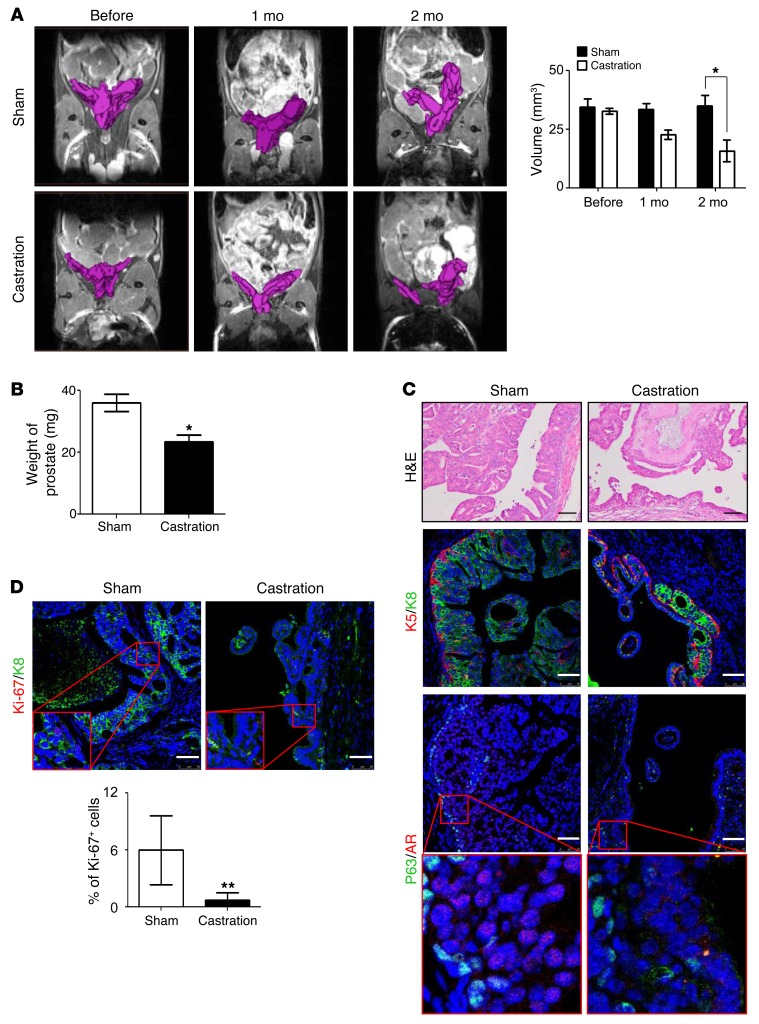
Although Notch signaling is deregulated in prostate cancer, the role of this pathway in disease development and progression is not fully understood. Here, we analyzed 2 human prostate cancer data sets and found that higher Notch signaling correlates with increased metastatic potential and worse disease survival rates. We used the Pten-null mouse prostate cancer model to investigate the function of Notch signaling in the initiation and progression of prostate cancer. Disruption of the transcription factor RBPJ in Pten-null mice revealed that endogenous canonical Notch signaling is not required for disease initiation and progression. However, augmentation of Notch activity in this model promoted both proliferation and apoptosis of prostate epithelial cells, which collectively reduced the primary tumor burden. The increase in cellular apoptosis was linked to DNA damage-induced p53 activation. Despite a reduced primary tumor burden, Notch activation in Pten-null mice promoted epithelial-mesenchymal transition and FOXC2-dependent tumor metastases but did not confer resistance to androgen deprivation. Notch activation also resulted in transformation of seminal vesicle epithelial cells in Pten-null mice. Our study highlights a multifaceted role for Notch signaling in distinct aspects of prostate cancer biology and supports Notch as a potential therapeutic target for metastatic prostate cancer.


Figures

Figure 1
Figure 1. Higher Notch signaling predicts poor clinical outcomes.
(A) Expression heat map of mRNA expression for major Notch signaling components in the Taylor data set of prostate cancer specimens (22). Notch signature score was generated by averaging of the normalized expression values of the genes shown. A gene signature of p53 transcriptional targets (http://p53.iarc.fr/TargetGenes.aspx) is inversely correlated with the Notch signature as shown. (B) Kaplan-Meier plots for correlations of Notch signature with prostate cancer recurrence in the Taylor data set (22) (left) and survival in the Sboner data set (23) (right). Log-rank test: P < 1 × 10⁻⁵. (C) Box plots show correlations of Notch signature with increasing Gleason grade, metastatic potential, and lethal outcome. P values are by t test. Box plots represent 5%, 25%, 75%, median, and 95%. (D) Scatter plot shows an inverse correlation between Notch signature and PTEN expression levels (Spearman’s correlation, r = –0.59, P < 1 × 10⁻¹⁰).
Figure 2
Figure 2. Notch signaling is dispensable for initiation and progression of prostate cancer in the Pten-null model.
(A) Bar graph shows means ± SD of prostate weight of 1-year-old PB-Pten and PB-Pten-Rbpj mice. n = 3 per group. No significant difference is noted between the 2 groups (Student’s t test). (B) H&E staining of anterior (AP), dorsolateral (DLP), and ventral (VP) prostate tissues from 1-year-old PB-Pten and PB-Pten-Rbpj mice. (CE) Coimmunostaining of K5 and K8, P63, and AR (C); Ki-67 and K8 (D); and cleaved caspase 3 (CC3) and K8 (E) of prostate tissues from 1-year-old PB-Pten and PB-Pten-Rbpj mice. Scale bars: 50 μm.
Figure 3
Figure 3. Notch activation shortens lifespan of PB-Pten mice.
(A) Images of PB-Pten and PB-Pten-NICD mice (top) and dissected urogenital organs (bottom). (B) Kaplan-Meier survival curve of PB-Pten and PB-Pten-NICD mice. Log-rank test: P < 1 × 10⁻⁴. (C) Transillumination images of urogenital systems and H&E staining of epididymides, vasa deferentia, and seminal vesicles of PB-Pten and PB-Pten-NICD mice. Red bars: 5 mm; black bars: 100 μm.
Figure 4
Figure 4. Notch activation results in a reduction of primary tumor burden in the Pten-null model.
(A) Magnetic resonance imaging of prostate tissues in PB-Pten and PB-Pten-NICD mice at 16 weeks of age. Bar graphs show means ± SD of tumor volume from 3 mice. *P < 0.05 by Student’s t test. (B) Representative images of prostate tissues from PB-Pten and PB-Pten-NICD mice at 16 weeks of age. Bar graphs show means ± SD of prostate weight from 3 mice per group. *P < 0.05 by Student’s t test. Scale bar: 5 mm. (C) Heat map from microarray data shows upregulation of representative Notch target genes in PB-Pten-NICD mouse prostates. qRT-PCR validates expression changes of representative genes in microarray analysis from 3 different samples per group. **P < 0.001 by Student’s t test. (D) Western blot analysis of NICD in prostate tissues of 16-week-old mice. Each lane represents an independent specimen. NRAEV, normalized relative arbitrary expression value by β-actin. (E) H&E staining of anterior (AP), dorsolateral (DLP), and ventral (VP) prostate tissues from 16-week-old PB-Pten and PB-Pten-NICD mice. Red arrows point to acini inside lumen. (F) H&E staining shows prostate adenocarcinoma in 32-week-old PB-Pten-NICD mice. (G) H&E staining shows lymphocytic infiltration (blue arrows) in prostate tumor tissues in 32-week-old PB-Pten-NICD mice. (H and I) IHC analyses of P63 and AR (H), K5 and K8 (I) in prostate tissues of 16-week-old PB-Pten and PB-Pten-NICD mice. Scale bars: 50 μm.
Figure 5
Figure 5. Notch activation promotes both proliferation and apoptosis of Pten-null prostate cancer cells.
(A and B) Coimmunostaining of Ki-67 and K8 (A) and cleaved caspase 3 (CC3) and K8 (B) in 16-week-old PB-Pten and PB-Pten-NICD mouse prostates. Bar graphs show means ± SD of Ki-67+ and CC3+ cells in 3 mice per group. ***P < 0.001 by Student’s t test. (C) Coimmunostaining of pH2AX and K8 in 16-week-old PB-Pten and PB-Pten-NICD mouse prostates. (D) Western blot analysis of pSer15 p53 and total p53 in prostate tissue lysates from 16-week-old PB-Pten and PB-Pten-NICD mice. (E) qRT-PCR analysis of 3 p53 target genes in prostate tissues of 16-week-old PB-Pten and PB-Pten-NICD mice. n = 3 per group. *P < 0.05, **P < 0.01, ***P < 0.001 by Student’s t test. Scale bars: 50 μm.
Figure 6
Figure 6. Notch activation promotes metastatic diseases in the Pten-null model.
(A) Pie charts summarize incidence of distal metastases in PB-Pten and PB-Pten-NICD mice. (B) Transillumination images of lung (Lu) and liver (Lv) with focal metastatic nodules (top) and H&E staining of the metastatic lesions (lower panels). (C) Transillumination image (top) and H&E staining (lower panels) of a diaphragm (Dp) colonized with metastatic lesions. T, tumor. (D) IHC analysis of pAKT, GFP, and AR in lung and liver metastases. (E) IHC analysis of K5 and K8 in lung and liver metastases. Scale bars: 50 μm.
Figure 7
Figure 7. The prostate serves as a tissue of origin for lung metastases in the PB-Pten-NICD model.
(A) Image of xenografts outgrown from tissue fragments of prostates, seminal vesicles, epididymides, and vasa deferentia of 4-week-old PB-Pten-NICD mice. Bar graphs show means ± SD of tissue weight. (B) H&E staining of xenografts. (C) Heat map on the left shows 3,528 genes differentially expressed in prostate versus seminal vesicles (SVs) (fold 1.4 each prostate profile vs. each SV profile). Heat map on the right shows expression of these genes with the same gene ordering in 7 lung metastases and 3 cell lines derived from PB-Pten-NICD mice. Red-blue heat map shows intersample profile correlations based on the 3,528 genes (by Pearson’s coefficient; red, positive). (D) Left shows absence of seminal vesicles in a mouse that has undergone surgical removal of seminal vesicle. H&E staining (right) shows histology of prostate tissue from this mouse. (E) PCR analysis of Pten deletion allele in circulating blood cells of PB-Pten-NICD mice that have undergone seminal vesicle resection. (F) Fluorescent images of lung and liver tissues from a 34-week-old PB-Pten-NICD-mTmG mouse that has undergone surgical removal of seminal vesicles at 4 weeks of age. Blue arrows denote GFP-positive tumor foci. Scale bars: 50 μm.
Figure 8
Figure 8. Notch promotes epithelial-mesenchymal transition.
(A) Heat map of expression of EMT-related genes in prostate tissue of PB-Pten mice (PB-Pten) and PB-Pten-NICD mice (PB-Pten-NICD), 2 prostate-derived lung metastases (lung metastatic) from PB-Pten-NICD mice (nos. 4 and 5 in Figure 7C), and 2 cell lines (PtNI) established from prostate primary and metastatic prostate tumors of PB-Pten-NICD mice. (B) qRT-PCR analysis confirms differential expression of 8 genes. Bar graphs show means ± SD of gene expression in prostate tissues of PB-Pten and PB-Pten-NICD mice (n = 12 each), and the PtNI-Met cell line established from metastatic prostate tumors in PB-Pten-NICD mice (9 independent assays on the same cell line). *P < 0.05, **P < 0.01, ***P < 0.001 by ANOVA with Dunnett’s correction for multiple comparisons. (C) Western blot analysis of fibronectin (FN1), FOXC2, vimentin (Vim), Snail, Slug, AKT, and MAPK in prostate lysates of 16-week-old PB-Pten and PB-Pten-NICD mice. Each lane represents an independent specimen. NRAEV, normalized relative arbitrary expression value by β-actin. (D) Coimmunostaining of vimentin and α-smooth muscle actin (SMa) in prostate tissues of 16-week-old PB-Pten and PB-Pten-NICD mice. Scale bars: 50 µm.
Figure 9
Figure 9. Notch promotes tumor metastasis by regulating FOXC2.
(A) Schematic illustration of RBPJ binding sites in Foxc2 promoter. (B) ChIP assay for RBPJ and H3K27ac using the PB-Pten-NICD metastatic cell line. *P < 0.05 by Student’s t test. (C) Western blot analysis of phospho-P65 and FOXC2 in PB-Pten-NICD metastatic cell line with and without Bay11-7085 treatment. (D) qRT-PCR and Western blot analyses of PB-Pten-NICD metastatic cells infected with scrambled shRNA lentivirus, Foxc2 shRNA#1 lentivirus, and both. ***P < 0.001 by ANOVA Bonferroni post hoc test. (E) Growth curves of PB-Pten-NICD metastatic cells infected with scrambled shRNA lentivirus, Foxc2 shRNA#1 lentivirus, and both. No significant difference is detected among groups by 2-way ANOVA. (F) Transwell migration assay. Bar graphs show means ± SD of migrated cells per well from 3 independent experiments. *P < 0.05, ***P < 0.001 by ANOVA Bonferroni post hoc test. (G) NOD/SCID mice were inoculated with 2 × 10⁶ cells each in individual groups via tail vein. Mice were imaged 5 weeks later. Bar graphs show means ± SD of bioluminescent signals. *P < 0.05 by ANOVA Bonferroni post hoc test.
Figure 10
Figure 10. Notch activation does not confer capacity for castration resistance.
(A) Magnetic resonance imaging of PB-Pten-NICD prostate tissues before and after castration. Bar graph shows means ± SD of prostate volume based on MRI analysis. n = 3. (B) Bar graph shows prostate weight of mice 2 months after castration or sham surgery. n = 3. (C) H&E staining (top), coimmunostaining of K5 and K8 (middle), and P63 and AR (bottom) in prostate tissues of PB-Pten-NICD mice that underwent castration and sham surgery. Scale bars: 50 μm. (D) Coimmunostaining of Ki-67 and K8 in prostate tissues of PB-Pten-NICD mice that underwent castration and sham surgery. Scale bars: 50 μm. Bar graphs show means ± SD. *P < 0.05, **P < 0.01 by Student’s t test.

Similar articles

Cited by

References

    1. Kopan R, Ilagan MX. The canonical Notch signaling pathway: unfolding the activation mechanism. Cell. 2009;137(2):216–233. doi: 10.1016/j.cell.2009.03.045. - DOI - PMC - PubMed
    1. Lai EC. Notch signaling: control of cell communication and cell fate. Development. 2004;131(5):965–973. doi: 10.1242/dev.01074. - DOI - PubMed
    1. Radtke F, Raj K. The role of Notch in tumorigenesis: oncogene or tumour suppressor? Nat Rev Cancer. 2003;3(10):756–767. doi: 10.1038/nrc1186. - DOI - PubMed
    1. Ranganathan P, Weaver KL, Capobianco AJ. Notch signalling in solid tumours: a little bit of everything but not all the time. Nat Rev Cancer. 2011;11(5):338–351. doi: 10.1038/nrc3035. - DOI - PubMed
    1. Weng AP, et al. Activating mutations of NOTCH1 in human T cell acute lymphoblastic leukemia. Science. 2004;306(5694):269–271. doi: 10.1126/science.1102160. - DOI - PubMed

Publication types

MeSH terms